Ratio To Average - The Quant ScienceRatio To Average - The Quant Science is a quantitative indicator that calculates the percentage ratio of the market price in relation to a reference average. The indicator allows the calculation of the ratio using four different types of averages: SMA, EMA, WMA, and HMA. The ratio is represented by a series of histograms that highlight periods when the ratio is positive (in green) and periods when the ratio is negative (in red).
What is the Ratio to Average?
The Ratio to Average is a measure that tracks the price movements with one of its averages, calculating how much the price is above or below its own average, in percentage terms.
USER INTERFACE
Lenght: it adjusts the number of bars to include in the calculation of the average.
Moving Average: it allows you to choose the type of average to use.
Color Up/Color Down : it allows you to choose the color of the indicator for positive and negative ratios.
Simple Moving Average (SMA)

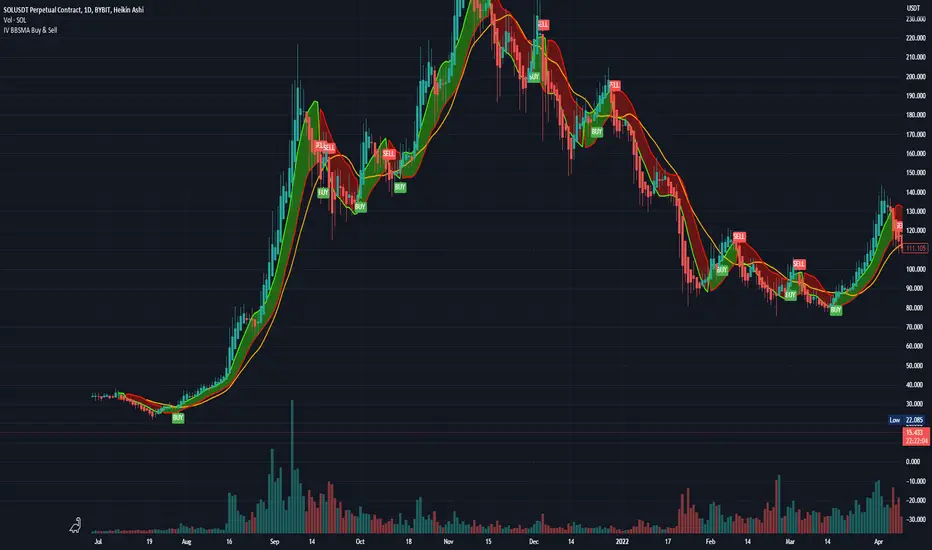
Bollinger Bands and SMA Channel Buy and Sell
This Indicator is a combination of a standard BB indicator incorporated with a SSL Channel by ErwinBeckers which is Simple Moving average with a length of set at 10 (Default) and calculates the high and low set for the default 10 to form a Channel.
The Settings for the Bollinger Band is the standard settings on a normal Bollinger Band - Length 20, source close and Standard dev 2
The setting for the SMA is length 10 and the high and low calculated or that length to form a channel.
The SMA Channel gives a green line for the Up channel and the Red line for the down Channel.
The basis of the indicator is that the Candle close above the Basis line of the BB and the SMA green line will give a buy indicator
and the same for Sell indicator the candle close below the basis BB and the SMA line Red will give a Sell indicator.
Please note that this indicator is a mix of 2 basic indicators found in Trading view, giving Buy and Sell indicators to make things easier to not look for this visually.
This code will be open source for anyone to use or back test or use it for whatever they want.
This code is for my own personal trading and cannot be relied upon. This indicator cannot be used and cannot guarantee anything, and caution should always be taken when trading. Use this with other indicators to give certanty.
Again use this for Paper Trading only.
I want to thank TradingView for its platform that facilitates development and learning.
Planetary Tunings Moving AveragesThe Pine Script "Planetary Tunings Moving Averages" is a unique tool that plots moving averages (MAs) on a chart, representing the wavelengths of different planets as derived from the book Quadrivium. These wavelengths, also referred to as 'planetary tunings', are related to the orbital resonance of each planet.
Each planetary tuning value is first transformed into a whole number by multiplying it by 1000 and removing the decimal. This whole number is then used as the length parameter for a Simple Moving Average (SMA) function. This function calculates the average of the closing prices over the defined number of periods, thereby creating a moving average line on the chart.
The moving average lines are color-coded according to the planet they represent, allowing for quick and easy interpretation. For example, Mercury's moving average line is blue, Venus's line is orange, and so forth. These colors can be adjusted directly in the Pine Script code if desired.
Additionally, the script computes the mean of all these moving averages and plots it on the chart. This line provides an overall trend line, summarizing the collective behavior of all the planetary tuning moving averages.
The drawings in the chart are fib channels and fib circles that I use to capture liquidity in time.
Please note that this script is written for Pine Script Version 4. It's crucial to ensure your TradingView platform is compatible with this version. For any issues or further clarification, consider referring to TradingView's Pine Script documentation or its community forums.

Inverted ProjectionThe "Inverted Projection" indicator calculates the Simple Moving Average (SMA) and draws lines representing an inverted projection. The indicator swaps the highs and lows of the projection to provide a unique perspective on price movement.
This indicator is a simple study that should not be taken seriously as a tool for predicting future price movements; it is purely intended for exploratory purposes.

Crypto Trend IndicatorThe Crypto Trend Indicator is a trend-following indicator specifically designed to identify bullish and bearish trends in the price of Bitcoin, and other cryptocurrencies. This indicator doesn't provide explicit instructions on when to buy or sell, but rather offers an understanding of whether the trend is bullish or bearish. It's important to note that this indicator is only useful for trend trading.
The band is a visual representation of the 30-day and 60-day Exponential Moving Average (EMA). When the 30-day EMA is above the 60-day EMA, the trend is bullish and the band is green. When the 30-day EMA is below the 60-day EMA, the trend is bearish and the band is red. When the 30-day EMA starts to converge with the 60-day EMA, the trend is neutral and the band is grey.
The line is a visual representation of the 20-week Simple Moving Average (SMA) in the daily timeframe. "Bull" and "Bear" signals are generated when the 20-day EMA is either above or below the 20-week SMA, in conjunction with a bullish or bearish trend. When the band is green and the 20-day EMA is above the 20-week SMA, a “Bull” signal emerges. When the band is red and the 20-day EMA is below the 20-week SMA, a “Bear” signal emerges. The 20-week SMA can potentially also function as a leading indicator, as substantial price deviations from the SMA typically indicate an overextended market.
While this indicator has traditionally identified bullish and bearish trends in various cryptocurrency assets, past performance does not guarantee future results. Therefore, it is advisable to supplement this indicator with other technical tools. For instance, range-bound indicators can greatly improve the decision-making process when planning for entries and exits points.

RB_Dynamic_No_Trade_ZoneThis indicator provides dynamic range information to help traders identify when a value moves out of a certain zone. This can be useful in making trading decisions. When the value falls outside of the specified range, it may indicate a good time to enter or exit a trade

BUY/SELL + ADVANCE DECLINEThis script is a custom trading view indicator that helps to identify potential buy and sell signals based on the RSI (Relative Strength Index) and SMA (Simple Moving Average) indicators. The script also identifies potential reversals using a combination of RSI and price action. It plots buy, sell, and reversal signals on the chart along with an SMA line. Additionally, it provides alerts based on the buy, sell, and reversal conditions.
Changes made to the original script:
Fixed the undeclared identifier 'c' error by calculating the difference between the current closing price and the previous closing price: c = close - close .
Added an "ADD Value Floating Label" to the chart. The label shows the difference between the current and previous closing prices (ADD value) along with a "Bullish" or "Bearish" indicator based on the value of 'c'. The label is positioned at the top right of the visible chart area and remains static.
Here's a summary of the major components of the script:
Input settings: Define the input parameters for RSI and SMA.
Calculation of RSI and SMA: Compute the RSI and SMA values based on the input parameters.
Color definitions: Define colors for different conditions and levels.
Condition definitions: Define various conditions for buy, sell, reversal, and other criteria.
Buy and sell conditions: Determine buy and sell signals based on RSI, SMA, and price action.
Reversal conditions: Identify potential reversals using RSI and price action.
Plot signals: Display buy, sell, and reversal signals on the chart.
Bar colors: Color the bars based on the identified signals.
Plot SMA: Display the SMA line on the chart.
Alert conditions: Set up alerts for buy, sell, and reversal conditions.
ADD Value Floating Label: Add a label to the chart showing the ADD value and a "Bullish" or "Bearish" indicator.

Conceptive Price Moving Average [CSM]The Conceptive Price Moving Average (CPMA) is a technical indicator designed to provide a more accurate moving average of the price by using the average of various price types, such as open, close, high, low, etc. The CPMA can help to smooth out the noise and provide a clearer picture of the overall trend by taking the average of the last 3 candles for each price type and then calculating the average of those averages.
To use the CPMA for generating buy/sell signals, you can look for crossovers of the CPMA and other commonly used moving averages, such as the 9-period EMA, 20-period EMA, 50-period EMA, 100-period EMA, and 200-period EMA, which are also plotted on the chart. When the CPMA crosses above a shorter-term moving average, such as the 9-period EMA or 20-period EMA, it can indicate a potential buy opportunity, while when the CPMA crosses below a shorter-term moving average, it can indicate a potential sell opportunity.
Based on my analysis of BankNifty and Nifty, I have found that the CPMA works best at a length of 21, showing good resistance and support for stocks. Therefore, I recommend using a length of 21 when using the CPMA for generating buy/sell signals.

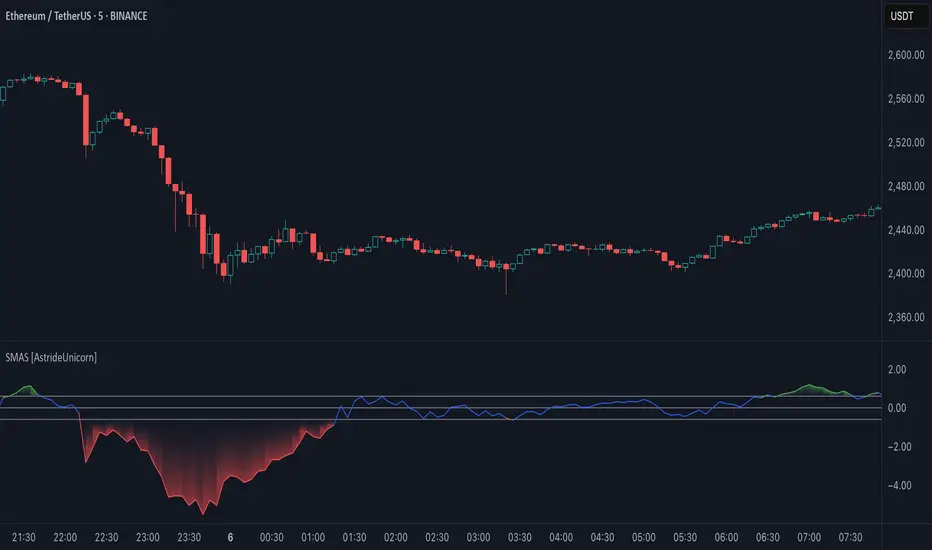
Simple Moving Average Slope [AstrideUnicorn]The Simple Moving Average Slope indicator (SMAS) is a technical analysis tool designed to help traders detect the direction and strength of the current trend in the price of an asset. It is also a great tool for identifying sideways markets. The indicator plots the slope of a simple moving average (SMA) of the closing prices over a specified time period. The slope is normalized by dividing it by the standard deviation of the slope over a longer time period.
HOW TO USE
Traders can use the Simple Moving Average Slope indicator in various ways. One common way is to look for bullish or bearish signals. A bullish signal occurs when the normalized slope rises above a predetermined threshold, resulting in the indicator turning green, indicating an upward trend in the market. Conversely, a bearish signal is generated when the normalized slope falls below the negative value of the threshold, causing the indicator to turn red, signaling a downtrend in the market. When the normalized slope falls between the positive and negative threshold values, a neutral signal is generated, indicating that the market is moving sideways. This can help traders avoid false trend signals from other indicators and strategies that may occur when the market is in a sideways regime. Additionally, traders can use the Simple Moving Average Slope indicator in conjunction with other technical indicators to confirm the trend direction.
SETTINGS
Window - specifies the number of bars used to calculate the SMA slope. The default value is 20.
Threshold - specifies the threshold value used to generate the bullish and bearish signals. The default value is 0.6. Traders can adjust these settings based on their trading strategy and the asset being analyzed.
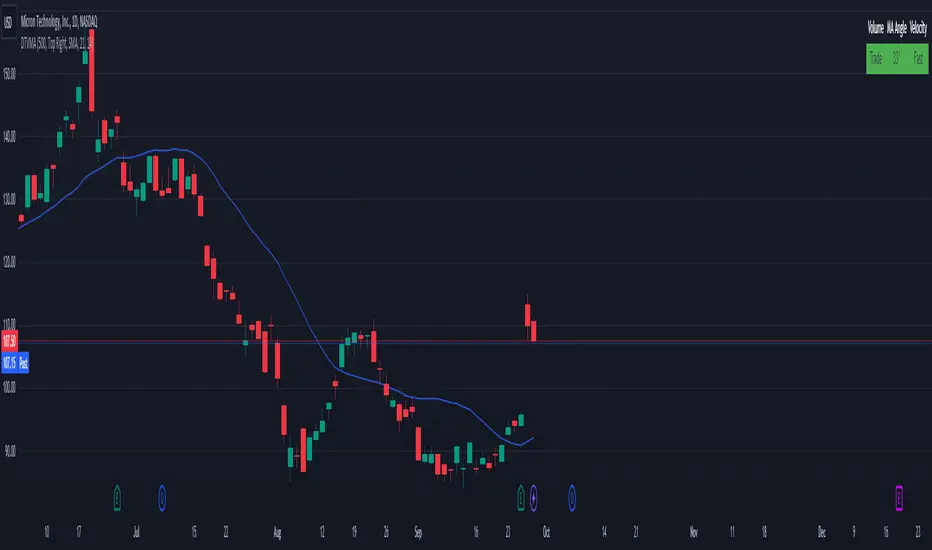
Display Trade Volume with MA Angle and Price VelocityThis Pine Script indicator is designed to provide traders with a visual representation of trade volume, moving average (MA) angle, and price velocity on a chart. The primary components of this indicator are:
Trade Volume: The indicator compares the current bar's trade volume with the average volume over a user-defined lookback period. The volume is displayed as either "Low" or "Trade" in a table, with red or green background color, respectively, to indicate whether it's below or above the average volume.
MA Angle: The indicator calculates the angle of the moving average (either Simple, Exponential, or Hull) over a user-defined length. A positive angle is shown in green, while a negative angle is shown in red. The angle is displayed in degrees in the table.
Price Velocity: This component calculates the velocity of price movement by comparing the difference between high and low prices over a user-defined lookback period. It then displays the velocity as either "Slow" or "Fast" in the table, with red or green background color, respectively, depending on whether it's below or above the average difference.
The indicator also includes alert conditions for high and low volume situations, notifying the trader when the current bar's volume is significantly higher or lower than the average volume.
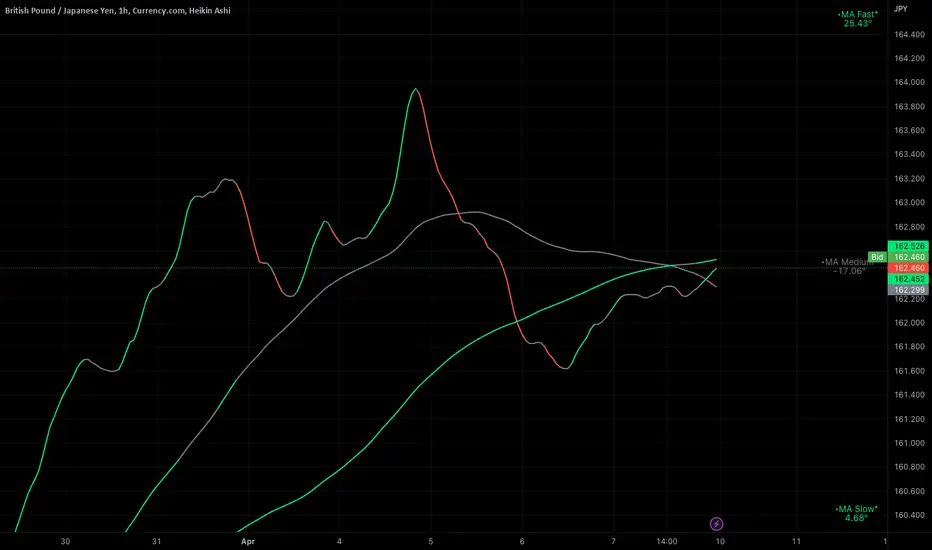
Ignition Cha Cha ChaIgnition Cha Cha Cha (ICCC) is a 3 color coded moving average indicator which numerically quantify the angle of their trends. I have labeled them as fast, medium and slow. The trend colors are Green for bullish, Red for bearish and Grey for sideways. The sideways movement can be user defined for all 3 in the settings under Threshold. If you regard for example anything under 10º as sideways then place 10 in the corresponding threshold and any angle under 10º will give a grey moving average and a grey labeled text. I use this chart in several ways. If you don't want moving averages all over your Chartistic Masterpiece you can turn off the plots and leave the numeric angles which will give you an overview of the trend. Conversely if you want to make the ultimate trend chart you can setup a 4 chart layout, Weekly, Daily, 12 hour and 4 hour and add the indicator with 200/50/25 moving averages and look for confluence. I find the best way for this is turn off the candles and use the moving averages with the numeric labels. You also have the ability to turn off and on different aspects of the indicator so that there is good control over its look. Also I have given the indicator lots of Alert presets for all 3 of the moving averages so you can avoid demented screen-stairing. Please forgive the name, my mother made me do Ballroom dancing lessons as a kid.
ADD 2This is a modification to the original ADD script by Tom1trader
I added the option to choose the timeframe, moving average type and length.
Note from the original script:
"This is the NYSE Advancers - decliners which the SPX pretty much follows. You can chart it like any index (ADD -NYSE $ADV MINUS $DECL) but I find it more useful in a separate panel with colors for direction.
The level gives an idea of days move (example: plus or minus 500 is not much movement through the session) but I follow the direction as when more stocks advance (green) or decline (red) the index tends to track it pretty closely.
On SPX , SPY and correlates - very useful for intra-day trading (Scalping or 0DTE option trades) but not for higher time frames at all. If you chart the ADD in a chart and compare 5 minute to daily you will see what I mean."

SB Multiple Moving Averages (Simple)This script contains 7 simple moving averages. You can use 1-7 moving averages on the chart. Also you can display in the table this moving averages. If the box on the chart is green , close price is above the moving average but if box is red, close price is below the moving average. And this feature is very useful because if you do not want to see the complex moving averages on the chart, you can just look the table and remove the averages on the chart.

Moving Average Lab - by InFinitoThe Moving Average Lab allows to create any possible combination of up to 3 given MAs. It is meant to help you find the perfect MA that fits your style, strategy and market type.
This script allows to average, weight, double and triple multiple types and lengths of Moving Averages
Currently supported MA types are:
SMA
EMA
VWMA
WMA
SMMA (RMA)
HMA
LSMA
DEMA
TEMA
Features:
- Double or Triple any type of Moving Average using the same logic used for calculating DEMAs and TEMAs:
In the following example you can see a normal, double and triple 200 VWMA
- Average 2 or 3 different types and lengths of Moving Average:
In the example you can see the average between a Double LSMA and a SMA
- Weight each MA manually:
The example shows the average of an HMA and a VWMA with the HMA having a weight of 2 and the VWMA having a weight of 1
- Average up to 3 personalized MAs:
The example shows the average of an EMA + a Double WMA + a Triple SMA with a 3:2:1 weighting
- Average different Moving Averages with different length each:
The example shows the average of an 800 SMA + a 400 VWMA + a 200 EMA

Short Term Bubble RiskThis risk indicator uses the extension of the closing price to the 20W SMA and displays a color-coded risk oscillator. The higher the oscillator is, the greater the short-term risk and vice-versa. This indicator has historically worked well for estimating the short-term risk of Bitcoin and Ethereum on a weekly timeframe.

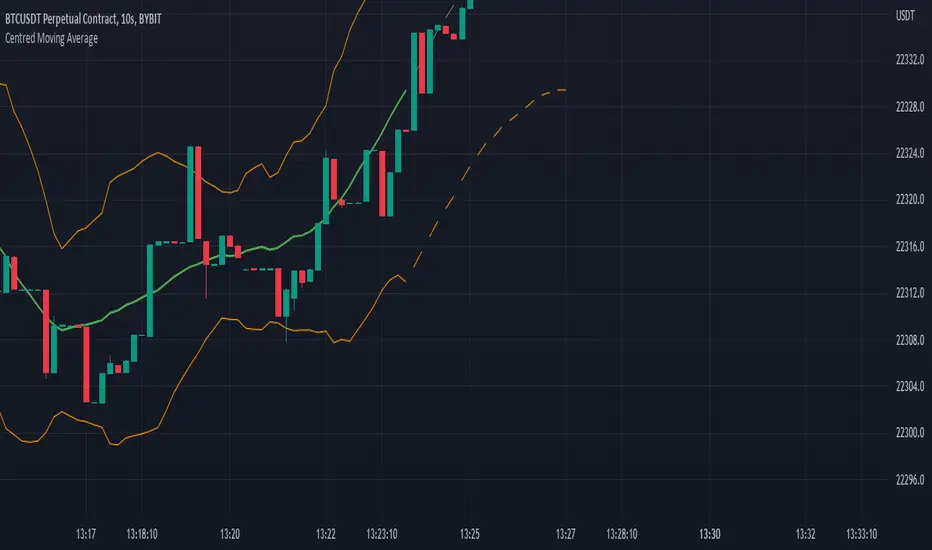
Centred Moving AverageBased around the Centered Moving Average as published by Vailant-Hero this script is revised and improved to aid with execution time & server load. For full description follow the link as above, as Valiant-Hero explains the idea perfectly well.
While the original script worked fine for small values of length, once length was extended significantly or chart timeframe set to short values then the script is prone to exceeding computation requirements. The original script was attempting to delete and re-draw (length x 3) lines on the chart for each tick. In addition to server load, once length is greater than 167 (500/3) then the first drawn lines start disappearing, so the predicted values no longer appear connected to the offset averages calculated from the candle data. A further error resulted with larger values of "length" and future data selected, in that the script would try and move lines more than 500 bars into the future.
Improvements and major code changes
All values for the predicted moving average lines are calculated from a single run through of the data, rather than having to loop back through the data "length" times (and then through it again "length" times if you selected double moving average). Each loop also inefficiently calculated the sum of "length" values by recalling each one individually.
Number of lines are thus reduced so that we're never attempting to plot more than "max_lines_count" onto the chart. User is able to select the granularity of the lines - more sections will mean a smoother line but at the expense of processing speed.
No matter the combination of "length" and the selected granularity of the lines, no line will be drawn if its endpoint would be more than 500 bars in the future.
Code for "Double SMA" only affected the predicted data values, rather than affecting the historic calculations (and standard deviation calcs) as well as the predictions. This has been included and results in much smoother lines when "Double Moving Average" is selected.
Striped lines for the predicted values - firstly to make it obvious where the "predictions" begin, and also because they look funky.
Crossing TableCrossing Table V1
I created this indicator as it had been asked for a number of times to create a crossover/under table screen and here it is!!!
The indicator is set up to be selected from SMA, EMA and Volume.
The SMA is defaulted to 2/10 but it is customizable to whatever SMA you choose to use.
Volume is based off a volume formula and the volume settings in the indicators settings, and the table will show either buyers/sellers on the last candle on the volume in the settings.
Just like the SMA the EMA option will be based off the default value of 5/13 but can be customized to your choosing.
If there are any question or comments just let me know :)

Exponential Bollinger Bands (EBB)This script is a variation of the popular Bollinger Bands indicator, which uses exponential moving averages (EMA) instead of simple moving averages (SMA) as its core calculation. The indicator is designed to provide a visual representation of volatility, with the distance between the upper and lower bands being determined by the standard deviation of the underlying data.
The script starts by defining a number of helper functions that are used to calculate the moving averages and standard deviations required for the indicator. The first helper function is sma(), which calculates the simple moving average of the input data over a specified length. This function uses linear interpolation to smooth the data when the length is not an integer. The stdev() function calculates the standard deviation of the input data using the simple moving average calculated by the sma() function.
The bes() function calculates the exponential moving average of the input data over a specified length. The estdev() function calculates the standard deviation of the input data using the exponential moving average calculated by the bes() function.
The estdev function calculates the standard deviation using an exponential moving average method, rather than the traditional simple moving average method used by the stdev function. The exponential moving average method gives more weight to recent data, which can make the estdev more responsive to recent changes in volatility. This can make it more useful in certain types of analysis, such as identifying trends in volatility. Additionally, it also uses the same EMA algorithm to calculate the average value of the data set, which can help to keep the output of the estdev and average functions consistent.
The script also defines two more helper functions, average() and standard_deviation(), which allow the user to switch between using simple moving averages (SMA) and exponential moving averages (EMA) as the basis for the indicator. These functions take three arguments, the input data, the length of the moving average, and a string that specifies whether to use SMA or EMA.
The script then defines the input parameters for the indicator. The user can choose whether to use SMA or EMA as the basis for the indicator using the select parameter. The user can also specify the length of the moving average and the multiplier for the standard deviation using the length and multiplier parameters, respectively.
Finally, the script calculates the average and standard deviation of the input data using the selected method (SMA or EMA), and plots the upper and lower bands of the indicator. The upper band is calculated as the average plus the standard deviation multiplied by the specified multiplier, while the lower band is calculated as the average minus the standard deviation multiplied by the specified multiplier.

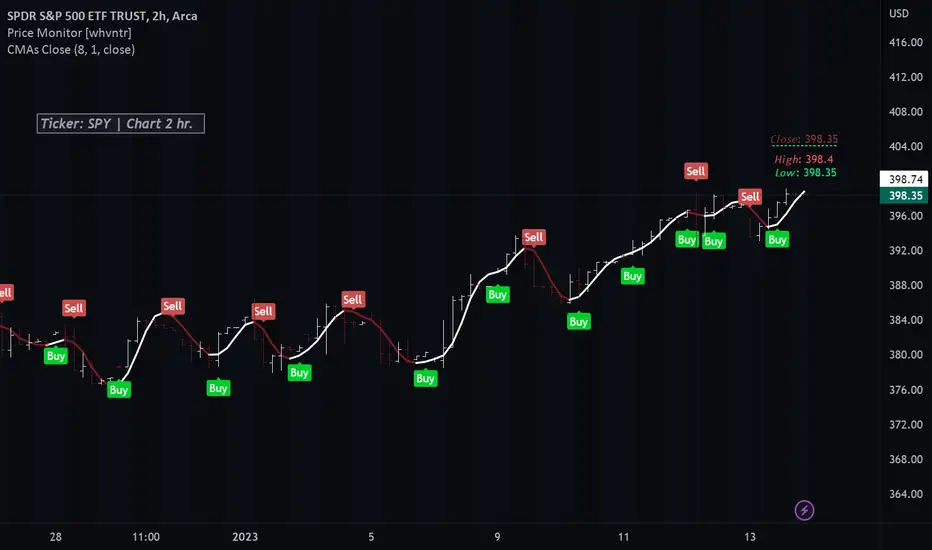
Colored Moving Averages With Close Signals[Whvntr][TradeStation]Plots the first time the close price is above or below the colored portion of the chosen MA. The MA's formula is from TradeStation's indicator: "Colored Moving Averages Can Help You Spot Trends" . I modified that indicator with customizations that include: Buy and Sell signals. Each time the current bar closes above the MA, while it's red (bearish), there's a Sell label at the start of that MA trend. Likewise: each time the current bar closes below the MA, while it's white (bullish), there's a Buy label at the beginning of that MA trend. You can now, also, easily see which MA you are selecting by hovering your cursor over the tooltips icon. I've included a modified Hull MA as default because I've found this SMA combination with the WMA to be a very smooth oscillation. I've also added some different types of MA's. Colored moving averages are helpful to determine when a trend may be reversing.
MA's
1 · Modified Hull MA: (SMA of the WMAs Hull Formula)
2 · Hull MA
3 · Exponential Moving Average
4 · Weighted Moving Average
5 · RMA Moving Average used in RSI
6 · Volume Weighted MA
7 · Simple Moving Average
This indicator isn't endorsed as a guarantee of future, favorable, results.
Price Cross ━ [whvntr]This oscillator is an attractive way to view hidden price divergence... The formula originated from the Lark, but I have cleanly displayed this information. When the two moving averages (ema) cross with a simple moving average, you find the hidden price divergence. What kind of market should you use this in? It works well when a trend is already established.
Disclaimer: This indicator does not constitute investment advice. Trade at your own
risk with this method of identifying hidden price divergence.

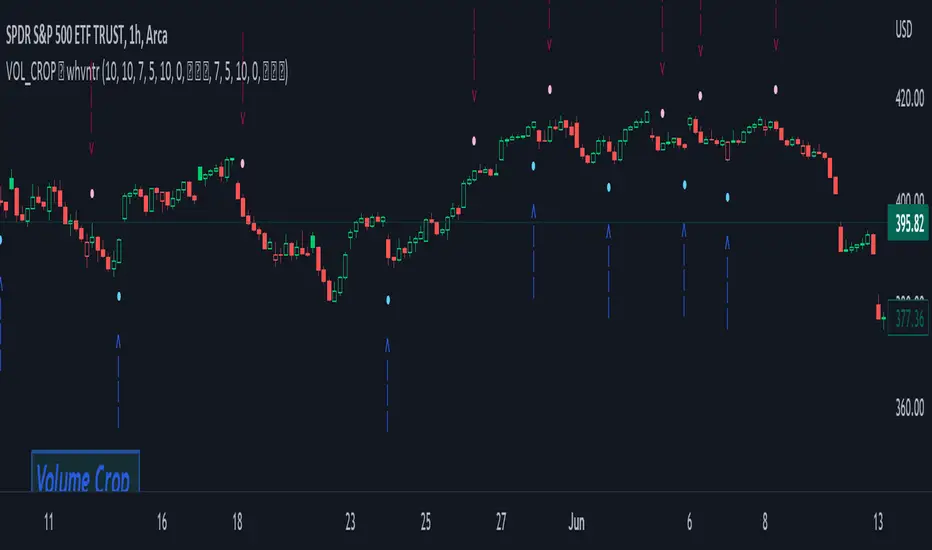
Volume Crop ━ Hidden Volume Divergence [whvntr] Volume Divergence
• Formula originated from: "Hidden Price Divergence" (circles) by TheLark. I did two things to harness its
effectiveness:
• Firstly, I developed a unique way to filter out the divergence signals that were appearing on both sides of the
midline. This filter will be known as the "Midline Tool" . It filters out a lot of the false signals commonly
associated with oscillators.
• Then, I modified the default format from Price to Volume.
• The midline formula "Midline Tool" was developed by me . It adjusts in the thousands since it's volume.
Let me know in the comments if you would rater have a smaller step value than 10,000. How does it work?
Crossover then Crossunder, the arrows only appear during the first sign of hidden volume divergence once
crossing the midline. Normally, these signs appear on both side of the midline both bearish and bullish no
matter if it's on an oversold or overbought side of the spectrum... Also, let
me know in the comments if you would like for me to release an oscillator version of this
indicator for co-witnessing.
Features:
• Volume divergence
• Midline Tool©
• Disclaimer: This indicator does not constitute investment advice. Trade at your own risk with the investments
you can afford to lose because all financial investments have risks and this is not a
guarantee that the volume divergence will be 100% all the time.
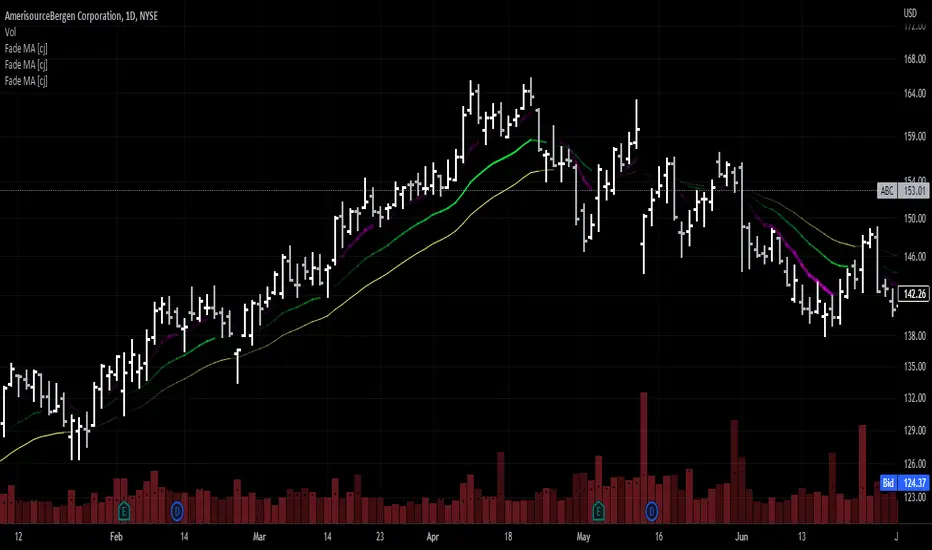
Moving Average - fade when crossed [cajole]This indicator simply provides a moving average (SMA, EMA, etc. can be selected) which hides itself when touched by the price.
Two potential uses:
Set the growth rate to be slow, to highlight only very rapid moves on a chart.
Use the default settings and change the averaging period until the MA line remains bright. This MA can then act as a good trailing stop for the specific security.
TradingView does not remember indicator settings for specific charts. Consider adding a text label to your chart after you identify the ideal trailing stop. Similar trailing-stop methods are recommended by Kristjan Qullamagie is identical to Jesse Stine's "magic line" concept .
Ichimoku MA Up & DownIchimoku and MA use the default.
It is repainted because it uses a moving average line.
A marker is only true if it was created after the candle closed.
The principle is too simple.
Please enjoy using it.
- Up : Conversion Line > MA #1 and Base Line > MA #2
It is an uptrend. The short-term moving average should be above the conversion line. And the long-term should be above the Base Line.
- Down : Conversion Line < MA #1 and Base Line < MA #2
It's a downtrend. The short-term moving average should be below the conversion line. And the long-term should be below the Base Line.
You can get better results if you use a momentum indicator like RSI.
Thank you.
