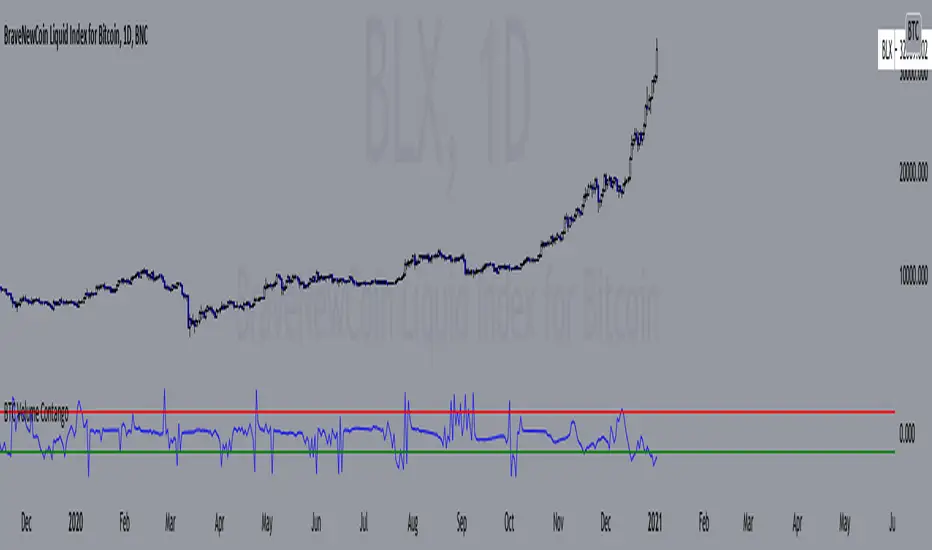
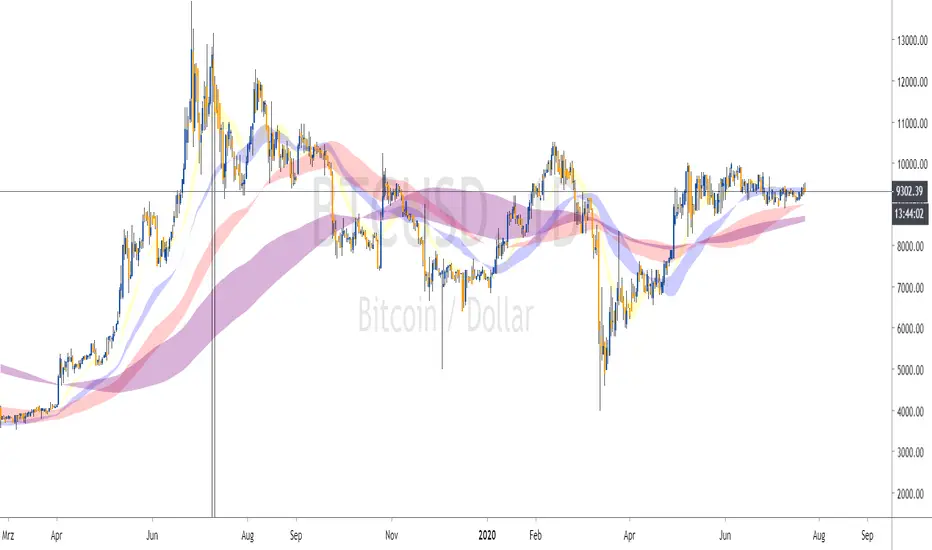
BTC Volume Contango IndexBased on my previous script "BTC Contango Index" which was inspired by a Twitter post by Byzantine General:
This is a script that shows the contango between spot and futures volumes of Bitcoin to identify overbought and oversold conditions. When a market is in contango, the volume of a futures contract is higher than the spot volume. Conversely, when a market is in backwardation, the volume of the futures contract is lower than the spot volume.
The aggregate daily volumes on top exchanges are taken to obtain Total Spot Volume and Total Futures Volume. The script then plots (Total Futures Volume/Total Spot Volume) - 1 to illustrate the percent difference (contango) between spot and futures volumes of Bitcoin. This data by itself is useful, but because aggregate futures volumes are so much larger than spot volumes, no negative values are produced. To correct for this, the Z-score of contango is taken. The Z-score (z) of a data item x measures the distance (in standard deviations StdDev) and direction of the item from its mean (U):
Z-score = (x - U) / StDev
A value of zero indicates that the data item x is equal to the mean U, while positive or negative values show that the data item is above or below the mean (x Values of +2 and -2 show that the data item is two standard deviations above or below the chosen mean, respectively, and over 95.5% of all data items are contained within these two horizontal references). We substitute x with volume contango C, the mean U with simple moving average ( SMA ) of n periods (50), and StdDev with the standard deviation of closing contango for n periods (50), so the above formula becomes: Z-score = (C - SMA (50)) / StdDev(C,50).
When in contango, Bitcoin may be overbought.
When in backwardation, Bitcoin may be oversold.
The current bar calculation will always look incorrect due to TV plotting the Z-score before the bar closes.
Simple Moving Average (SMA)
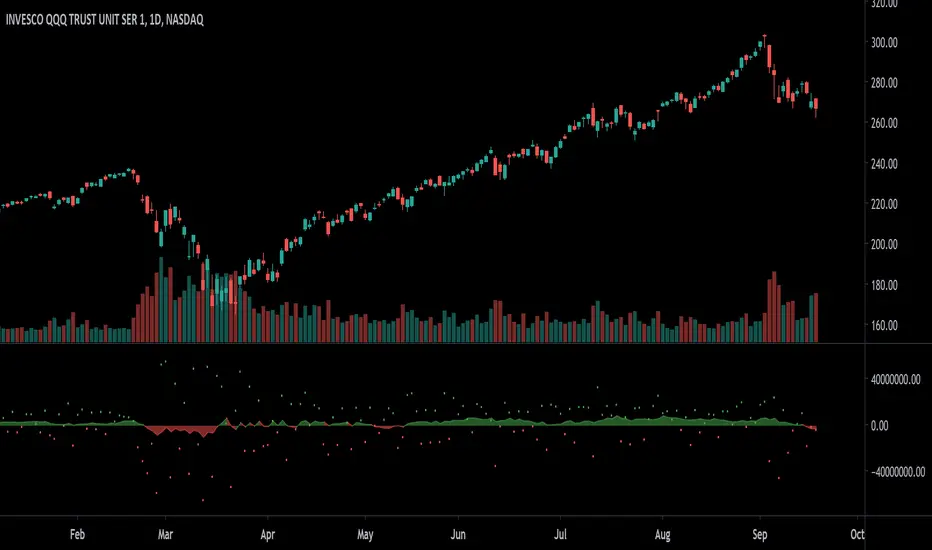
Closing RangeIndicator shows the closing range of each bar. Closing range is where the bar closes (high - close) relative to the length of the wick (high - low). A close at the top of the wick would be 100%, middle 50%, bottom 0%.
In addition, the indicator multiplies closing range by volume to weight toward high volume days.
A simple moving average is applied to visualize trend in volume-weighted closing range over time.
Options include changing the threshold of bullish closes. The default is 50%, but you can view a close above 40% as a bullish.
Simple moving average can be enabled/disabled as well as the length adjusted.
Vervoort SmoothingThis script has both the Triple Exponential Moving Average (TEMA) and zero lag sma written as functions. Both from Capturing Profit with Technical Analysis (24-25) by Sylvain Vervoort.
Best regards,
capam

multi MA by Liquidator15 MA in a single indicator script.
7 different MA types:
- SMMA
- EMA
- SMA
- MG
- TMA
- DCF
- LSMA
multi timeframe.

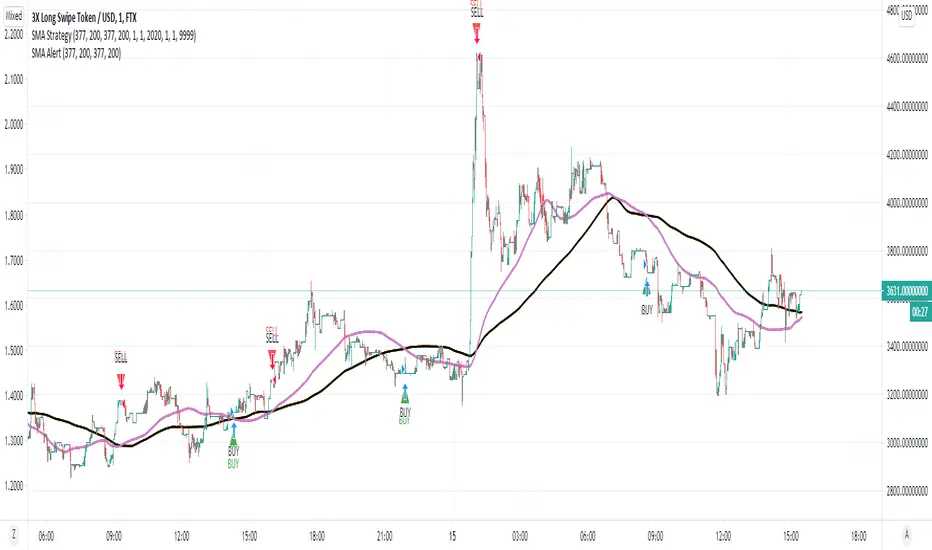
SMA Strategy - Indicator Version for AlertIn this indicator, I made use of two different sma intersections for buying and selling points. You can use the intersection of 2 sma values for buying and 2 separate sma intersection for selling.
There are 3 different alarms for those who want to set an alarm.
- Cross Alarm: The alarm that will work on buy-sell signals for those who have the right to set a single alarm.
- Buy Alarm: The alarm that will operate at the receiving point according to the values you specified.
- Sell Alarm: The alarm that will operate at the sales point according to the values you specify.
Static + Dynamic LevelsShows static and dynamic levels which can act as support/resistance. These are important as there is a lot of users who are interested in buying/selling at these prices.
Static Levels include -
Daily/Weekly/Monthly/Yearly Open (changes color depending on if below or above price)
Previous Daily/Weekly/Monthly/Yearly Open
Previous day's High/Low
Dynamic Levels include -
100/200 Daily MA
100/200 Weekly MA

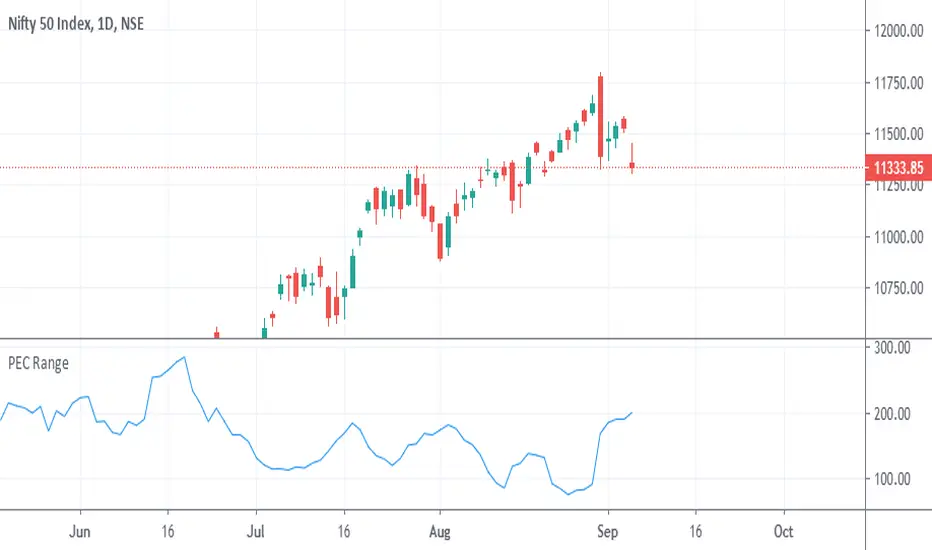
PEC Range (Prefer on 1D chart)Price Expansion and Contraction is basic calculation of Candles High-Low and it is average of previous 5 High-Low. Which will help to analyse volatility of running situation. This can be used for analysis purpose only not as buy/sell signals.
How to use this?
Ranges of candles may increase on lower value of PEC.
Ranges of candles may decrease on high of PEC.
This is not ATR of 5 period.
Barcolor Averaging1. Colors candles or bars, ascending (blue) or descending (red), as determined by the MA setting.
2. Colors candles white when the MA is flat, or the market is moving sideways or in consolidation.

Moving Average Colored EMA/3 SMA1. Updated this available script to have 2 SMA's and 2 EMA's.
2. Revised so that plot turns white when flat.
3. Added Trend Gain to control what slope "flat" has for different TF's.

Golden Ratio MultiplierThe moving averages 350 and 111 by themselves do a great job of identifying market tops/bottoms. The fraction 350/111 is very close to Pi as well (3.15) so that's is suspicious in its own right.
Nonetheless, fibonacci retracements/multiplies of the 350 SMA does a remarkable job of finding reversal points. I commented out a couple of multiplies for simplicity's sake (the lines became rather crowded). However, the script is open source so you all can copy it into Pine Editor and delete the "//" and add it back to the script.
Cheers.

AK Simple Moving Average 50 days Simple Moving average suitable for Intraday on 1Hr,30Min.15Min Time frames
1. When candle crossing above SMA Line - Go for Long Entries
2. When candle crossing below SMA Line - Go for short Entries
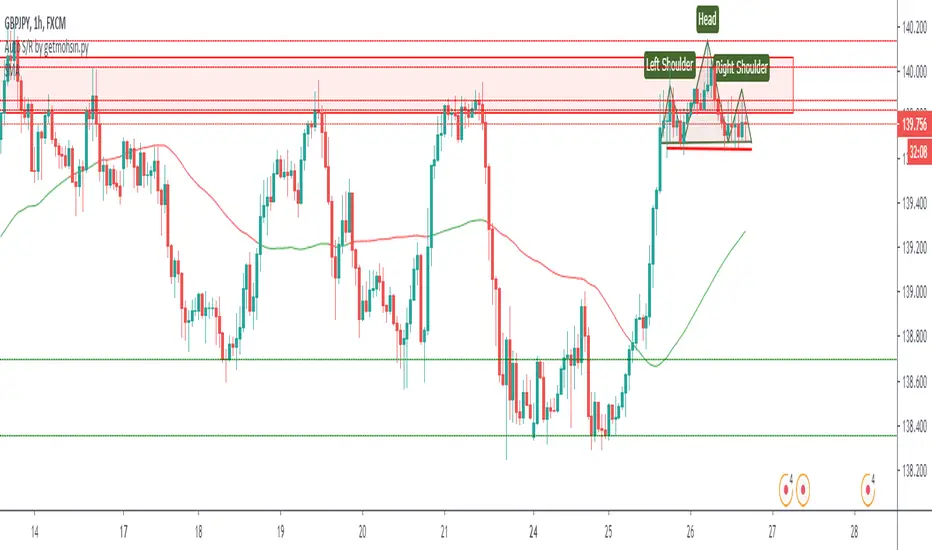
Deep_Fractal_Signals_and_Rubber_Band_TradesThis indicator is based on Williams Fractals and the TopDog Trading "Rubber Band Trade"
The Deep Fractal Signals are triangles that indicate the price is forming a pattern of decreasing lows in a down trend (orange) or, increasing highs in an up trend (green).
The triangles are placed above or below the last bar of the pattern, unlike Fractals which are drawn 2 candles prior to the current candle, and are re-painted on the chart.
When the triangle is indicated above the moving average in a down trend (blue), or below the moving average in an up trend (yellow), this is a Rubber Band Trade.
When the slope of the moving average is less than the Gain set by the user, or are counter-trend, the triangles are plotted in silver.
When used in conjunction with the Power Analyzer indicator, a signal to the long side should be taken when the Power Analyzer momentum indicator is at a cycle low. Similarly, a signal to the short side should be taken when the indicator is at a cycle high.
The first, second or third signal in a new trend have the highest probability of a follow through.
The indicator sometimes gives a false signal at the very end of the trend, just before the market reverses. This is an attempt by the Market Makers to persuade traders that the trend will continue.
Please leave a comment and "Like" this indicator if you find it useful.
FX Engineering

MTF SMA on specific timeframe(5M-4H)Japanese below. 日本語の説明は下記
This is multi time frame simple moving average that is shown only on the specific timeframe; 5M, 15M, 30M, 1H, 4H.
Problem of conventional MTF moving average is that MTF MA is sometimes annoying especially when you look at upper timeframe such as daily chart and/or weekly chart.
e.g. You set 20 MA of 4 hour chart into 1 hour chart, however, when you look at daily chart, daily chart also shows 20MA of 4 hour chart which is unnecessary.
This is why I have developed this MTF SMA indicator shown only on the timeframe from 5M to 4 hour.
With this indicator, even if you set MA of upper timeframe(such as 4 hour) into Lower timeframe, that MA will not be shown on above daily chart.
You can customize adding or removing below code;
timeframe.period == “X”? security(syminfo.tickerid, res, sma(src, ma_len))
X is the timeframe that you would add/remove from the indicator.
——————————————————————————————
特定の時間軸にのみ表示されるマルチタイムフレーム移動平均線のインジケーターです。
従来のマルチタイムフレーム移動平均線の問題点は、上位足に切り替えた時にもマルチタイムフレーム移動平均線の設定が表示され、チャートが見にくくなる点でした。
例: 4時間足の20MAをマルチタイムフレーム移動平均線としてセットしたとします。この場合、1時間足などの下位足で4時間足の20MAが表示されることになりますが、同時に日足や週足といった上位足チャートを見る時にも、この4時間足の20MAが表示されてしまいます。
このインジケーターでは、従来のマルチタイムフレーム移動平均線と同様に、設定元となる上位足の時間軸(4時間、日足など)を選択し、期間とソースを設定することができる一方で、表示されるのは5分足、15分足、30分足,1時間足、4時間足のみとなります。
スクリプトのMAの取得部分に以下コードを追加することで、必要な時間軸を追加・削除することが可能です。
timeframe.period == “X”? security(syminfo.tickerid, res, sma(src, ma_len))
Xは表示したい時間軸です。4時間足チャートからこのインジケーターを削除したい場合は
timeframe.period == “240”? security(syminfo.tickerid, res, sma(src, ma_len))
を削除してください。

2-Year MA MultiplierThis script improves on the basic moving average multiplier script by adding inputs for the multiplier and moving average type.


Multi EMA+SMAMulti EMA+SMA with default value of 20/50/200 ... User can change value and color as required... As ema and sma both has same value thats why only three lines are visible, changing value will reflect other Moving averages. Hope it will help my trader friends.
Love
Indyan...

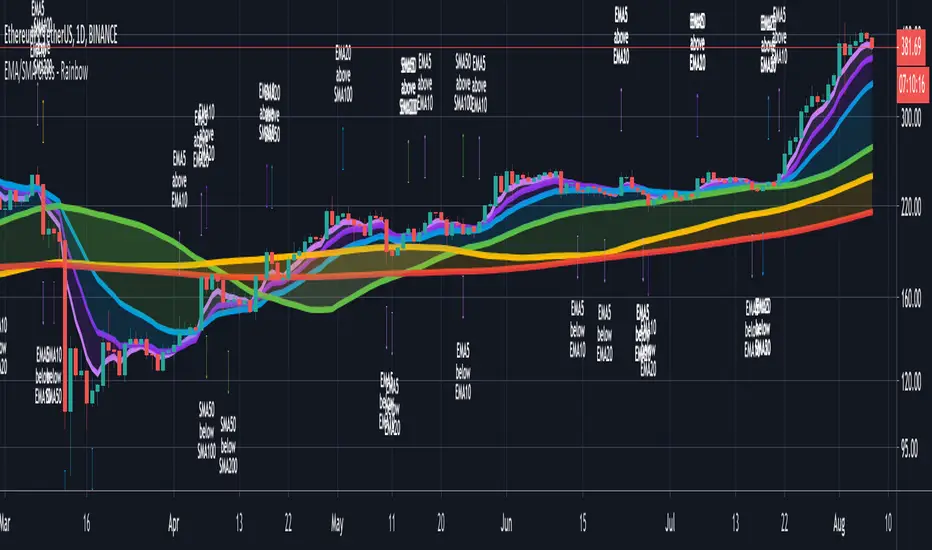
CryptoSignalScanner - Advanced Moving Averages - Cross & RainbowDESCRIPTION:
With this script you can plot 6 moving averages.
You can decide which Moving Average you want to show or hide.
For every plot you can decide to display the Simple Moving Average ( SMA ) or Exponential Moving Average ( EMA ).
It provides CrossOver and CrossUnder labels when loading the script. Those labels you can show or hide.
You have the possibility to show or hide the rainbow colors. This rainbow function gives you a clear view of the current trend.
HOW TO USE:
• When one Moving Average crosses above another Moving Average it signals an uptrend.
• When one Moving Average crosses below another Moving Average it signals a downtrend.
• The higher to length of the Moving Average the stronger the trend.
FEATURES:
• You can show/hide the preferred Moving Averages.
• You can set the length, type and source for every Moving Average.
• You can show/hide the rainbow colors.
• You can show/hide the CrossUp labels.
• You can show/hide the CrossDown labels.
• You can set alerts for every Moving Average.
• Etc...
DEFAULT SETTINGS:
• MA1 => EMA5
• MA2 => EMA10
• MA3 => EMA20
• MA4 => SMA50
• MA5 => SMA100
• MA6 => SMA200
Simple Moving Average vs. Exponential Moving Average:
SMA and EMA are calculated differently. The exponential moving average ( EMA ) focuses more on recent prices than on a long series of data points, as the simple moving average required.
The calculation makes the EMA quicker to react to price changes and the SMA react slower. That is the main difference between the two.
One is not necessarily better than another. It comes down to personal preference. Plot an EMA and SMA of the same length on a chart and see which one helps you make better trading decisions.
Moving Average Trading Strategies:
The first strategy is a price crossover, when the price crosses above or below a moving average, it signals a potential change in trend.
The second strategy applies when one moving averages crosses another moving average.
• When the short-term MA crosses above the long-term MA, it signals a buy signal.
• When the short-term MA crosses below the long-term MA, it signals a sell signal.
REMARKS:
• This advice is NOT financial advice.
• We do not provide personal investment advice and we are not a qualified licensed investment advisor.
• All information found here, including any ideas, opinions, views, predictions, forecasts, commentaries, suggestions, or stock picks, expressed or implied herein, are for informational, entertainment or educational purposes only and should not be construed as personal investment advice.
• We will not and cannot be held liable for any actions you take as a result of anything you read here.
• We only provide this information to help you make a better decision.
• While the information provided is believed to be accurate, it may include errors or inaccuracies.
If you like this script please donate some coins to share your appreciation.
Good Luck,
SEOCO
Hannibal's Quadruple SMA IndicatorFour SMAs, one indicator. Great for the moving average enthusiast. Planning on adding alerts, trade signals, etc.

SMA 9/50/180 | EMA 20 | BUY/SELLAllows for 3 SMAs and One EMA, Combined with Buy/Sell Indicator
Defaults to following settings:
9 SMA - Red
50 SMA - Blue
180 SMA - White
20 EMA - Yellow
Input Values and Colors can be modified
Recommend changes to the Style default
-uncheck SMA2
-uncheck Buy/Sell Chart Line

All EMA & MA in onDas Script zeigt EMA sowie MA 21, 50 ,100, 200
Es sind alle Farben einstellbar sowie die bereiche zwischen EMA und MA als Zone einfärbbar.
COVID19 New Cases & Threshold per 100k inhabitantsGoal is to be able to keep track of new COVID cases and see when the relative threshold is passed.
The default threshold is set to 10 new cases per 100.000 inhabitants per 14-days, please change the available inputs to change this metric
Out of curiosity I've added the population density. Because people generally live and socially interact on land I've used the land-area for population density calculation.
When comparing metrics between countries there are many more factors to be considered.
Create your own symbol list for the CONFIRMED tickers:
Create a new list
Paste the following text where you would add a symbol:
COVID19:CONFIRMED_AT,COVID19:CONFIRMED_BE,COVID19:CONFIRMED_DK,COVID19:CONFIRMED_FI,COVID19:CONFIRMED_FR,COVID19:CONFIRMED_DE,COVID19:CONFIRMED_IS,COVID19:CONFIRMED_IE,COVID19:CONFIRMED_IT,COVID19:CONFIRMED_LV,COVID19:CONFIRMED_LI,COVID19:CONFIRMED_LT,COVID19:CONFIRMED_LU,COVID19:CONFIRMED_MT,COVID19:CONFIRMED_MD,COVID19:CONFIRMED_MC,COVID19:CONFIRMED_NO,COVID19:CONFIRMED_PL,COVID19:CONFIRMED_PT,COVID19:CONFIRMED_RO,COVID19:CONFIRMED_RU,COVID19:CONFIRMED_SK,COVID19:CONFIRMED_SI,COVID19:CONFIRMED_ES,COVID19:CONFIRMED_SE,COVID19:CONFIRMED_CH,COVID19:CONFIRMED_TR,COVID19:CONFIRMED_UA,COVID19:CONFIRMED_AE,COVID19:CONFIRMED_AR,COVID19:CONFIRMED_AU,COVID19:CONFIRMED_BR,COVID19:CONFIRMED_CA,COVID19:CONFIRMED_CL,COVID19:CONFIRMED_CN,COVID19:CONFIRMED_CO,COVID19:CONFIRMED_HR,COVID19:CONFIRMED_ID,COVID19:CONFIRMED_IL,COVID19:CONFIRMED_IN,COVID19:CONFIRMED_IR,COVID19:CONFIRMED_JP,COVID19:CONFIRMED_KR,COVID19:CONFIRMED_KW,COVID19:CONFIRMED_MX,COVID19:CONFIRMED_MY,COVID19:CONFIRMED_NZ,COVID19:CONFIRMED_PE,COVID19:CONFIRMED_PH,COVID19:CONFIRMED_SG,COVID19:CONFIRMED_TH,COVID19:CONFIRMED_US,COVID19:CONFIRMED_US_AZ,COVID19:CONFIRMED_US_CA,COVID19:CONFIRMED_US_FL,COVID19:CONFIRMED_US_IL,COVID19:CONFIRMED_US_MA,COVID19:CONFIRMED_US_NC,COVID19:CONFIRMED_US_NJ,COVID19:CONFIRMED_US_NY,COVID19:CONFIRMED_US_TX,COVID19:CONFIRMED_UZ,COVID19:CONFIRMED_VE,COVID19:CONFIRMED_ZA

Mayer MultiplesScript that plots the 200 Moving average, and several Mayer Multiple levels in the chart. This may help guestimate TP levels
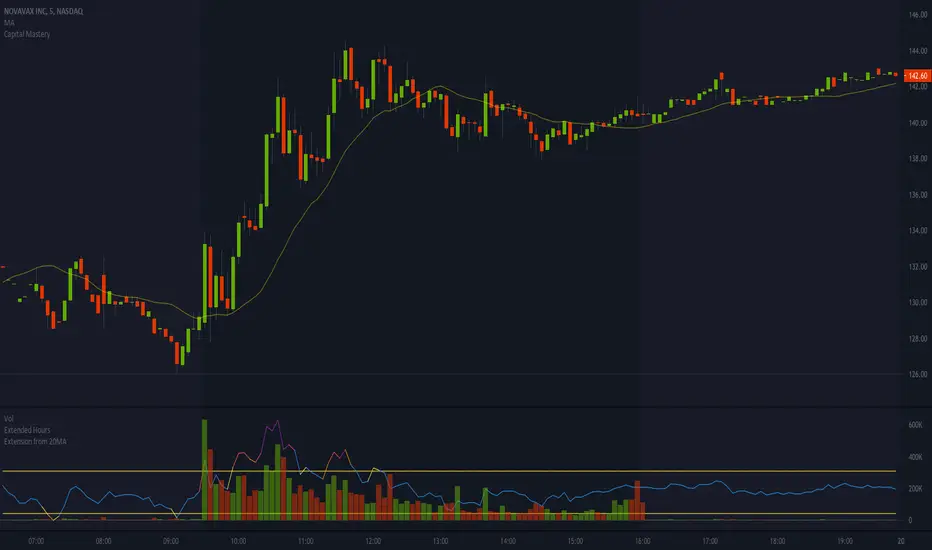
Extension from 20 Period Simple Moving AverageSimple indicator to help show when stocks are over extended intraday. It's based on the distance between a stock and it's moving average. The thesis being that, the farther away a stock is from it's 20 period simple moving average, the move extended it is. I've found that when a stock is more than 2-3% extended from it's 5min 20 period moving average, it's typically getting over extended, and can be a great time to start considering a short.
I primarily use this indicator when shorting intraday parabolic moves, while the stock is still on the frontside of the move. Note that this works best when the indicator is showing overextended AND there's a volume spike/mountain matching the overextension. In the attached example, you can see that I overlay this indicator on top of the volume panel because it helps me better visualize when the stock is getting over extended on heavy/elevated volume.
Hope this helps; any feedback is appreciated!
P.S. This works best on a 5min chart, but I'm sure it could be helpful on other timeframes, but may need to tweak the default outer bounds percentage.