Smoothed

1LC-LSMA (1 line code lsma with 3 functions)Even Shorter Estimation
I know that i'am insistent with the lsma but i really like it and i'm happy to deconstruct it like a mad pinescript user. But if you have an idea about some kind of indicator then dont hesitate to contact me, i would be happy to help you if its feasible.
My motivation for such indicator was to use back the correlation function (that i had putted aside in the ligh-lsma code) and provide a shorter code than the estimation using the line rescaling method (see : Approximating A Least Square Moving Average In Pine) .
The Method
Fairly simple, lets name y our estimation, we calculate it as follow:
y = x̄ + r*o*1.7
where x̄ is the price moving average, r the correlation between the price and a line (or n) and o the standard deviation. If plotted against a classic lsma the difference would be meaningless at first glance so lets plot the absolute value between the difference of the lsma and our estimation of both period 100.
The difference is under 0.0000 on eurusd, its really low.
In general the longer the period of the estimation, the lower the difference between a normal lsma, but when using shorter period they can differ a little bit.
Why 1.7 ?
We need to multiply the standard deviation by a constant in order to match the overshoot and the rise-time of the original lsma. The constant 1.7 is one that work well but actually this constant should be dependant of the length period of the filter to make the estimation more accurate.
More About Step-Response
Most of the time when a filter have less lag, it mean that he induce overshoot in order to decrease the rise-time . Rise-time is the time the output take to match the target input, its related to the lag. Overshoot mean that the output exceed the target input, you can clearly see those concept in the image above.
Conclusion
I've showed that its possible to be even more concise about the code it take to estimate an lsma. I've also briefly explained the concept of rise-time and overshoot, concepts really important to signal processing and particularly in filter design. I'm sure that it can be even more simplified and i have some ideas for such estimate.
Thanks for reading !

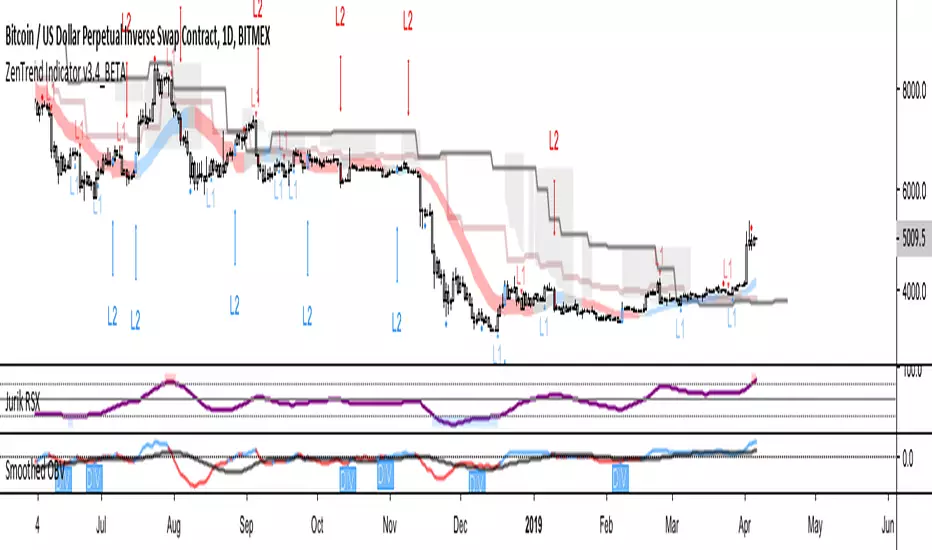
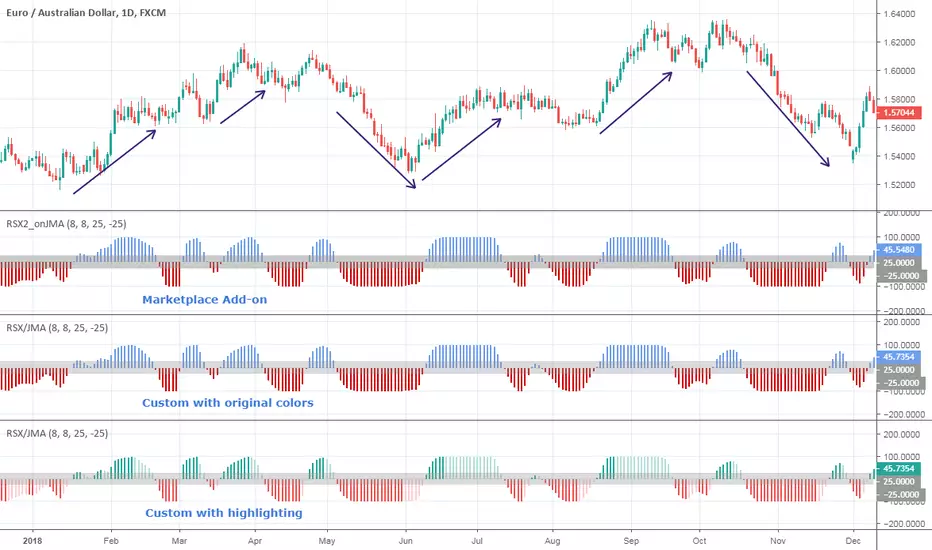
Jurik RSX on JMAHello friends,
Meet Jurik RSX on JMA — a refined version of Jurik's classic RSX that applies advanced pre-smoothing using the best
original JMA clone available on TradingView. By filtering the input price through JMA, it delivers a cleaner, faster, and more efficient representation of market momentum — maintaining exceptional smoothness with almost no lag.
🛠 How It Works
RSX is Jurik's noise-free alternative to the traditional RSI, designed to measure trend direction and efficiency with minimal distortion. However, when the input price is noisy, even RSX can lose precision.
To solve this, the input price is first smoothed with JMA — Jurik's most advanced low-lag filter. As Jurik Research noted:
“A smooth (low noise) trend is more efficient than a noisy trend... RSX would respond better when fed pre-smoothed price data. And there's no better way to pre-smooth than by using JMA.”
This approach allows RSX to reverse with the market almost instantly , reacting sharply to genuine turning points while ignoring random fluctuations — providing traders with a clear, stable view of trend dynamics.
🔥 Key Features
JMA pre-smoothing integrated with Jurik RSX
Near-zero lag response with reduced noise
Optional overbought/oversold breakout highlighting
If you have any questions or would like to explore related Jurik-based tools, feel free to contact me directly via DM.
👋 Good luck and happy trading!
Skrip berbayar

Smooth StrategyThis strategy utilizes a smoothed moving average to identify the current trend on the resolution being viewed. The trend is also the signal for entries and occasional exits. The majority of exits will be determined using an additional smoothed moving average of shorter length. There is much more to come for this one, but it seems to be working fantastically in it's current state. Please let me know if you have any questions or recommendations. Thanks for checking it out! :D
**Donations gladly accepted!**
BTC: 3BD2XayQThb7xpm3oaoatFSaXvGp2eKZKv
ETH: 0x9aEcD18a3d6b2f4b4DE04Bf0d05C587F6512f814
LTC: ltc1q4ens854grkpvgutxgelheju3ug99hjxhg0trxf
KMD: RSgTKS911YA2WbFPkBjho2Y3EntyVzkgcj

Smoothed RSI EMAThis is a smoothed version of RSI indicator with an EMA of RSI for signal.
RSI works better for long-term overbought and oversold price levels, and it is great by determining the beginning and ending of bull/bear markets when the weekly RSI crosses one of its thresholds (40 and 60). Two modifications to help smooth the raw RSI signal: the input into the 16-week RSI (useful 16 to 24) is modified by taking the average of the high, low and close; the RSI value is also smoothed with a 3-period EMA.

Adaptive StochasticAdapt To The Right Situation
There are already some Adaptive Stochastic scripts out there, but i didn't see the concept of using different periods highest/lowest for their calculations. What we want
for such oscillator is to be active when price is trending and silent during range periods. Like that the information we will see will be clear and easy to use.
Switching between a long term highest/lowest during range periods and a short term highest/lowest during trending periods is what will create the adaptive stochastic.
The switching is made thanks to the Efficiency Ratio , the period of the efficiency ratio is determined by the length parameter.
The period of the highest and lowest will depend on the slow and fast parameters, if our efficiency ratio is close to one (trending market) then the indicator will use highest and lowest of period fast , making the indicator more reactive, if our efficiency ratio is low (ranging market) then the indicator will use highest and lowest of period slow , making the indicator less reactive.
The source of the indicator is a running line ( lsma ) of period slow-fast .
it is also possible to switch the parameters values, making the indicator reactive during ranging market and less reactive during trending ones.
Hope you enjoy
For any questions/demands feel free to pm me, i would be happy to help you

Jurik VelocityHello friends,
Meet Velocity, Jurik's ultra-smooth alternative to the traditional momentum indicator. Designed to reveal the true pace of market movement without the typical noise and lag, it offers a more accurate view of acceleration and deceleration in price. Includes an optional normalization mode to ensure the scale remains consistent across all markets.
🛠 How It Works
What's wrong with classical momentum? The standard momentum indicator is often too noisy to be useful. Traders try to fix this by applying moving averages — which smooths it, but at the cost of responsiveness.
Velocity solves this by using Jurik's non-lagging smoothing method that removes noise without delay , maintaining the sharpness of turning points while filtering out irrelevant fluctuations.
Like the classical momentum, Velocity compares the current price with that from N periods ago, but with vastly improved clarity. It helps traders detect early shifts in trend strength, exhaustion points, and potential reversals — all while keeping a steady, normalized scale for cross-market consistency.
🔥 Key Features
Non-lagging Jurik smoothing — clarity and responsiveness without delay
Highlights bullish and bearish velocity peaks for precise timing
Integrated alert conditions for velocity peak events
📸 Visual Examples
Velocity with peaks highlighting
If you'd like access or have any questions, feel free to reach out to me directly via DM.
👋 Good luck and happy trading!
Skrip berbayar

Karobein OscillatorDeveloped by Emily Karobein, the Karobein oscillator is an oscillator that aim to rescale smoothed values with more reactivity in a range of (0,1)
Calculation
The scaling method is similar to the one used in a kalman filter for the kalman gain.
We first average the up/downs x, those calculations are similar to the ones used for calculating the average gain/loss in the relative strength index.
a = ema(src < src ? x : 0,length)
b = ema(src > src ? x : 0,length)
where src is a exponential moving average of length period and x is src/src in the standard calculations, but anything else can be used as long as x > 0 .
Then we rescale the results.
c = x/(x + b)
d = 2*(x/(x + c*a)) - 1
How To Use
It is better to use centerline-cross/breakouts/signal line.
In general when we use something smooth as input in oscillators, breakouts are better than reversals, you can see this with the stochastic and rsi.
So a simple approach could be buying when crossing over 0.8 and selling when crossing under 0.2.
Here is the balance of a strategy using those conditions, length = 50 .
20 trades have been mades since the 29 oct we made 341 pips with eur/usd, of course this backtest was made during good trends period,
this result is not representative of how the strategy work with other conditions/markets.
For any questions/suggestions feel free to contact me

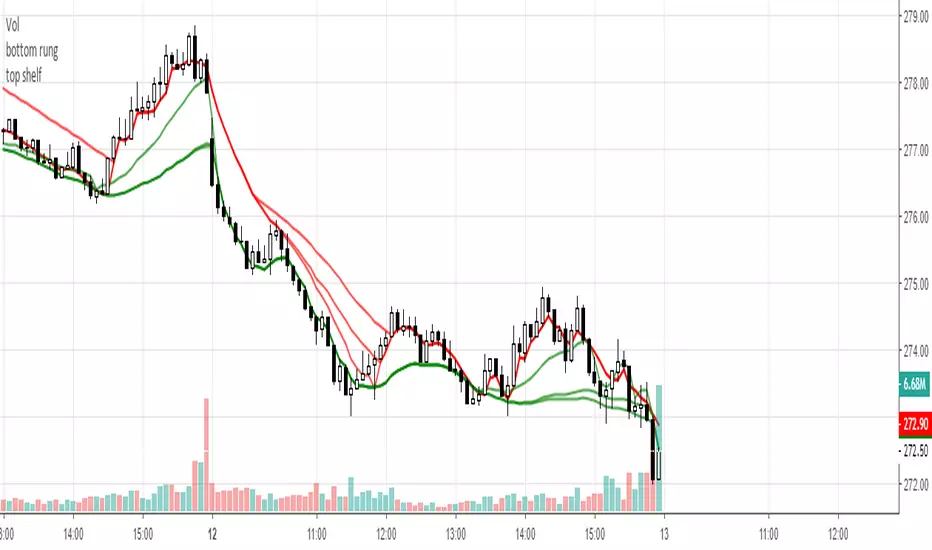
Squam's top shelfThis is a means to find the highest triple moving average input from an array of triple moving averages. The effect is to dampened the impact of price changes and look for a critical level to qualify a good or bad trades. If the price closes above a rising red line the odds probably favor a long. If the price closes below a declining red line the odds probably favor a short. There is another script that will cover the opposite priority for the highest triple moving average input from an array of triple moving averages.
-Squam
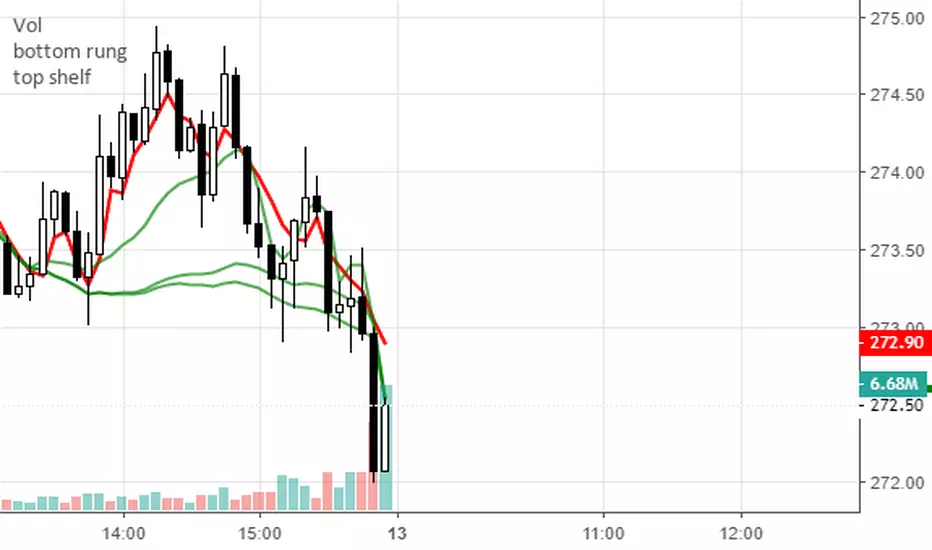
Squam's bottom rungThis is a means to find the lowest triple moving average input from an array of triple moving averages. The effect is to dampened the impact of price changes and look for a critical level to qualify a good or bad trades. If the price closes above a rising green line the odds probably favor a long. If the price close below a declining green line the odds probably favor a short. There is another script that will cover the opposite priority for the highest triple moving average input from an array of triple moving averages.
-Squam
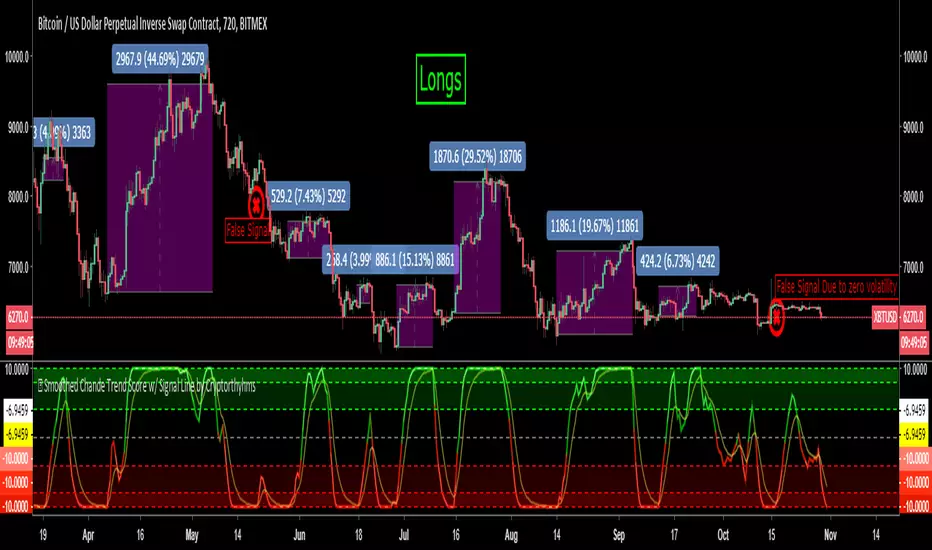
Smoothed Chande Trend Score w/ Signal Line by Cryptorhythms🆓 Smoothed Chande Trend Score w/ Signal Line by Cryptorhythms
👀Did not see this one in the public library yet, so here you go! I added an ema signal line that you can configure the length on. Also dressed it up a little with OB/OS zones and some purdy colors.
Here are long + short charts:
👍Enjoying this indicator or find it useful? Please give me a like and follow! I post crypto analysis, price action strategies and free indicators regularly.
💬Questions? Comments? Want to get access to an entire suite of proven trading indicators? Come visit us on telegram and chat, or just soak up some knowledge. We make timely posts about the market, news, and strategy everyday. Our community isnt open only to subscribers - everyone is welcome to join.
Description written by Chande...
As you may have noticed, a number of rather complicated indicators are available to measure trend strength. None of these indicators, unfortunately, is perfect. You could use J. Welles Wilder's average directional index (ADX) as an indicator of trend strength, or perhaps the r² value from linear regression analysis. Or you could even use the vertical horizontal filter (VHF) to help determine whether the market is trending.
Each of these indicators requires the user to determine how many days' data should be used in the calculations. As you vary the indicator length or number of days used in the calculation, however, the result of the calculation changes also. Thus, there is no unambiguous answer. If the market were about to enter or leave a trading range, you could get a different indication of trend strength every day — a frustrating set of circumstances.
RATING THE TREND
Here is my way of rating a trend, a method I call trendscore.
Add up the score for 10 comparisons; the score varies from + 10 to -10. If today's close is greater than all the previous closes, then the trend's score is +10; if today's close is less than all the previous closes, the score is -10. You can smooth the data by adding fewer than 10 days or more than 10 days. A positive score shows an upward trend bias. Similarly, a negative score shows a downward bias. A shorter time of comparison may be too volatile, producing frequent trend change signals, while a longer comparison time is slow to respond. During long trends, the trendscore remains at the outer limits, +10 or -10, for the duration of the trend. In sideways markets, the score doesn't remain at +10 or -10 for long, oscillating between these limits.
How to Use this Indicator
You could trade the trendscore many ways. You could use the zero crossing as an early signal. You would then buy when the trendscore becomes positive and sell when it becomes negative. Or you could wait one to three days after the trendscore reaches +10 or -10 before buying (+ 10) or selling (-10) . Or you could combine the trendscore with a moving average, trading an upward or downward cross over.
Another variation would be to go long after the trendscore crosses from -10 to above +5 and go short after the trendscore falls from +10 to below 5. The approach you choose depends on your trading style. You could also smooth the trendscore with more or fewer days than I used in my calculations. You could, for example, use fewer than 10 days for short-term and 20 to 30 days for intermediate-term trading. You could also combine trendscore with other indicators of trend strength. For example, if you combined it with the VHF indicator, trendscore would provide an indication of direction, while the VHF could provide additional information about the trend's strength. You could also substitute intraday data in the trendscore method for short-term trading, using hourly data to calculate a trend's score instead of daily data. Trendscore is a simple way to rate trend strength. It indicates both the direction and strength of the trend and can be easily combined with various trend-following strategies.
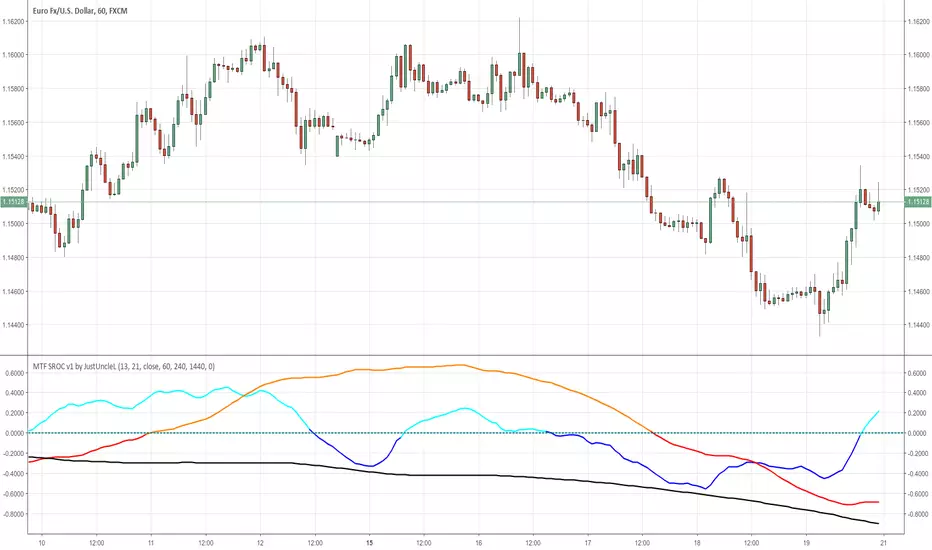
MTF SROC v1 by JustUncleLDescription:
This study plots Smoothed Rate of Change (SROC) indicators for up to 4 different time frames. The indicator does not use higher time frame data, so will not re-paint. The SROC is a momentum indicator and can be used in ranging or trending markets, please refer to the reference for further details of how to use the indicators.
References:
www.incrediblecharts.com
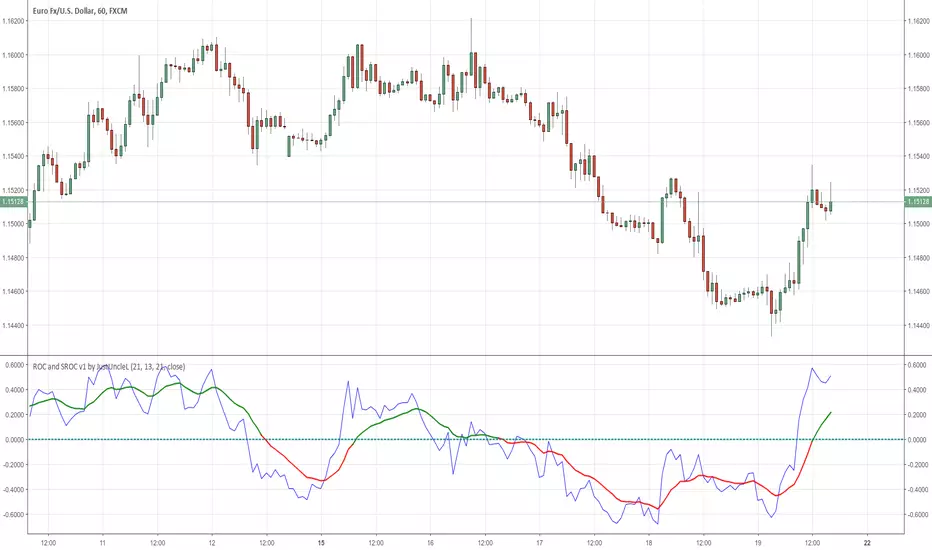
ROC and SROC v1 by JustUncleLDescription:
This study plots a combination Rate of Change Indicator (ROC) and Smoothed Rate of Change (SROC) indicators.
The ROC and SROC are momentum indicators and can be used in ranging or trending markets, please refer to the references for further details of how to use the indicators.
References:
www.incrediblecharts.com
www.incrediblecharts.com
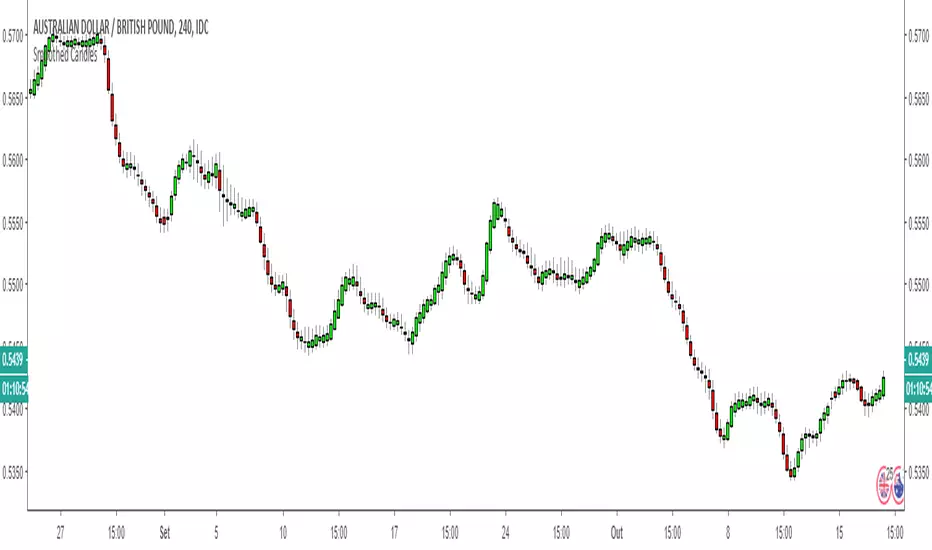
Smoothed CandlesIt is a graphical indicator used to identify trends and pullbacks. Through it, it is possible to eliminate the noises and clearly see the smoothed pattern.
How should I use it ? This is just a example to be used with this indicator.
Let's assume that we are looking for sell opportunities.
step 1: identify some (at least 3) positives (green) candles with a good volume, excluding consolidation regions.
step 2: wait for negative (red) candles with a good volume and also all previous candles must be by majority green.
step 3: wait for pullback with high volume or consolidation region to close the position.
FX:AUDUSD
The example can be better described in the image below:
FX:EURUSD
Another example os use, displayed in the image below:
FX:EURJPY
Look how makes it easy to identify tops and bottoms.
BITFINEX:BTCUSD
Very easy to indetify trends:
OANDA:GBPUSD
Very easy to indetify pullbacks:
FX_IDC:AUDGBP
It can be used with almost of pairs!
If you are interested in purchase, access the link below:
2450ca2f.ngrok.io
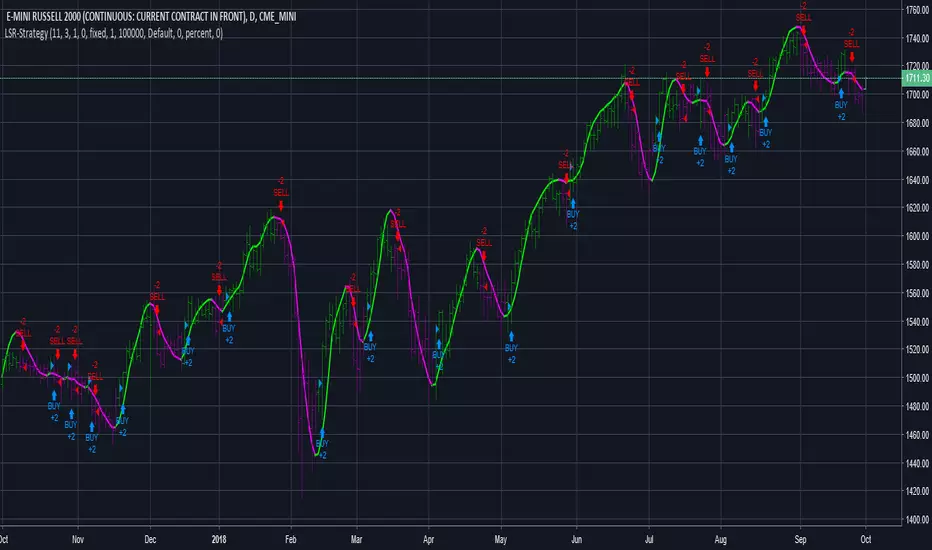
B3 LSR Strategy- "Price Leading MovAvg"B3 Least Squares Regression or "LSR" is very similar to the mid-line at the end of a linear regression channel, except that in a linear regression you cannot see the history of the regression well. There is also the linear regression and least squares curves in some platforms, and this would also be a similar indicator. The smoothness of my indicator and the back-to-basics approach to the mathematics sets it apart from the others. The look of this MA on a chart speaks for itself.
Some people like the flow of this indicator, as it will actually shoot out ahead of price. Most moving averages trail the price action; this one doesn't do that for long before it catches the price or begins to lead price. It isn't necessarily a future price predictor; think of it as a slope stylist. The slope of this indicator determines all painting and signals for the strategy. There are two available versions: with or without order placement.

RSI Divergence Smoothed with Signal Line and Power ZonesThis Indicator plots Regular and Hidden Divergences lines for an RSI smoothed by an EMA and for its Signal Line
The RSI can be set to change colour with direction or can be set as single colour
Colour Changing RSI helps when trading Multiple Timeframes as you can look for confluence in the direction of RSI
The divergence script is thanks to @RicardoSantos, I've just adjusted it to suite my indicator
Remember that divergences work best when traded with the trend or very late in a trend when going against the trend
I have also added a Colour Changing Signal Line & Hima Reddy's Power Zones so now you can also
Take full advantage of trading; signal line crosses, 50 crosses and Power Zone RSI support and resistance

RSI Smoothie by tTJThis is a simple script that smooths out RSI lines. You can choose your own values to apply the default being 2. A median line of 50 has been added to easily spot RSI cross over.
FofT - 1h, 4h, and Daily RSI in any time intervalView multiple-timeframe RSIs in a single interval. All RSI lines stay the same no matter your preference to trade in 15m, 1h, 3h…. etc.
Default RSI length is 7 (can be changed in the format settings)
All RSIs are smoothed out in default (can be changed in the format settings)
Line colors
5m RSI - white (disabled in default)
15m RSI - Lime (disabled in default)
1h RSI - Yellow
4h RSI - Red
D RSI - Blue
Overbought and Oversold threshold colors
>70 (grey) - overbought
>80 (orange) - highly overbought
>90 (pink) - extremely overbought
=50 (black dotted lines) - equilibrium
<30 (grey) - oversold
<20 (orange) - highly oversold
<10 (pink) - extremely oversold
How to add to chart
* Click on "Add to Favorite scripts" in the bottom right
* While in chart view click on "/" button on your keyboard or click on the Indicators button on the top tool bar
* Go to Favorites Tab and click on this indicator
Other interval RSIs will be added based on request. Feel free to leave any questions or requests in the comment section below.
If you find this script useful, please like and share.

Heikin Ashi Smoothed (yasinipek) by KIVANC fr3762Heikin Ashi Smoothed Strategy
A trend trading forex system composed of the Smoothed Heiken Ashi candlestick indicator and moving averages. It works best on the 1 hour charts and higher time frames.
buy when blue line crosses above red
conversely sell when red line crosses above blue
Author: Yasin İpek @yasinipek83 on twitter / www.yasinipek.com & KıvanÇ @fr3762 on twitter (tweets are only in TURKISH)

Ehlers DSMA by Tim D.The Deviation-Scaled Moving Average from July 2018 TASC. "In “The Deviation-Scaled Moving Average” in this issue, author John Ehlers introduces a new adaptive moving average that has the ability to rapidly adapt to volatility in price movement. The author explains that due to its design, it has minimal lag yet is able to provide considerable smoothing."
