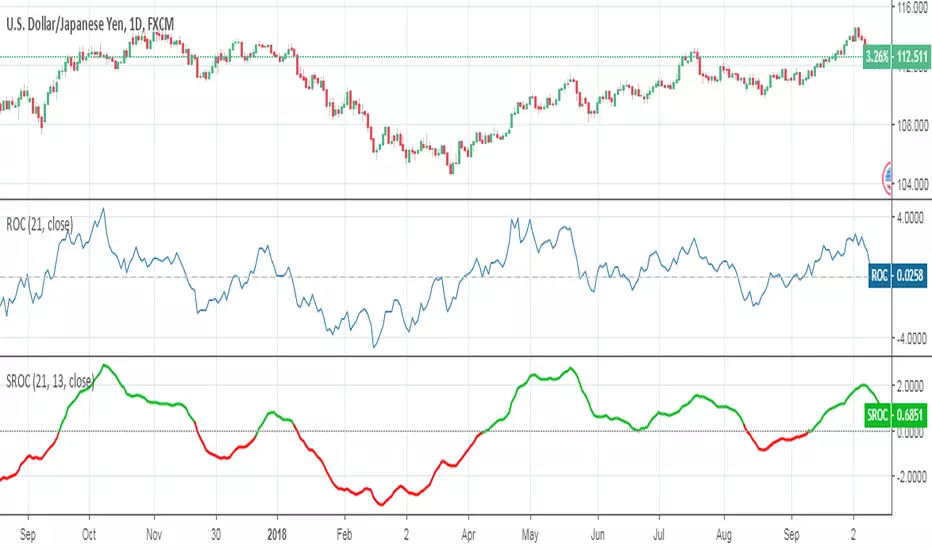
Smoothed Rate of ChangeSmoothed Rate of Change indicator script.
This indicator was originally developed by Fred G. Schutzman.
Smoothed
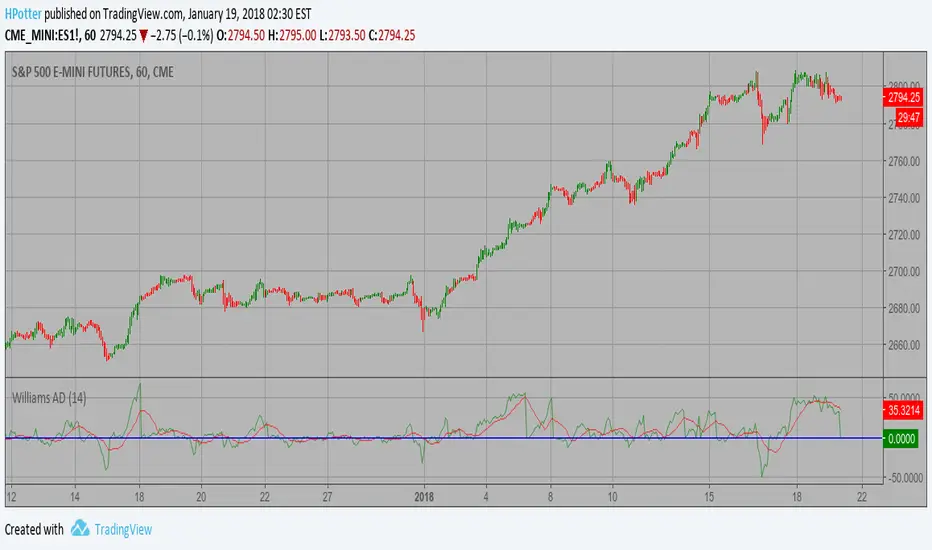
Smoothened Williams A/D Strategy Accumulation is a term used to describe a market controlled by buyers;
whereas distribution is defined by a market controlled by sellers.
Williams recommends trading this indicator based on divergences:
Distribution of the security is indicated when the security is making
a new high and the A/D indicator is failing to make a new high. Sell.
Accumulation of the security is indicated when the security is making
a new low and the A/D indicator is failing to make a new low. Buy.
WARNING:
- This script to change bars colors.
Ehlers-Smoothed Stochastic Oscillator [Krypt]This indicator is in principle similar to Stochastic Oscillator, but contains the following improvements:
- advanced Ehlers-based smoothing (typically results in earlier signals than regular EMA smoothing)
- graceful degradation when few candles present for improved accuracy in the beginning of the chart
- buy/sell signals based on K-D crossover above/below thresholds

Log Smoothed Moving AverageThis indicator has two features that make it better than standard SMMA for cryptocurrencies:
- starts from the very first candle
- calculations are performed in log-space which means less sensitivity to extreme volatility common in crypto world

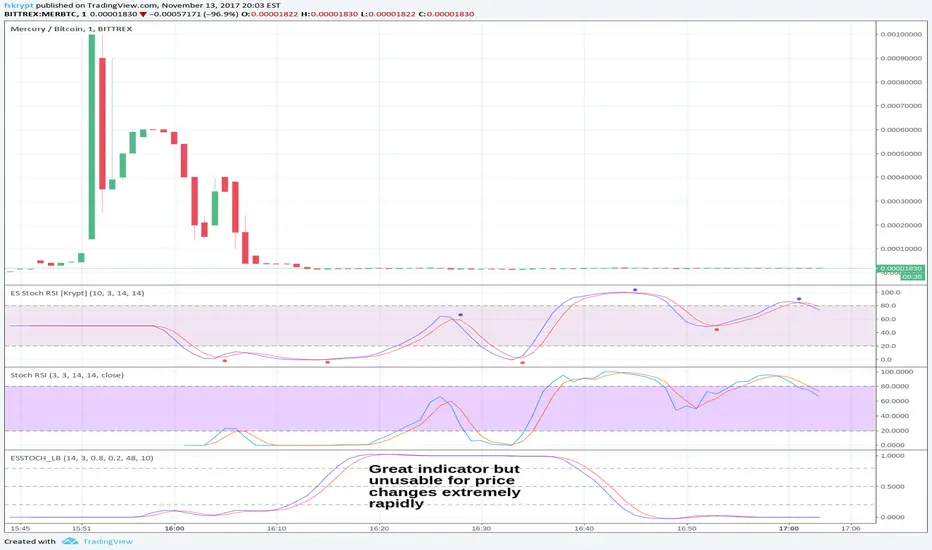
Ehlers-Smoothed Stochastic RSI [Krypt]This script uses a regular Stochastic RSI formula and then runs Ehlers' Super Smoother on top of it. It also provides buy/sell signals on crossovers.
The script is inspired by LazyBear Ehlers-Smoothed Stochastic RSI with Roofing Filter, except I find that the Roofing filter (existing implementation) does not work well near extreme price changes, where a regular formula is preferable. The Ehlers Super Smoother however is excellent and seems to provide earlier signals in most cases than an EMA-EMA smoother. Combined, the super-smoother and regular Stochastic RSI formula provide very good results.
InverseFisherTransformAn inverse fisher transformation of a modified RSI plotted against a smoothed version of itself.
The general trading rules of this indicator are as follows:
1. if the histogram is > 0 and above the line and is green; buy
if the histogram is > 0 and is below the line (green or gray); sell buy position
2. if the histogram is < 0 and below the line and is red; sell
if the histogram is <0 and above the line (red or gray); buy-back sell position

B3 Stochastic FullA colorful take on the classic stochastic indicator, coded from scratch. Enjoy! :)

B3 Directional Trend IndexB3 Directional Trend Index ~ All about the trend! William Blau is the designer of this gem, and IMHO it is the best trend finder of all the lagging indicators out there I have tested. It is important to pay attention to the slope and thickness of the line, and its relationship to zero. A reversion to the zero may look momentous, but in fact it could reverse when it reaches mean, only to turn back around. You can see this in March and April of this silver futures daily chart. Makes for a great instrument on anything you consider trendy, like crude oil for example. The default user inputs are set to my liking, as I find them to be great on all charts and resolutions. You may read around to find more about this on the internet, or its mentioned in Krausz's work. Also, imprtant to remember when no trend, trend finders like this sufffer, so be wise as to what market condition you are in. Rangy and within Range = no, On the Move = yes.

Triangular Moving AverageThe TRIMA is simply the SMA of the SMA -- a double-smoothed simple moving average . The end effect of the double smoothing is that greater weight is placed on values near the middle of the lookback period. It therefore reacts relatively slowly to price changes compared to most moving averages .
But why would I want more lag?
One potential use of this moving average that I've found is that it can allow price to run for a bit after crossing the TRIMA before catching up and creating an opposing signal. It therefore creates the chance for the price to "run its course" so to speak, which can make whipsaw signals less common.

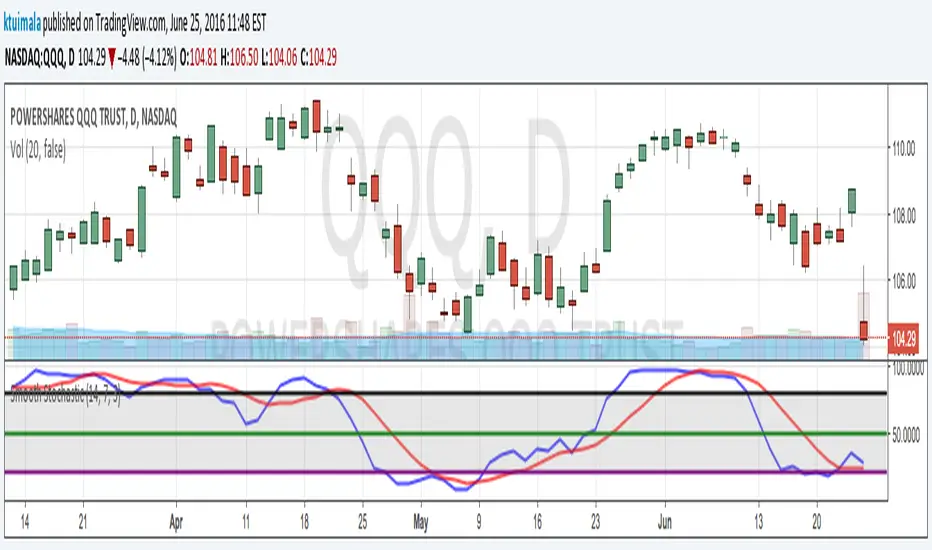
KT_Smooth_StochasticI normally don't publish my indicators. However, I couldn't find a smoothed stochastic on TradingView officially or unofficially. This is a standard implementation of a smoothed Fast Stochastic where %K and %D are calculated and then smoothed by n periods. This helps to reduce chop and gives better extreme signals.
I have defaulted the indicator to use commonly used settings where %K is over 14 periods, %D is over 7 period, and the smoothing factor is 3 periods. I have also defaulted the extreme lines to an upper band of 80, mid band of 50, and lower band of 20. However, my favorite settings are %K = 10, %D = 10, Smooth = 3, upper band = 75, mid band = 50, and lower band = 25.
Ehlers Smoothed Adaptive Momentum [LazyBear]Bored of Ehlers yet? :) I still have plenty of Ehlers in my collection, was thinking of publishing one of his Fishers or Adaptive RVI next, but @ChartArt requested Smoothed Adaptive Momentum (SAM), so here we go...
This is my 200th script (not including the variations and other custom scripts I shared over PM). My complete list of indicators here - bit.ly
Now, about the indicator :)
This smoothed adaptive momentum is straightforward to use (per Ehlers original rules). If it crosses above zero buy the next open, if it crosses below zero sell the next open. Of course, I strongly suggest filtering the signals.
Finally, here's an Ehlers-only chart to help determine where BTC is heading :P
More info:
- Ehlers CG Oscillator:
- Cybernetic Analysis for Stocks and Futures (Ehlers)
List of my public indicators: bit.ly
List of my app-store indicators: blog.tradingview.com
--Updated chart--
Here's the chart with barcolors ON (forgot to turn it on in the published one)

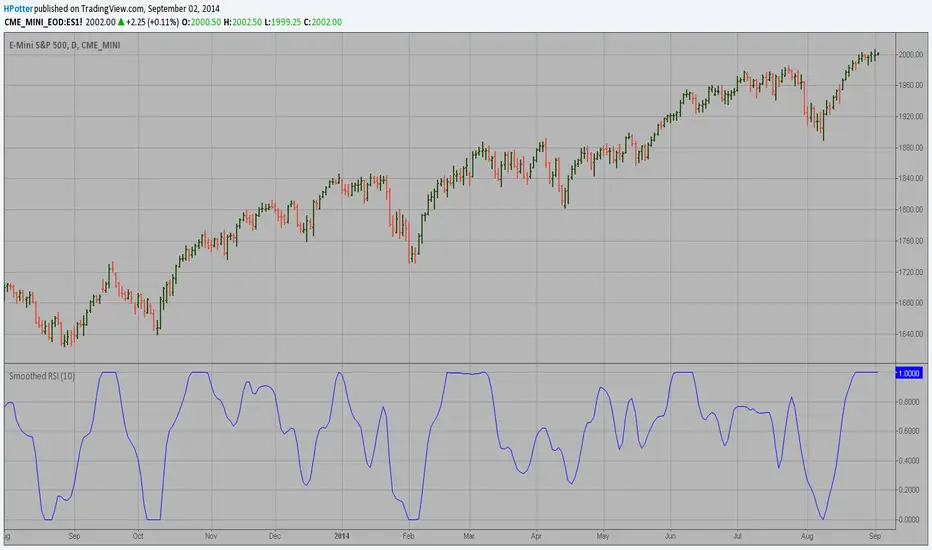
Smoothed RSI This is new version of RSI oscillator indicator, developed by John Ehlers.
The main advantage of his way of enhancing the RSI indicator is smoothing
with minimum of lag penalty.
DSS Bressert (Double Smoothed Stochastic)Hi
Let me introduce my DSS Bressert (Double Smoothed Stochastic) script.
Double Smoothed Stochastics (DSS) is designed by William Blaw.
It attempts to combine moving average methods with oscillator principles.
