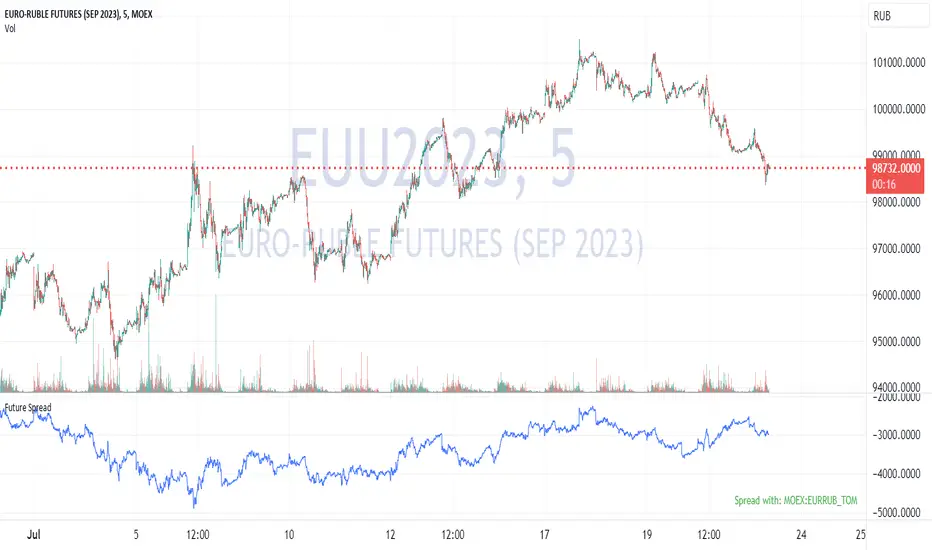
Future's spread with base contract (MOEX)English:
Indicator calculates spread between future and it's theoretical price baased on base contract, number of days to expiration and central bank key rate.
I didn't find any means of getting base contract of security on chart so I hardcoded futures and corresponding base contracts.
Hardcoded futures are MOEX (Moscow Exchange) only and key rate used in script is Russian Central Bank's key rate from 2013, but I believe you can easily adapt it to any other key rate history. I can share source code of tiny C++20 utility for easy generation of get_rate(time) function from more human-readable date format rather then UNIX timestamp used in PineScript.
Only quarterly futures are supported. Only in "SIU2022" like notation. "SI1!" like aliases are not supported.
Русский:
Индикатор отображает спред фьючерса к его теоретической цене с учётом усыхания на каждый день.
Не нашёл, как определить базовый актив фьючерса средствами TradingView - поэтому это соответствие захардкожено вручную.
Поддерживаются только квартальные фьючерсы, только MOEX, только хардкор.
Поддерживается история ключевой ставки ЦБ РФ с 2013 года.
Используйте коды фьючерсов вида "SIU2022".
Не поддерживаются альясы вроде "SI1!", "EU1!".
Spread
Historical US Bond Yield CurvePreface: I'm just the bartender serving today's freshly blended concoction; I'd like to send a massive THANK YOU to all the coders and PineWizards for the locally-sourced ingredients. I am simply a code editor, not a code author. Many thanks to these original authors!
Source 1 (Aug 8, 2019):
Source 2 (Aug 11, 2019):
About the Indicator: The term yield curve refers to the yields of U.S. treasury bills, notes, and bonds in order from shortest to longest maturity date. The yield curve describes the shapes of the term structures of interest rates and their respective terms to maturity in years. The slope of the yield curve tells us how the bond market expects short-term interest rates to move in the future based on bond traders' expectations about economic activity and inflation. The best use of the yield curve is to get a sense of the economy's direction rather than to try to make an exact prediction. This indicator plots the U.S. yield curve as maturity (x-axis/time) vs yield (y-axis/price) in addition to historical yield curves and advanced data tickers . The visual array of historical yield curves helps investors visualize shifts in the yield curve that are useful when identifying & forecasting economic conditions. The bond market can help predict the direction of the economy which can be useful in crafting your investment strategy. An inverted 10y/2y yield curve for durations longer than 5 consecutive trading days signals an almost certain recession on the horizon. An inversion happens when short-term bonds pay better than longer-term bonds. There is Federal Reserve Board data that suggests the 10y3m may be a better predictor of recessions.
Features: Advanced dual data ticker that performs curve & important spread analysis, plus additional hover info. Advanced yield curve data labels with additional hover info. Customizable historical curves and color theme.
‼ IMPORTANT: Hover over labels/tables for advanced information. Chart asset and timeframe may affect the yield curve results; I have found consistently accurate results using BINANCE:BTCUSDT on 1d timeframe. Historical curve lookbacks will have an effect on whether the curve analysis says the curve is bull/bear steepening/flattening, so please use appropriate lookbacks.
⚠ DISCLAIMER: Not financial advice. Not a trading system. DYOR. I am not affiliated with the original authors, TradingView, Binance, or the Federal Reserve Board.
About the Editor: I am a former FINRA Registered Representative, inventor/patent holder, futures trader, and hobby PineScripter.

Volume Spread for VSA CustomHey everyone, I have been using volume a lot more lately as price action can sometimes get manipulated but volume shows us the truth!
Anyways, I have enjoyed the Volume Spread for VSA indicator but wished I had the code to change a few settings. This volume indicator includes spread analysis with the ability to customize input values and I'm making it open source so you can do with it as you please.
I have made notes all throughout the code to give suggestions on a few changes or why I have written it in such a way. I have also tried to section everything off to make it easier to see where each piece of the code is used. Overall I think it is a good example of how to code cleanly and how to add useful notes when you are learning Pine for yourself :D
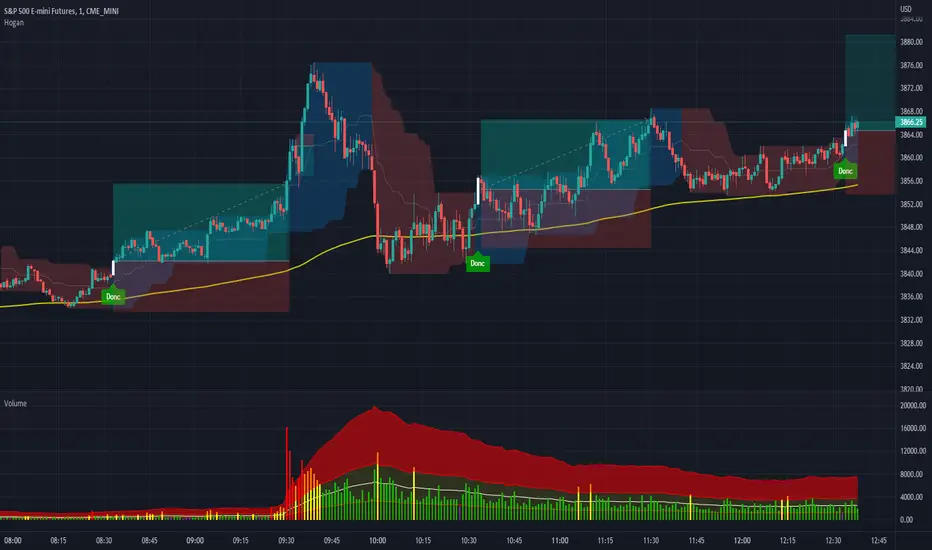
The indicator on the price chart is my Donchian Channel indicator, which you can also find on my profile. This is the one I use every day.
Binance Futures Swap-Spot Basis LabelNote: This script will only work with Binance Futures Symbols
This script calculates the basis between the Binance Future and Binance Spot market for the coin you are currently viewing and paints a label on the chart which displays the percentage difference between future and spot. If the future is trading below the spot market the text will be red indicating backwardation and if the future is trading above spot, it will be green indicating contango. Please note this script will only work on Binance perps against Binance spot. The script will change based on what perp you are looking at, no inputs are required.

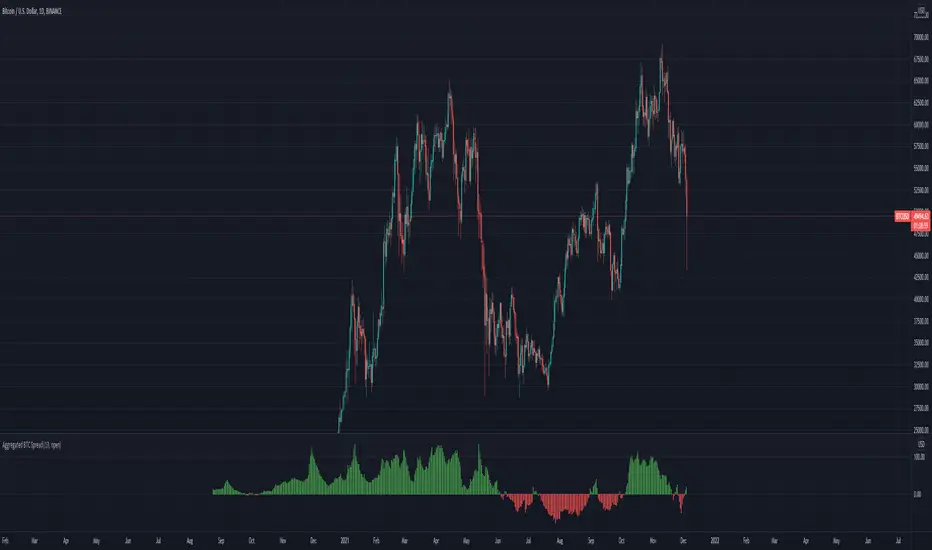
Aggregated BTC SpreadThis script is used to aggregate the bitcoin spread on futures contracts on different platforms.
It works by averaging the for every selected exchange, and apply an EMA of .
It is supporting
Binance (USD / USDT)
Okex
FTX
Huobi
Deribit
Ascendex
CME (BTC1!)
Stochastic Spread AnalyzerA comparative version of the previously published Stochastic Structure Analyzer. It incorporates the 3-TF stochastics against both price and OBV values of the spread.

Spread of ScriptsHello all
This indicator helps you to find spread between scripts.
Very much helpful for finding spread of script with relative future script. (Index or Stocks).
The are two methods to find spread –
1. Divide
2. Difference
You can select your choice from indicator settings.

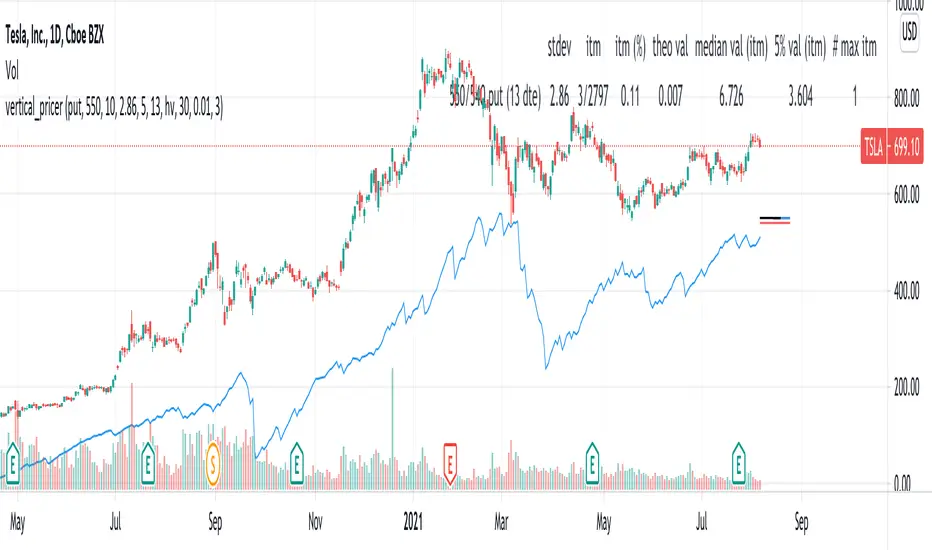
vertical_pricer
USAGE
1. Select the type of contract (call or put), the long strike, and the width.
2. Select the volatility model
3. The standard deviation is shown, enter it into the input.
The tool gives a theoretical price of a vertical spread, based on a
historical sample. The test assumes that a spread of equal width was sold on
every prior trading day at the given standard deviation, based on the
volatility model and duration of the contract. For example, if the 20 dte
110 strike is presently two standard deviations based on the 30 period
historical volatility, then the theoretical value is the average price all
2SD (at 20 dte) calls upon expiration, limited by the width of the spread and
normalized according to the present value of the underlying.
Other statistics include:
- The number of spreads in the sample, and percentage expired itm
- The median value at expiration
- The Nth percentile value of spreads at expiration
- The number of spreads that expired at max loss
Check the script comments and release notes for further updates, since Tradingview doesn't allow me to edit this description.
Cost of SpreadAdd to a quote, set the current total transaction cost (i.e. Spread (%) to 0.04 if BTCUSDT binance future, Spread (base) 0.0001 if trading EURUSD with 1 pip net spread).
Both lines indicate the relative volatility corrected cost of trading (ATR as orange line, StdDev as cyan).

Stochastic(4,3,2) Spread By Rajv1: This indicator plots a spread of %K - %D of the stochastic(4,3,2).

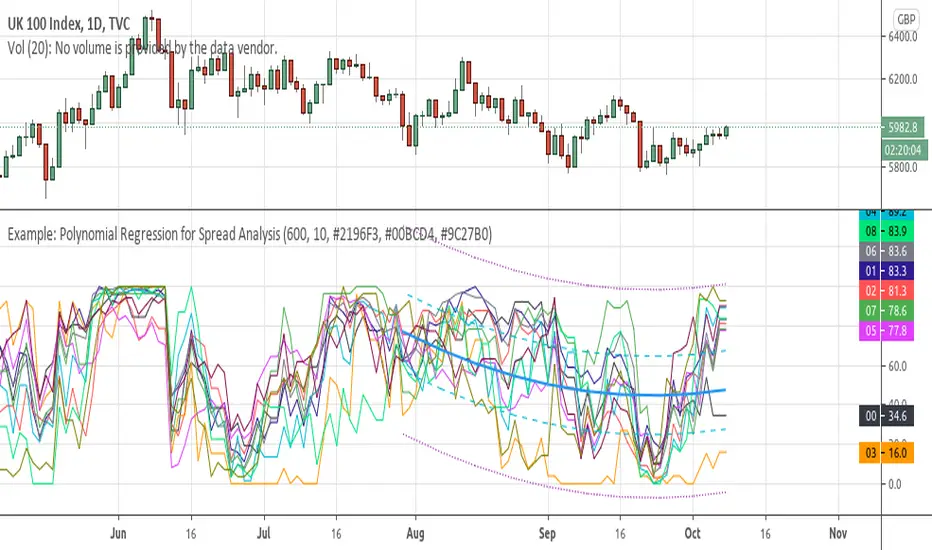
Example: Polynomial Regression for Spread AnalysisExample of applying polynomial regression channel to spreads or hedges between 2 assets.
Libor-EFFRThis is the 3-month Libor minus effective federal funds rate. Traders watch certain spreads for a wider spread to indicate a bad economy.
This is a conceptual indicator that tries to make sense of how important a FRA-OIS spread can be, in this case the Libor-EFFR. It may be completely wrong in calculation and understanding :)
en.wikipedia.org
www.investopedia.com
Libor was derived from the TED Spread less 3-month treasury bills due to Quandl missing updated Libor data.
fred.stlouisfed.org
fred.stlouisfed.org
For the OIS, EFFR is used because it has long historical data and is one of (maybe) the rates used for spread. SOFR was not available at the time but it appears that is what is more common nowadays.
A possible derivative of this indicator would be taking Libor and putting it against something else.

Spread by//Every spread & central tendency measure in 1 script with comfortable visualization, including scrips's status line.
Spread measures:
- Standard deviation (for most cases);
- Average deviation (if there are extreme values);
- GstDev - Geometric Standard Deviation (exclusively for Geometric Mean);
- HstDev - Harmonic Deviation (exclusively for Harmonic Mean).
These modified functions will calculate everything right, they will take source, length, AND basis of your choice, unlike the ones from TW.
Central tendency measures:
- Mean (if everything's cool & equal);
- Median (values clustering towards low/high part of the rolling window);
- Trimean (3/more distinguishable clusters of data);
- Midhinhe (2 distinguishable clusters of data);
- Geometric Mean ( |low.. ... ... .. .... ... . . . . . . . . . . . .high| this kinda data); <- Exp law
- Harmonic Mean { |low. . . . . . . . . . . . . . .. . . .high| kinda data). <- Reciprocal law
Listen:
1) Don't hesitate using Standard Deviation with non-mean, like "Midhinge Standard Devition", despite what ol' stats gurus gonna say, it works when it's appropriate;
2) Don't check log space while using Geometric Mean & Geometric Standard Deviation, these 2 implement log stuff by design, I mean unless u wanna make it double xd
3) You can use this script, modify it how you want, ask me questions whatever, just make money using it;
4) Use Midrange & Midpoints in tandem when data follows ~addition law (like this . . . . . . . . . . . . . . . . . . . . .). <- just addition law
Look at the data, choose spread measure first, then choose central tendency measure, not vice versa.
!!!
Ain't gonna place ® sign on standard deviations like one B guy did in 1980s lmao, but if your wanna use Harmonic Deviations in science/write about/cite it/whatever, pls give me a lil credit at least, I've never seen it anywhere and unfortunately had to develop it by myself. it's useful when your data develops by reciprocals law (opposite to exponential).
Peace TW

Arbitrage B3's IBOV FuturesThis indicator was made to calculate and show the spread between the B3's Ibovespa Futures and B3's Ibovespa Index increased by the Interest until the contract expiration date.
The orange line "Arbitrage" is the spread.
Inputs:
Annual Interest Rate (%) -> Interest Rate that you want to be used to calculate the Interest of B3's IBOV Index.
Working Days Until Contract Expires -> How many business days you have between your actual date and the expiration date of the Futures.
Recommended TimeFrame to evaluate the "Arbitrage": 1 MIN
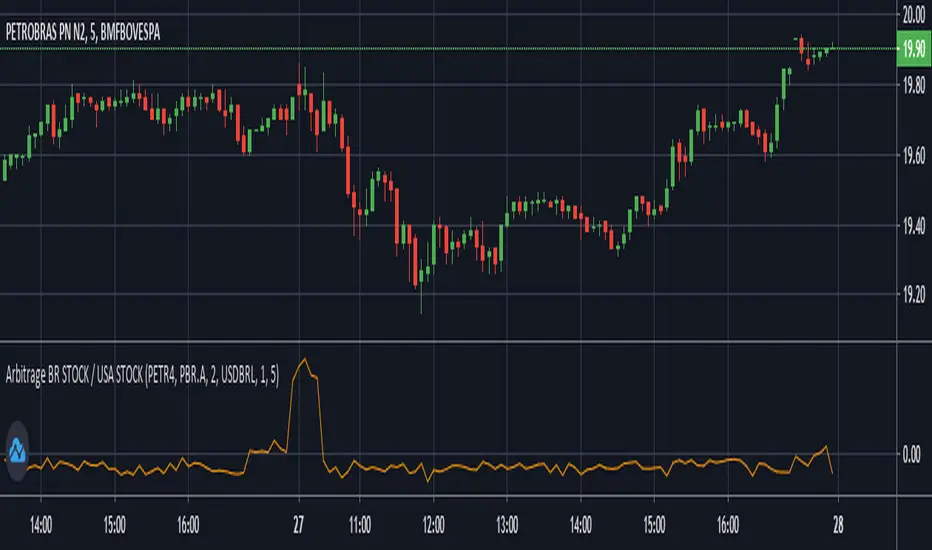
Arbitrage BR STOCK / USA STOCKThis Indicator was made to show the BRL difference between an Stock in Brazil's B3 and it's respective ADR traded in the USA.
By default, it will show the spread between PETR4 and it's ADR PBR.A using the USD-BRL pair from Forex.
You can personalize this indicator to any Stock of your preference, and also change to any USD-BRL pair negotiated that you want. You'll have the following options to do so:
B3's Stock Ticker -> Ticker negotiated at B3.
USA's Stock Ticker -> The respective ADR of the first option.
ADR's Multiplicative Factor -> How many B3's Stocks are equivallent to the USA Stock (found at the name of the ADR on Trade View).
BRL/USD Market of Preference -> Which market you want to use to transform the price of the ADR from USD to BRL.
Dollar Divisor -> The BRL must be equivallent to 1 Dollar for the script to work. So, if you want to use a USD/BRL market that does not represent this relation, you must divide it by some number to do so. For example, if you want to use B3's DOLFUT, than you must set this parameter to 1000 (because the points show at B3's DOLFUT are the amount of BRL equivallent to 1000 Dollars). Also, if you are using a market that trades Dollar equivalent to 1 BRL (Globex's 6LFUT, for example), then set this parameter to 0.
Timeframe -> Recommended to be the same of the chart to better visualisation.
Arbitrage DOL BR / DOL USAThis indicator is made to calculate and show the spread between the currency pair USD-BRL being negotiatied in Brasil's B3 and in USA's CME Globex.
The orange line "Arbitrage" is the spread.
The red/green line is the "Stop Loss" recommended for the strategy. If the line is green, it means that the reward/tisk ratio is above 1.
IMPORTANT: MAKE SURE TO BE USING THE SAME TIMEFRAME ON BOTH THE INDICATOR AND THE CHART.

Bitcoin SpreadThis indicator display the current lowest and the highest value of btc on a set of exchanges for a define type of market.
Bitcoin Spread was originally made by @DayTradingItalia, i have bring his indicator to pine v4, add add some stuff to it:
5 Type of BTC Market : USDT Swap, USD and Futures (current/next contract)
Spread value

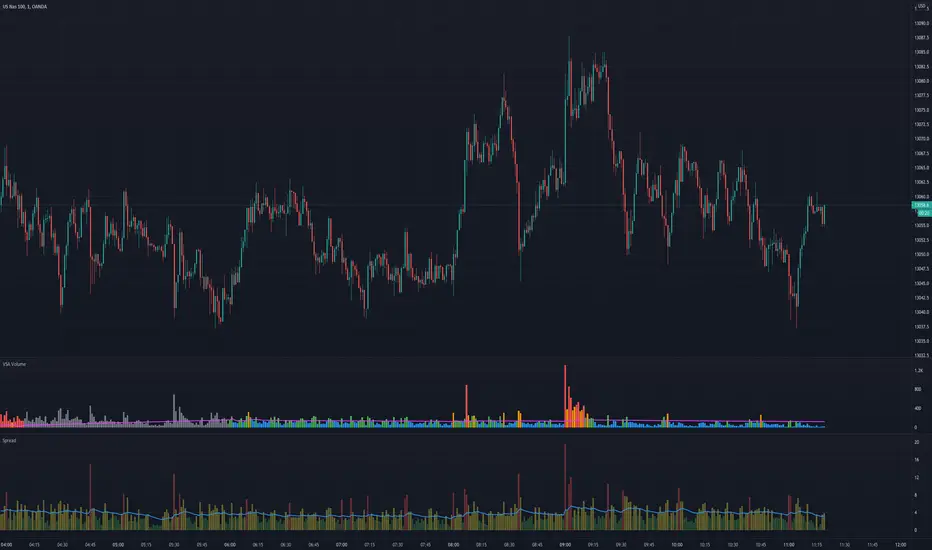
VSA VolumeVolume indicator judging level of volume per bar accordingly to Volume Spread Analysis rules. It allows either to set static volume levels or dynamic ones based on ratio comparable to Moving Average. Bars are coloured based on ratio or static levels, visually presenting level of Volume (low, average, high, ultra high).

VSA SpreadMeasures spread of the candle, useful especially for Volume Spread Analysis (VSA) and to measure trend strength. Spread is coloured based on level comparable to Moving Average.
Spread PercentThis indicator shows the percent change between the highs and the lows (or optionally the open and close) of each candle. You may also set a low and a high percent threshold to better highlight the candles that exceed your desired spread percent. Red signifies low spread, green is high spread - these are unrelated to the color of the candle body. There is also the option to display a moving average of the spread percent at your desired length which is a representation of volatility over time.
This is not only helpful for historical analysis over time, but this can also be a time saver if you are trying to calculate the measured distance of a move. Save clicks - no more needing to use the measuring tool.
The settings of the indicator on the chart above are:
- Measure Candle Body Only? - No
- Highlight Thresholds? - Yes
- Thresholds Based on Moving Averages? - Yes
- Low Percent Threshold - 3.0
- High Percent Threshold - 7.0
- Show Moving Average? - Yes
- Moving Average Length - 5

SpreadTrade - Distance (ps4 ver. 2)This script implements a rebrushed distance-based pair trading strategy. In this strategy, normally they trade the difference between the prices of two instruments. This difference is also called spread. Here, however we’ll trade the difference between two time frames of one instrument. And that's the main trick. Common procedure consists of the following steps:
1. Select two CORRELATED stocks. Here we'll use the same instrument in different TFs.
2. Generate the spread by calculating the difference between the prices/instruments. For distance based pair trading, we need to (rescale the data first and then) check the distance between them.
3. Define the logic to trade the spread and generate the trading signals. In this example we’ll calculate the rolling mean and rolling standard deviation of the spread. Whenever the spread goes above a rolling mean by one standard deviation, we’ll short the spread expecting the mean reversion behavior to hold true. And whenever the spread goes below its rolling mean by one standard deviation, we’ll go long on the spread.
Mind that the meaning of the orange and blue signals depends on whether tf variable is smaller or larger than the built-in timeframe.multiplier variable, i.e. tf of the chart.
For details see analyticsprofile.com
Donate: PayPal (paypal.me)

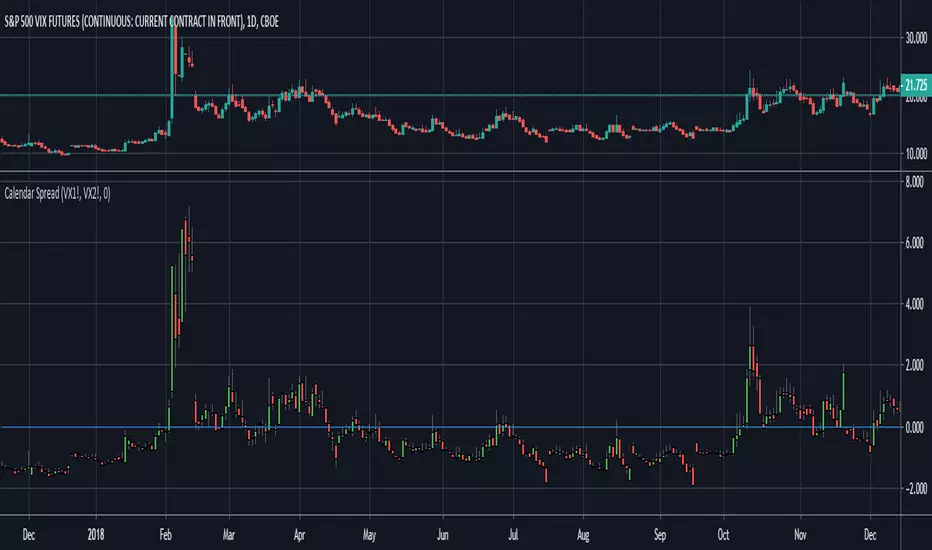
Calendar Spread - OldinvestorSimply choose what two securities (symbols) you want to compare. The study will subtract Open, High, Low, and Close of second input from the first. You may also move the plot line wherever you choose. It may be necessary to move the plot line in order for some charts to look right.