Stochastic & SPY StochasticUsing this indicator you will be able to use the standard stochastic of a stock ticker as well as the stochastic of the S&P 500 (SPY) index simultaneously and without changing charts - both stochastics combined in only one indicator.
The S&P 500 (SPY) stochastic is displayed with higher transparency. The degree of transparency and default color settings can be adjusted in the indicator settings.
For special analysis purposes, it is possible to display only the stochastic of the selected stock ticker or only the stochastic of the S&P 500 (SPY) index.
SPDR S&P 500 ETF (SPY)

Asset Correlation Tool v3, improvedI found this useful tool among the indicators but it wasn't doing the correlation study correctly.
Everything in markets, with only a few exceptions, are rising in value over time and therefore trended to time. The simplest method I found is to use link relative or first difference detrending, before calculating a correlation between assets.
I also updated it to include more assets, to use the latest Cryptocap indices like BTC.D/ETH.D/TOTAL2 and the top 100 crypto index CIX100. I improved the colour schemes, too
Included in the source code are some other ideas like the FRED:M1 and FRED:M2 (only on daily charts), the Yuan/Yen/EUR/USD, etc. There's lots of scope for correlating unrelated markets.
I'll keep updating it as I use it to find truly correlated assets. Some kind of signal line of known correlations, to subtract from the baseline fuzz of market activity.
Any improvements are most welcome; I'm a novice at best at statistics and build on others' work.
- mabonyi

Yaonology SPY StrategyOnly use this strategy in the US stock market. Especially use in SPY.
www.yaonology.com

A.I.Driven TradersAI Model Trades for 20190612The entry and exit levels here are NOT derived from any specific indicator but are coming from our A.I. driven proprietary models.
This is an attempt at exploring the trading community here at TradingView and sharing our daily trading plans published at our site with the community here in the form a Pine Script - just starting and learning this platform. Please help point out any obvious errors or gotchas committed in the scripts. Thanks and have a great trading day!
**** The Trading Plan Published for today ****
>>>> Medium-Frequency Models: <<<<< For today, Wednesday 06/12, our medium-frequency models indicate using the 2895 as a pivot point - opening a long on a break above 2895, and opening a short on a break below 2895 (wait for a close on at least a five minute chart to determine the break), both sides with a 9-point trailing stop.
Note: For the trades to trigger, the breaks should occur during the regular session hours starting at 9:30am ET. By design, these models do NOT open any new positions after 3:45pm. Only one open position at any given time.
>>>>> Aggressive Intraday Models: <<<<< For today, Wednesday 06/12, our aggressive intraday models indicate going long on a break above 2892 or 2875 with an 6-point trailing stop, and going short on a break below 2887 or 2878 with an 8-point trailing stop.
Note: For the trades to trigger, the breaks should occur during regular session hours starting at 9:30am ET. Due to the intraday nature of these aggressive models, they indicate closing any open trades at 3:55pm and remaining flat into the session close. No opening of new positions after 3:45pm. Only one open position at any given time.

Sentimental VolumeThe help's to understand volume trend with respect to price. It also show's the average volume. Volume unit are in Million's

SPY BackgroundColors background green if AMEX:SPY 1 day performance is positive
Colors background red if AMEX:SPY 1 day performance is negative

SPY BackgroundColors background green if AMEX:SPY 1 day performance is positive
Colors background red if AMEX:SPY 1 day performance is negative
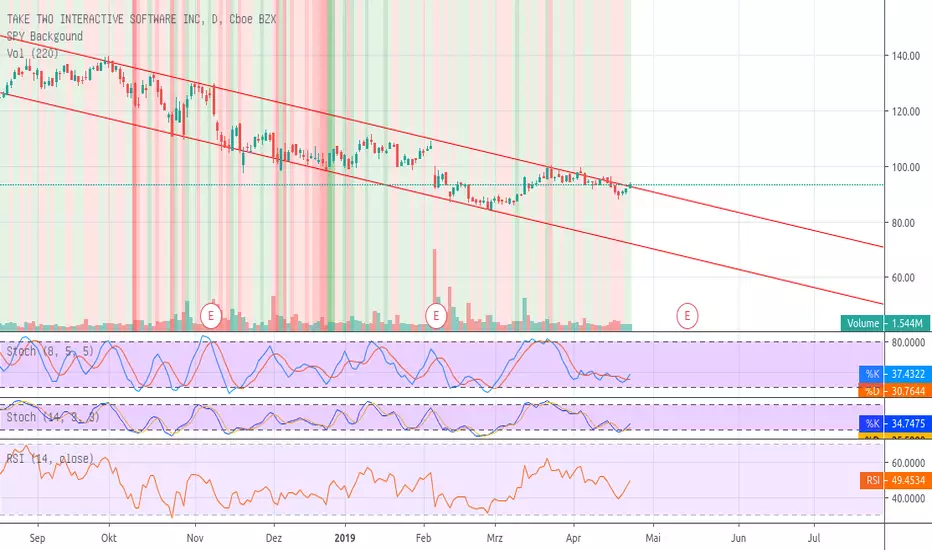
SPY BackgoundColors background green if AMEX:SPY 1 day performance is positive
Colors background red if AMEX:SPY 1 day performance is negative

ATS Master's IndicatorThis master indicator is a collection of multiple useful indicators, which only requires one indicator slot in TradingView.
In this collection you will find the following 15 indicators:
Bollinger Bands (three different types: Fibonacci, Standard, Improved)
Gaps Checker
Large Candles Checker
SPY Checker Lite
Volume Checker Pro
Moving Averages (up to two individual MA indicators)
Exponential Moving Averages (up to two individual EMA indicators)
Double Exponential Moving Averages (up to two individual DEMA indicators)
Tripple Exponential Moving Averages (up to two individual TEMA indicators)
So, using this master indicator you are able to use up to 15 indicators in one.
If you would like to use this master indicator drop me a line and send a request for it.

PpSignal AK_TREND ID// in a up or down trend.
// For SPX or SPY ONLY, Time Frame = Monthly, weekly or daily
// Created by Algokid 7/23/2014
// Toronto, Canada

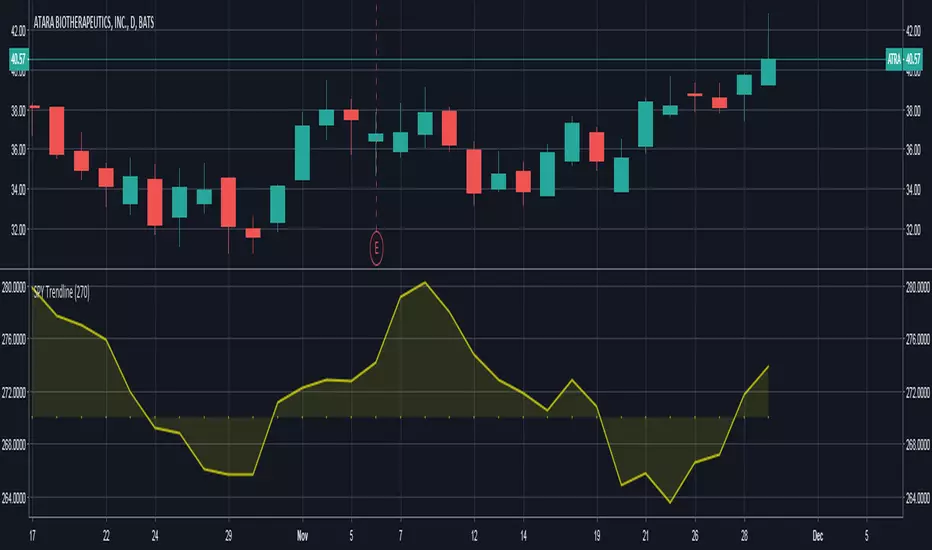
SPY TrendlineThis indicator helps to see the SPY trendline in all stock charts without opening the SPY chart explicitly.
Hope this helps many of you to be more efficient in your chart analysis - have fun!
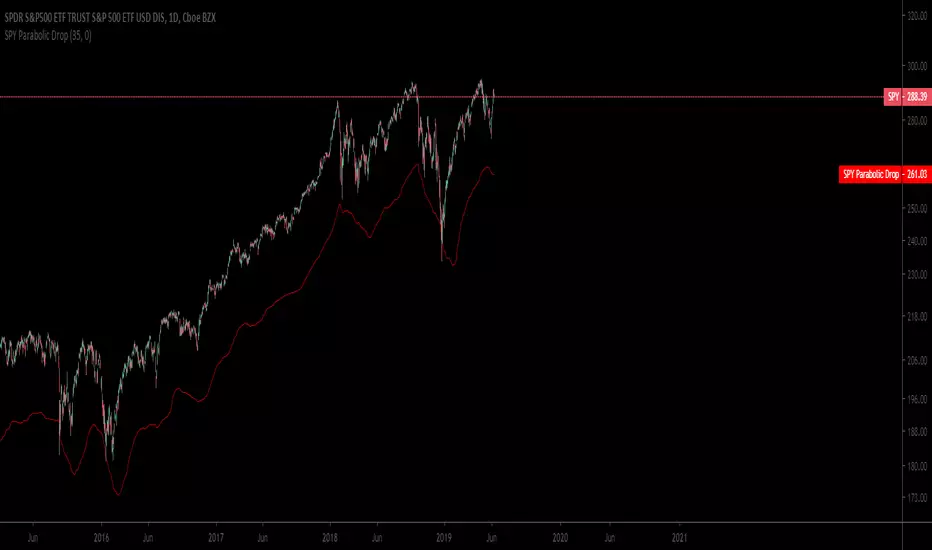
@WACC Volatility Weighted PUT/CALL Positions [SPX]This indicator is based on Volatility and Market Sentiment. When volatility is high, and market sentiment is positive, the indicator is in a low or 'buy state'. When volatility is low and market sentiment is poor, the indicator is high.
The indicator uses the VIX as it's volatility input.
The indicator uses the spread between the Call Volume on SPX/SPY and the Put Volume.
This is pulled from CVSPX and PVSPX.
When volatility and put/call reaches a critical level, such as the levels present in a crisis or a sell off, the line will be green. See Sept 2015, 2008, and Feb 2018.
This level can be edited in the source code.
As the indicator is based on Put/Call, the indicator works best on larger time frames as the put/call ratio becomes a more discernible measure of sentiment over time.

XBT Volatility Weighted Bottom Finder. [For Daily Charts]An update to:
Made it into and indicator.
v. 0.0.1
DESIGNED FOR DAILY CHARTS

Extreme Trend Amplifier (ETA)Introduction
This indicator was created in V3 Pinescript and all projections will be displayed in real-time for active trading use.
This indicator has been designed so that it can be used across a range of securities such as equities, bonds, FX and cryptocurrencies.
All time-stamps are supported.
Comment and Like to try it out!
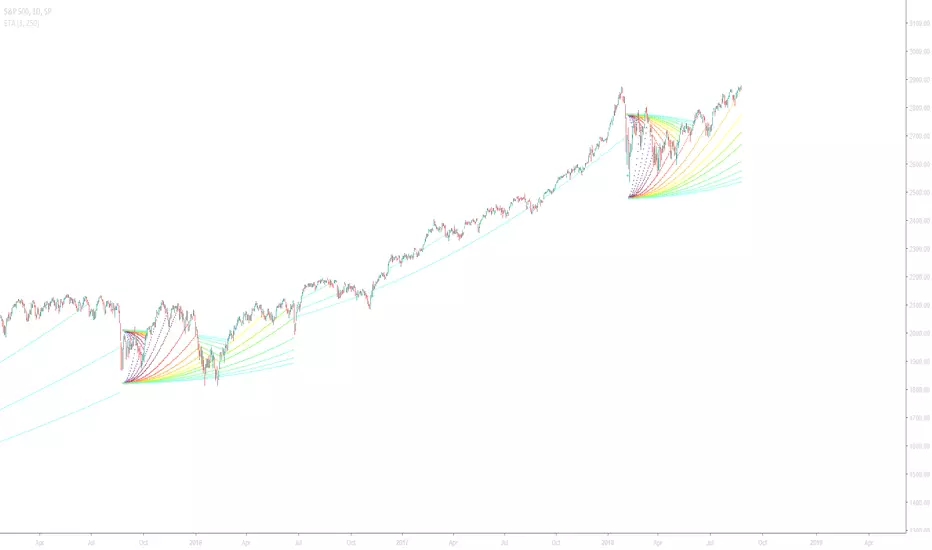
Understanding the Extreme Trend Amplifier
Extreme price changes are often result in a change of trend. This indicator not only allows you to identify the breakout, but to follow the direction of the change. Below is an example of the indicator using normal input values and the Dark TradingView Theme.
The Extreme Trend Amplifier is an indicator that measures the rate of change within a bar of the time stamp and plots a function when the user-defined threshold has been breached. The plot projects parabolic lines that squeeze towards the market price at an ever-increasing rate. The acceleration can also be defined in the indicator settings panel.
Indicator Utility
The first example below is the forex pair, AUD/USD using a rate threshold of 1% and an acceleration factor of three and the second using a rate threshold of 0.8% and an acceleration factor of nine.
We can observe that an increased rate threshold results in fewer instances and that a higher acceleration factor results in the instance projecting farther.
Notice that the acceleration factor is inversely related.
Input Values
Select the “ Format ”, button located next to the indicator label to adjust the input values and the style.
Rate of change (ROC) is the percentage rise/fall of the security within the time stamp. If ROC is set to 1, this is directly proportionate to 1%.
Securities such as cryptocurrencies are very volatile and will require an increased threshold.
Forex pairs will require a reduced threshold in order to produce an output as volatility is far less.
The line color, thickness and style can also be personalised to customise the strategy even further.
In this example, I have adjusted the projected instance that appears below the bars blue and above the bars red, indicating an uptrend or downtrend.
It is also possible to change specific bars in order to identify the extent to which a trend has continued as seen below.
If you would to find out more about this indicator, visit www.kenzing.com
(JS) S&P 500 Volatility Oscillator For OptionsThe idea for this started here: www.tradingview.com with the user @dime
This should only be used on SPX or SPY (though you could use it on other things for correlation I suppose) given that the instrument used to create this calculation is derived from the S&P 500 (thank you VIX). There's a lot of moving parts here though, so allow me to explain...
First: The main signal is when Implied Volatility (from VIX) drops beneath Historical Volatility - which is what you want to see so you aren't purchasing a ton of premium on long options. Green and above 0 means that IV% has dropped lower than Historical Volatility. (this signal, for example, would suggest using a Long Call or Put depending on your sentiment)
Second: The green line running underneath zero is the bottom portion of the "Average True Range" derived from the values used to create the oscillator. the closer the bottom histogram is to the green line, the more "normal" IV% is. Obviously, if this gets far away from the line then it could be setting up nicely to short options and sell the IV premium to someone else. (this signal, for example, would suggest using something like a Bull Put Spread)
Third: The red background along with the white line that drops down below zero signals when (and how far) the IV% from 3 months out (from VIX3M) is less than the current IV%. This would signal the current environment has IV way too high, a signal to short options once again (and don't take any long option positions!).
Tried to make this simple, yet effective. If you trade options on SPX, SPY, even ES1! futures - this is a tool tailored specifically for you! As I said before, if you want you can use it for correlation on other securities. Any other ideas or suggestions surrounding this, please let me know! Enjoy!

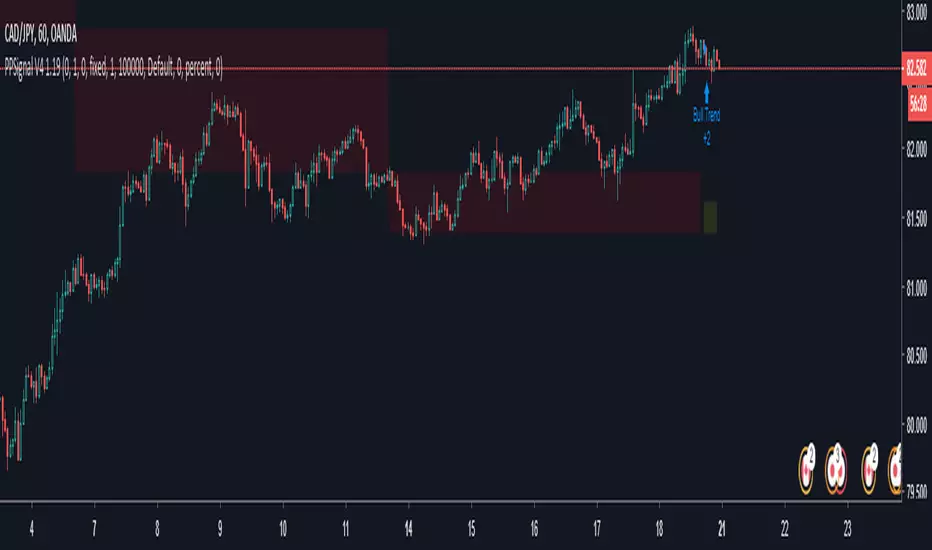
PPSignal System Algorithm Introduction
System Algorithm based on historical price probabilities and volumes. We recommend use financial stock, bond, crypts, indices, futures and Forex market (GBPUSD, EURUSD, USDJPY, USDCAD, AUDUSD, USOIL, XAUUSD, SOYUSD, DXY, SPY, SP1!, bitcoin) with defined trends above 50 or 100 and 200 simple moving averages idem if you want trade downtrend financial assets.
Use projections and retracements Fibonacci, MACD and RSI or Stoch oscillator and figures charters Head and shoulder, triangles and double bottom, double top, etc.
This system will notify you of the probability of success. The profit will be defined for yourself and according to your investor profile.
There are stocks and other assets with high returns but the system does not know exactly. Check in the Strategy tester section and then net profit.
We have other tools that support to PPsignal system, we will publish them shortly.
Define system parameters
As it is a system that is based on past data we recommend using the most historical data weekly (W) but you an use day historical data or 3 o 2 hs.
Candle color: you can choose if you want a trend color for candles or not, in the chart propieties menu detach the border option.
PPsignal it's a very simple system with which you will have a great support when it is a good time for enter in the marker and out.
we await your comments.
Eng. Oscar Alejandro Peruchena
Quants Mathematical and Market Analyst
VIX INDICATORWorks best as an intraday indicator
Background black & line green = Long VIX
Background black & red line = No trade
Background orange & line green = Consider selling
Background orange & line red = Short VIX

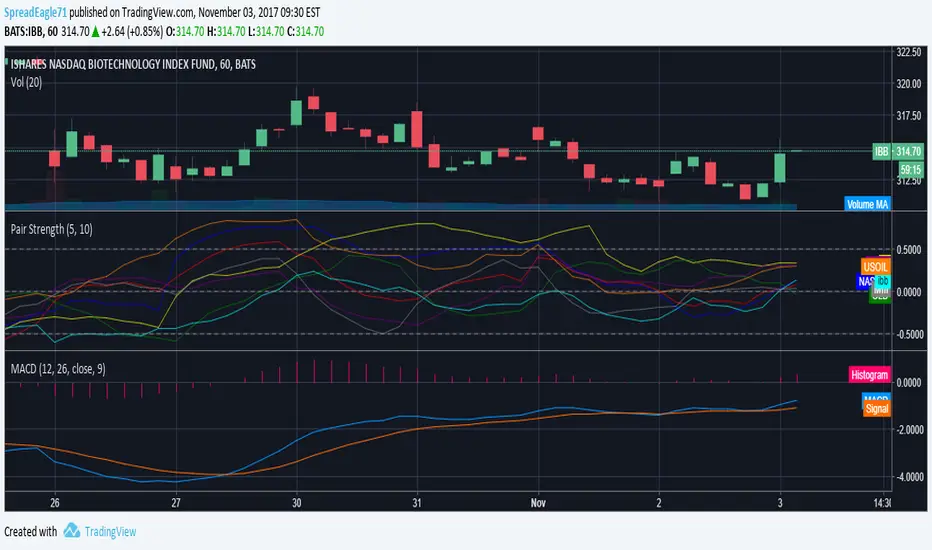
Pair Strength: Updated Version of the one by GlazI updated this version used for Forex with Stock&Index related instruments. Enjoy.
Cowabunga System from babypips.comPlease do read the information below as well, especially if you are new to Forex.
The Cowabunga System is a type of Mechanical Trading System that filters trades based on the trend of the 4 hour chart with EMAs and some other familiar indicators (RSI, Stochastics and MACD) while entering trades base on 15 minute chart.
I have coded (quite amateurishly) the basic system onto a 15 minute chart (the 4 hour settings are coded as well). The author says the system is to be traded off the 15 minute chart with the 4 hour chart only as a reference for trend direction.
4 Hour Chart Settings
5 EMA
10 EMA
Stochastics (10,3,3)
RSI (9)
Then we move onto the 15 minute chart, where he gives us the trade entry rules.
15 Minute Chart Settings
5 EMA
10 EMA
Stochastics (10,3,3)
RSI (9)
MACD (12,26,9)
Entry Rules - long entry rules used, obviously reverse these for shorting.
1. EMA must cross above the 10 EMA.
2. RSI must be greater than 50 and not overbought.
3. Stochastic must be headed up and not be in overbought territory.
4. MACD histogram must go from negative to positive OR be negative and start to increase in value.
What I did.
1. Set the RSI and Stochastic levels to avoid entries when they indicate overbought conditions for long and oversold conditions for short (80 and 20 levels).
2. Users can input specific times they want to backtest.
3. User's can configure profit targets, trailing stops and stops. Default is set it to was 100 pips profit target with a 40 pip trailing stop. (Note, when you are changing these values, please note that each pip is worth 10, so 100 pips is entered as 1000.)
The Cowabunga System from babypips.com is another popular and active system. The author, Pip Surfer, continues to post wins and losses with this system. It shows there is a lot of honesty and integrity with this system if the author keeps up to date even 10 years later and is not afraid of sharing the times the system causes losses.
As an example of this, here is post he shared just last week . It's almost like a journal, he gives specific times and reasons why he entered, lets the readers know when he was stopped out, etc. I think that what he does is equally important as his system.
To read more about this system, visit the thread on babypips.com, click here.

SMART4TRADER-UP-DOWN Stock Exchange Volume (SPY)Shows the trend direction for the S&P500
Показывает направление тренда для S&P500

Free Strategy #08 (Combo of #01 and #02) (ES / SPY)This strategy was designed to be traded on daily data on the ES and SPY—the strategy was originally developed for NinjaTrader, which displays daily ES data based on RTH hours instead of 24 hours (1440 minute) like TradingView does, so we are presenting the results on the SPY until we figure out how to overcome this hurdle.
The strategy combines the two ideas from strategy #01 and strategy #02 .
Strategy #08
Quantity 100
Slippage: 2 ticks
Commission: 4.95 per order
Net Profit: 26,044.60
Max Drawdown: 3,947.60
Buy and Hold (Custom)
Quantity 100
Slippage: 2 ticks
Commission: 4.95 per order
Entry Long: 1993-02-01 @ 43.99
Exit Long: 2017-07-28 @ 246.34
Net Profit: 20,225.10
Max Drawdown: 9,042.00

Free Strategy #02 (ES / SPY)This strategy was designed to be traded on daily data on the ES and SPY—the strategy was originally developed for NinjaTrader, which displays daily ES data based on RTH hours instead of 24 hours (1440 minute) like TradingView does, so we are presenting the results on the SPY until we figure out how to overcome this hurdle.
Strategy #02
Quantity 100
Slippage: 2 ticks
Commission: 4.95 per order
Net Profit: 10,118.30
Max Drawdown: 4.037.60
Buy and Hold (Custom)
Quantity 100
Slippage: 2 ticks
Commission: 4.95 per order
Entry Long: 1993-02-01 @ 43.99
Exit Long: 2017-07-28 @ 246.34
Net Profit: 20,225.10
Max Drawdown: 9,042.00
