Gap Down Reversal Strategy█ STRATEGY OVERVIEW
The "Gap Down Reversal Strategy" capitalizes on price recovery patterns following bearish gap-down openings. This mean-reversion approach enters long positions on confirmed intraday recoveries and exits when prices breach previous session highs. This strategy is NOT optimized.
█ What is a Gap Down Reversal?
A gap down reversal occurs when:
An instrument opens significantly below its prior session's low (price gap)
Selling pressure exhausts itself during the session
Buyers regain control, pushing price back above the opening level
Creates a candlestick with:
• Open < Prior Session Low (true gap)
• Close > Open (bullish reversal candle)
█ SIGNAL GENERATION
1. LONG ENTRY CONDITION
Previous candle closes BELOW its opening price (bearish candle)
Current session opens BELOW prior candle's low (gap down)
Current candle closes ABOVE its opening price (bullish reversal)
Executes market order at session close
2. EXIT CONDITION
A Sell Signal is generated when the current closing price exceeds the highest high of the previous seven bars (`close > _highest `). This indicates that the price has shown strength, potentially confirming the reversal and prompting the strategy to exit the position.
█ PERFORMANCE OVERVIEW
Ideal Market: High volatility instruments with frequent gaps
Key Risk: False reversals in sustained downtrends
Optimization Tip: Test varying gap thresholds (1-3% ranges)
SPDR S&P 500 ETF (SPY)

SPY/TLT Strategy█ STRATEGY OVERVIEW
The "SPY/TLT Strategy" is a trend-following crossover strategy designed to trade the relationship between TLT and its Simple Moving Average (SMA). The default configuration uses TLT (iShares 20+ Year Treasury Bond ETF) with a 20-period SMA, entering long positions on bullish crossovers and exiting on bearish crossunders. **This strategy is NOT optimized and performs best in trending markets.**
█ KEY FEATURES
SMA Crossover System: Uses price/SMA relationship for signal generation (Default: 20-period)
Dynamic Time Window: Configurable backtesting period (Default: 2014-2099)
Equity-Based Position Sizing: Default 100% equity allocation per trade
Real-Time Visual Feedback: Price/SMA plot with trend-state background coloring
Event-Driven Execution: Processes orders at bar close for accurate backtesting
█ SIGNAL GENERATION
1. LONG ENTRY CONDITION
TLT closing price crosses ABOVE SMA
Occurs within specified time window
Generates market order at next bar open
2. EXIT CONDITION
TLT closing price crosses BELOW SMA
Closes all open positions immediately
█ ADDITIONAL SETTINGS
SMA Period: Simple Moving Average length (Default: 20)
Start Time and End Time: The time window for trade execution (Default: 1 Jan 2014 - 1 Jan 2099)
Security Symbol: Ticker for analysis (Default: TLT)
█ PERFORMANCE OVERVIEW
Ideal Market Conditions: Strong trending environments
Potential Drawbacks: Whipsaws in range-bound markets
Backtesting results should be analyzed to optimize the MA Period and EMA Filter settings for specific instruments

3 Down, 3 Up Strategy█ STRATEGY DESCRIPTION
The "3 Down, 3 Up Strategy" is a mean-reversion strategy designed to capitalize on short-term price reversals. It enters a long position after consecutive bearish closes and exits after consecutive bullish closes. This strategy is NOT optimized and can be used on any timeframes.
█ WHAT ARE CONSECUTIVE DOWN/UP CLOSES?
- Consecutive Down Closes: A sequence of trading bars where each close is lower than the previous close.
- Consecutive Up Closes: A sequence of trading bars where each close is higher than the previous close.
█ SIGNAL GENERATION
1. LONG ENTRY
A Buy Signal is triggered when:
The price closes lower than the previous close for Consecutive Down Closes for Entry (default: 3) consecutive bars.
The signal occurs within the specified time window (between Start Time and End Time).
If enabled, the close price must also be above the 200-period EMA (Exponential Moving Average).
2. EXIT CONDITION
A Sell Signal is generated when the price closes higher than the previous close for Consecutive Up Closes for Exit (default: 3) consecutive bars.
█ ADDITIONAL SETTINGS
Consecutive Down Closes for Entry: Number of consecutive lower closes required to trigger a buy. Default = 3.
Consecutive Up Closes for Exit: Number of consecutive higher closes required to exit. Default = 3.
EMA Filter: Optional 200-period EMA filter to confirm long entries in bullish trends. Default = disabled.
Start Time and End Time: Restrict trading to specific dates (default: 2014-2099).
█ PERFORMANCE OVERVIEW
Designed for volatile markets with frequent short-term reversals.
Performs best when price oscillates between clear support/resistance levels.
The EMA filter improves reliability in trending markets but may reduce trade frequency.
Backtest to optimize consecutive close thresholds and EMA period for specific instruments.

Internal Bar Strength (IBS) Strategy█ STRATEGY DESCRIPTION
The "Internal Bar Strength (IBS) Strategy" is a mean-reversion strategy designed to identify trading opportunities based on the closing price's position within the daily price range. It enters a long position when the IBS indicates oversold conditions and exits when the IBS reaches overbought levels. This strategy was designed to be used on the daily timeframe.
█ WHAT IS INTERNAL BAR STRENGTH (IBS)?
Internal Bar Strength (IBS) measures where the closing price falls within the high-low range of a bar. It is calculated as:
IBS = (Close - Low) / (High - Low)
- **Low IBS (≤ 0.2)**: Indicates the close is near the bar's low, suggesting oversold conditions.
- **High IBS (≥ 0.8)**: Indicates the close is near the bar's high, suggesting overbought conditions.
█ SIGNAL GENERATION
1. LONG ENTRY
A Buy Signal is triggered when:
The IBS value drops below the Lower Threshold (default: 0.2).
The signal occurs within the specified time window (between `Start Time` and `End Time`).
2. EXIT CONDITION
A Sell Signal is generated when the IBS value rises to or above the Upper Threshold (default: 0.8). This prompts the strategy to exit the position.
█ ADDITIONAL SETTINGS
Upper Threshold: The IBS level at which the strategy exits trades. Default is 0.8.
Lower Threshold: The IBS level at which the strategy enters long positions. Default is 0.2.
Start Time and End Time: The time window during which the strategy is allowed to execute trades.
█ PERFORMANCE OVERVIEW
This strategy is designed for ranging markets and performs best when prices frequently revert to the mean.
It is sensitive to extreme IBS values, which help identify potential reversals.
Backtesting results should be analyzed to optimize the Upper/Lower Thresholds for specific instruments and market conditions.

Buy on 5 day low Strategy█ STRATEGY DESCRIPTION
The "Buy on 5 Day Low Strategy" is a mean-reversion strategy designed to identify potential buying opportunities when the price drops below the lowest low of the previous five days. It enters a long position when specific conditions are met and exits when the price exceeds the high of the previous day. This strategy is optimized for use on daily or higher timeframes.
█ WHAT IS THE 5-DAY LOW?
The 5-Day Low is the lowest price observed over the last five days. This level is used as a reference to identify potential oversold conditions and reversal points.
█ SIGNAL GENERATION
1. LONG ENTRY
A Buy Signal is triggered when:
The close price is below the lowest low of the previous five days (`close < _lowest `).
The signal occurs within the specified time window (between `Start Time` and `End Time`).
2. EXIT CONDITION
A Sell Signal is generated when the current closing price exceeds the high of the previous day (`close > high `). This indicates that the price has shown strength, potentially confirming the reversal and prompting the strategy to exit the position.
█ ADDITIONAL SETTINGS
Start Time and End Time: The time window during which the strategy is allowed to execute trades.
█ PERFORMANCE OVERVIEW
This strategy is designed for mean-reverting markets and performs best when the price frequently oscillates around key support levels.
It is sensitive to oversold conditions, as indicated by the 5-Day Low, and overbought conditions, as indicated by the previous day's high.
Backtesting results should be analyzed to optimize the strategy for specific instruments and market conditions.

3-Bar Low Strategy█ STRATEGY DESCRIPTION
The "3-Bar Low Strategy" is a mean-reversion strategy designed to identify potential buying opportunities when the price drops below the lowest low of the previous three bars. It enters a long position when specific conditions are met and exits when the price exceeds the highest high of the previous seven bars. This strategy is suitable for use on various timeframes.
█ WHAT IS THE 3-BAR LOW?
The 3-Bar Low is the lowest price observed over the last three bars. This level is used as a reference to identify potential oversold conditions and reversal points.
█ WHAT IS THE 7-BAR HIGH?
The 7-Bar High is the highest price observed over the last seven bars. This level is used as a reference to identify potential overbought conditions and exit points.
█ SIGNAL GENERATION
1. LONG ENTRY
A Buy Signal is triggered when:
The close price is below the lowest low of the previous three bars (`close < _lowest `).
The signal occurs within the specified time window (between `Start Time` and `End Time`).
If the EMA Filter is enabled, the close price must also be above the 200-period Exponential Moving Average (EMA).
2. EXIT CONDITION
A Sell Signal is generated when the current closing price exceeds the highest high of the previous seven bars (`close > _highest `). This indicates that the price has shown strength, potentially confirming the reversal and prompting the strategy to exit the position.
█ ADDITIONAL SETTINGS
MA Period: The lookback period for the 200-period EMA used in the EMA Filter. Default is 200.
Use EMA Filter: Enables or disables the EMA Filter for long entries. Default is disabled.
Start Time and End Time: The time window during which the strategy is allowed to execute trades.
█ PERFORMANCE OVERVIEW
This strategy is designed for mean-reverting markets and performs best when the price frequently oscillates around key support and resistance levels.
It is sensitive to oversold conditions, as indicated by the 3-Bar Low, and overbought conditions, as indicated by the 7-Bar High.
Backtesting results should be analyzed to optimize the MA Period and EMA Filter settings for specific instruments.

Bollinger Bands Reversal + IBS Strategy█ STRATEGY DESCRIPTION
The "Bollinger Bands Reversal Strategy" is a mean-reversion strategy designed to identify potential buying opportunities when the price deviates below the lower Bollinger Band and the Internal Bar Strength (IBS) indicates oversold conditions. It enters a long position when specific conditions are met and exits when the IBS indicates overbought conditions. This strategy is suitable for use on various timeframes.
█ WHAT ARE BOLLINGER BANDS?
Bollinger Bands consist of three lines:
- **Basis**: A Simple Moving Average (SMA) of the price over a specified period.
- **Upper Band**: The basis plus a multiple of the standard deviation of the price.
- **Lower Band**: The basis minus a multiple of the standard deviation of the price.
Bollinger Bands help identify periods of high volatility and potential reversal points.
█ WHAT IS INTERNAL BAR STRENGTH (IBS)?
Internal Bar Strength (IBS) is a measure of where the closing price is relative to the high and low of the bar. It is calculated as:
IBS = (Close - Low) / (High - Low)
A low IBS value (e.g., below 0.2) indicates that the close is near the low of the bar, suggesting oversold conditions. A high IBS value (e.g., above 0.8) indicates that the close is near the high of the bar, suggesting overbought conditions.
█ SIGNAL GENERATION
1. LONG ENTRY
A Buy Signal is triggered when:
The IBS value is below 0.2, indicating oversold conditions.
The close price is below the lower Bollinger Band.
The signal occurs within the specified time window (between `Start Time` and `End Time`).
2. EXIT CONDITION
A Sell Signal is generated when the IBS value exceeds 0.8, indicating overbought conditions. This prompts the strategy to exit the position.
█ ADDITIONAL SETTINGS
Length: The lookback period for calculating the Bollinger Bands. Default is 20.
Multiplier: The number of standard deviations used to calculate the upper and lower Bollinger Bands. Default is 2.0.
Start Time and End Time: The time window during which the strategy is allowed to execute trades.
█ PERFORMANCE OVERVIEW
This strategy is designed for mean-reverting markets and performs best when the price frequently deviates from the Bollinger Bands.
It is sensitive to oversold and overbought conditions, as indicated by the IBS, which helps to identify potential reversals.
Backtesting results should be analyzed to optimize the Length and Multiplier parameters for specific instruments.

Average High-Low Range + IBS Reversal Strategy█ STRATEGY DESCRIPTION
The "Average High-Low Range + IBS Reversal Strategy" is a mean-reversion strategy designed to identify potential buying opportunities when the price deviates significantly from its average high-low range and the Internal Bar Strength (IBS) indicates oversold conditions. It enters a long position when specific conditions are met and exits when the price shows strength by exceeding the previous bar's high. This strategy is suitable for use on various timeframes.
█ WHAT IS THE AVERAGE HIGH-LOW RANGE?
The Average High-Low Range is calculated as the Simple Moving Average (SMA) of the difference between the high and low prices over a specified period. It helps identify periods of increased volatility and potential reversal points.
█ WHAT IS INTERNAL BAR STRENGTH (IBS)?
Internal Bar Strength (IBS) is a measure of where the closing price is relative to the high and low of the bar. It is calculated as:
IBS = (Close - Low) / (High - Low)
A low IBS value (e.g., below 0.2) indicates that the close is near the low of the bar, suggesting oversold conditions.
█ SIGNAL GENERATION
1. LONG ENTRY
A Buy Signal is triggered when:
The close price has been below the buy threshold (calculated as `upper - (2.5 * hl_avg)`) for a specified number of consecutive bars (`bars_below_threshold`).
The IBS value is below the specified buy threshold (`ibs_buy_treshold`).
The signal occurs within the specified time window (between `Start Time` and `End Time`).
2. EXIT CONDITION
A Sell Signal is generated when the current closing price exceeds the high of the previous bar (`close > high `). This indicates that the price has shown strength, potentially confirming the reversal and prompting the strategy to exit the position.
█ ADDITIONAL SETTINGS
Length: The lookback period for calculating the average high-low range. Default is 20.
Bars Below Threshold: The number of consecutive bars the price must remain below the buy threshold to trigger a Buy Signal. Default is 2.
IBS Buy Threshold: The IBS value below which a Buy Signal is triggered. Default is 0.2.
Start Time and End Time: The time window during which the strategy is allowed to execute trades.
█ PERFORMANCE OVERVIEW
This strategy is designed for mean-reverting markets and performs best when the price frequently deviates from its average high-low range.
It is sensitive to oversold conditions, as indicated by the IBS, which helps to identify potential reversals.
Backtesting results should be analyzed to optimize the Length, Bars Below Threshold, and IBS Buy Threshold parameters for specific instruments.

Turn of the Month Strategy on Steroids█ STRATEGY DESCRIPTION
The "Turn of the Month Strategy on Steroids" is a seasonal mean-reversion strategy designed to capitalize on price movements around the end of the month. It enters a long position when specific conditions are met and exits when the Relative Strength Index (RSI) indicates overbought conditions. This strategy is optimized for use on daily or higher timeframes.
█ WHAT IS THE TURN OF THE MONTH EFFECT?
The Turn of the Month effect refers to the observed tendency of stock prices to rise around the end of the month. This strategy leverages this phenomenon by entering long positions when the price shows signs of a reversal during this period.
█ SIGNAL GENERATION
1. LONG ENTRY
A Buy Signal is triggered when:
The current day of the month is greater than or equal to the specified `dayOfMonth` threshold (default is 25).
The close price is lower than the previous day's close (`close < close `).
The previous day's close is also lower than the close two days ago (`close < close `).
The signal occurs within the specified time window (between `Start Time` and `End Time`).
There is no existing open position (`strategy.position_size == 0`).
2. EXIT CONDITION
A Sell Signal is generated when the 2-period RSI exceeds 65, indicating overbought conditions. This prompts the strategy to exit the position.
█ ADDITIONAL SETTINGS
Day of Month: The day of the month threshold for triggering a Buy Signal. Default is 25.
Start Time and End Time: The time window during which the strategy is allowed to execute trades.
█ PERFORMANCE OVERVIEW
This strategy is designed to exploit seasonal price patterns around the end of the month.
It performs best in markets where the Turn of the Month effect is pronounced.
Backtesting results should be analyzed to optimize the `dayOfMonth` threshold and RSI parameters for specific instruments.

Consecutive Bars Above/Below EMA Buy the Dip Strategy█ STRATEGY DESCRIPTION
The "Consecutive Bars Above/Below EMA Buy the Dip Strategy" is a mean-reversion strategy designed to identify potential buying opportunities when the price dips below a moving average for a specified number of consecutive bars. It enters a long position when the dip condition is met and exits when the price shows strength by exceeding the previous bar's high. This strategy is suitable for use on various timeframes.
█ WHAT IS THE MOVING AVERAGE?
The strategy uses either a Simple Moving Average (SMA) or an Exponential Moving Average (EMA) as a reference for identifying dips. The type and length of the moving average can be customized in the settings.
█ SIGNAL GENERATION
1. LONG ENTRY
A Buy Signal is triggered when:
The close price is below the selected moving average for a specified number of consecutive bars (`consecutiveBarsTreshold`).
The signal occurs within the specified time window (between `Start Time` and `End Time`).
2. EXIT CONDITION
A Sell Signal is generated when the current closing price exceeds the high of the previous bar (`close > high `). This indicates that the price has shown strength, potentially confirming the reversal and prompting the strategy to exit the position.
█ ADDITIONAL SETTINGS
Consecutive Bars Threshold: The number of consecutive bars the price must remain below the moving average to trigger a Buy Signal. Default is 3.
MA Type: The type of moving average used (SMA or EMA). Default is SMA.
MA Length: The length of the moving average. Default is 5.
Start Time and End Time: The time window during which the strategy is allowed to execute trades.
█ PERFORMANCE OVERVIEW
This strategy is designed for mean-reverting markets and performs best when the price frequently oscillates around the moving average.
It is sensitive to the number of consecutive bars below the moving average, which helps to identify potential dips.
Backtesting results should be analysed to optimize the Consecutive Bars Threshold, MA Type, and MA Length for specific instruments.

Turn around Tuesday on Steroids Strategy█ STRATEGY DESCRIPTION
The "Turn around Tuesday on Steroids Strategy" is a mean-reversion strategy designed to identify potential price reversals at the start of the trading week. It enters a long position when specific conditions are met and exits when the price shows strength by exceeding the previous bar's high. This strategy is optimized for ETFs, stocks, and other instruments on the daily timeframe.
█ WHAT IS THE STARTING DAY?
The Starting Day determines the first day of the trading week for the strategy. It can be set to either Sunday or Monday, depending on the instrument being traded. For ETFs and stocks, Monday is recommended. For other instruments, Sunday is recommended.
█ SIGNAL GENERATION
1. LONG ENTRY
A Buy Signal is triggered when:
The current day is the first day of the trading week (either Sunday or Monday, depending on the Starting Day setting).
The close price is lower than the previous day's close (`close < close `).
The previous day's close is also lower than the close two days ago (`close < close `).
The signal occurs within the specified time window (between `Start Time` and `End Time`).
If the MA Filter is enabled, the close price must also be above the 200-period Simple Moving Average (SMA).
2. EXIT CONDITION
A Sell Signal is generated when the current closing price exceeds the high of the previous bar (`close > high `). This indicates that the price has shown strength, potentially confirming the reversal and prompting the strategy to exit the position.
█ ADDITIONAL SETTINGS
Starting Day: Determines the first day of the trading week. Options are Sunday or Monday. Default is Sunday.
Use MA Filter: Enables or disables the 200-period SMA filter for long entries. Default is disabled.
Start Time and End Time: The time window during which the strategy is allowed to execute trades.
█ PERFORMANCE OVERVIEW
This strategy is designed for markets with frequent weekly reversals.
It performs best in volatile conditions where price movements are significant at the start of the trading week.
Backtesting results should be analysed to optimize the Starting Day and MA Filter settings for specific instruments.

Consecutive Bearish Candle Strategy█ STRATEGY DESCRIPTION
The "Consecutive Bearish Candle Strategy" is a momentum-based strategy designed to identify potential reversals after a sustained bearish move. It enters a long position when a specific number of consecutive bearish candles occur and exits when the price shows strength by exceeding the previous bar's high. This strategy is optimized for use on various timeframes and instruments.
█ SIGNAL GENERATION
1. LONG ENTRY
A Buy Signal is triggered when:
The close price has been lower than the previous close for at least `Lookback` consecutive bars. This indicates a sustained bearish move, suggesting a potential reversal.
The signal occurs within the specified time window (between `Start Time` and `End Time`).
2. EXIT CONDITION
A Sell Signal is generated when the current closing price exceeds the high of the previous bar (`close > high `). This indicates that the price has shown strength, potentially confirming the reversal and prompting the strategy to exit the position.
█ ADDITIONAL SETTINGS
Lookback: The number of consecutive bearish bars required to trigger a Buy Signal. Default is 3.
Start Time and End Time: The time window during which the strategy is allowed to execute trades.
█ PERFORMANCE OVERVIEW
This strategy is designed for markets with frequent momentum shifts.
It performs best in volatile conditions where price movements are significant.
Backtesting results should be analysed to optimize the `Lookback` parameter for specific instruments.

Adaptive Trend Flow Strategy with Filters for SPXThe Adaptive Trend Flow Strategy with Filters for SPX is a complete trading algorithm designed to identify traits and offer actionable alerts for the SPX index. This Pine Script approach leverages superior technical signs and user-described parameters to evolve to marketplace conditions and optimize performance.
Key Features and Functionality
Dynamic Trend Detection: Utilizes a dual EMA-based totally adaptive method for fashion calculation.
The script smooths volatility the usage of an EMA filter and adjusts sensitivity through the sensitivity enter. This allows for real-time adaptability to market fluctuations.
Trend Filters for Precision:
SMA Filter: A Simple Moving Average (SMA) guarantees that trades are achieved best while the rate aligns with the shifting average trend, minimizing false indicators.
MACD Filter: The Moving Average Convergence Divergence (MACD) adds some other layer of confirmation with the aid of requiring alignment among the MACD line and its sign line.
Signal Generation:
Long Signals: Triggered when the fashion transitions from bearish to bullish, with all filters confirming the pass.
Short Signals: Triggered while the trend shifts from bullish to bearish, imparting opportunities for final positions.
User Customization:
Adjustable parameters for EMAs, smoothing duration, and sensitivity make certain the strategy can adapt to numerous buying and selling patterns.
Enable or disable filters (SMA or MACD) based totally on particular market conditions or consumer possibilities.
Leverage and Position Sizing: Incorporates a leverage aspect for dynamic position sizing.
Automatically calculates the exchange length based on account fairness and the leverage element, making sure hazard control is in area.
Visual Enhancements: Plots adaptive fashion ranges (foundation, top, decrease) for actual-time insights into marketplace conditions.
Color-coded bars and heritage to visually represent bullish or bearish developments.
Custom labels indicating crossover and crossunder occasions for clean sign visualization.
Alerts and Automation: Configurable alerts for each lengthy and quick indicators, well matched with automated buying and selling structures like plugpine.Com.
JSON-based alert messages consist of account credentials, motion type, and calculated position length for seamless integration.
Backtesting and Realistic Assumptions: Includes practical slippage, commissions, and preliminary capital settings for backtesting accuracy.
Leverages excessive-frequency trade sampling to make certain strong strategy assessment.
How It Works
Trend Calculation: The method derives a principal trend basis with the aid of combining fast and gradual EMAs. It then uses marketplace volatility to calculate adaptive upper and decrease obstacles, creating a dynamic channel.
Filter Integration: SMA and MACD filters work in tandem with the fashion calculation to ensure that handiest excessive-probability signals are accomplished.
Signal Execution: Signals are generated whilst the charge breaches those dynamic tiers and aligns with the fashion and filters, ensuring sturdy change access situations.
How to Use
Setup: Apply the approach to SPX or other well suited indices.
Adjust person inputs, together with ATR length, EMA smoothing, and sensitivity, to align together with your buying and selling possibilities.
Enable or disable the SMA and MACD filters to test unique setups.
Alerts: Configure signals for computerized notifications or direct buying and selling execution through third-celebration systems.
Use the supplied JSON payload to integrate with broking APIs or automation tools.
Optimization:
Experiment with leverage, filter out settings, and sensitivity to find most effective configurations to your hazard tolerance and marketplace situations.
Considerations and Best Practices
Risk Management: Always backtest the method with realistic parameters, together with conservative leverage and commissions.
Market Suitability: While designed for SPX, this method can adapt to other gadgets by means of adjusting key parameters.
Limitations: The method is trend-following and can underperform in enormously risky or ranging markets. Regularly evaluate and modify parameters primarily based on recent market conduct.
If you have any questions please let me know - I'm here to help!

S&P 500 E-Mini TrackerThis script generates a reference price for the S&P 500 ETF - SPY based on the current price of the ES contract, which is an E-Mini Futures contract representing the S&P 500 index. The indicator plots this reference price on the chart, providing a unique view of the relationship between these two popular markets.
Advantages:
Identifies divergence between the ES and SPY prices, indicating potential trading opportunities or shifts in market sentiment.
Confirms trends by showing the correlation between the ES and SPY prices.
Eliminates the need for multiple charts, allowing traders to focus on a single screen and make more informed decisions.
Customizable Parameters:
Color Scheme: Choose from various color options to customize the appearance of the indicator.
Line Style: Select from different line styles to change the visual representation of the reference price.
Divisor: Set the dividing factor to adjust the ratio at which the reference price is calculated. (Default value: 10). It is recommended to keep it at 10 for SPY.
To use it with other Stocks/ ETFs, use simple ratio math to calculate the divisor and you can customize the indicator to scale accordingly.
By using this indicator, traders can gain a deeper understanding of the relationship between the E-Mini and SPY markets, making it easier to identify trading opportunities and confirm trends.

Options Betting Range - Extended# Options Betting Range - Extended
**Options Betting Range - Extended** is a versatile TradingView indicator designed to assist traders in identifying and visualizing optimal options trading ranges for multiple symbols. By leveraging predefined prediction and execution dates along with specific high and low price points, this indicator dynamically draws trendlines to highlight potential options betting zones, enhancing your trading strategy and decision-making process.
## **Key Features**
- **Multi-Symbol Support:** Automatically adapts to popular symbols such as SPY, IWM, QQQ, DIA, TLT, and GOOG, providing tailored options betting ranges for each.
- **Dynamic Trendlines:** Draws both dashed and solid trendlines based on user-defined prediction and execution dates, clearly marking high and low price boundaries.
- **Customizable Parameters:** Easily configure prediction and execution dates, high and low prices, and timezones to suit your specific trading requirements.
- **Single Execution:** Ensures that each trendline is drawn only once per specified prediction date, preventing clutter and maintaining chart clarity.
- **Clear Visual Indicators:** Utilizes color-coded labels to denote high (green) and low (red) price points, making it easy to identify critical trading levels at a glance.
## **How It Works**
1. **Initialization:**
- Upon adding the indicator to your chart, it initializes with predefined symbols and their corresponding high and low price points for two trendlines each.
2. **Configuration:**
- **Trendline 1:**
- **Prediction Date:** Set the year, month, and day when the trendline should be predicted.
- **Execution Date:** Define the year, month, and day when the trendline will be executed.
- **Timezone:** Choose the appropriate timezone to ensure accurate date matching.
- **Trendline 2:**
- Similarly, configure the prediction and execution dates along with the timezone.
3. **Trendline Drawing:**
- On reaching the specified prediction date, the indicator draws dashed trendlines representing the high and low price ranges.
- Solid trendlines are then drawn to solidify the high and low price boundaries.
- Labels are added to clearly mark the high and low price points on the chart.
4. **Visualization:**
- The trendlines and labels provide a visual framework for potential options trading ranges, allowing traders to make informed decisions based on these predefined levels.
## **How to Use**
1. **Add the Indicator:**
- Open your TradingView chart and apply the **Options Betting Range - Extended** indicator.
2. **Select a Symbol:**
- Ensure that the chart is set to one of the supported symbols (e.g., SPY, IWM, QQQ, DIA, TLT, GOOG) to activate the corresponding trendline configurations.
3. **Configure Trendline Parameters:**
- Access the indicator settings to input your desired prediction and execution dates, high and low prices, and select the appropriate timezone for each trendline.
4. **Monitor Trendlines:**
- As the chart progresses to the specified prediction dates, observe the dynamically drawn trendlines and labels indicating the options betting ranges.
5. **Make Informed Trades:**
- Utilize the visual cues provided by the trendlines to identify optimal entry and exit points for your options trading strategies.
## **Benefits**
- **Enhanced Strategy Visualization:** Clearly outlines potential trading ranges, aiding in the formulation and execution of precise options strategies.
- **Time-Saving Automation:** Automatically draws trendlines based on your configurations, reducing the need for manual chart analysis.
- **Improved Decision-Making:** Provides objective price levels for trading, minimizing emotional bias and enhancing analytical precision.
## **Important Considerations**
- **Timezone Accuracy:** Ensure that the timezones selected in the indicator settings align with your chart's timezone to maintain accurate date matching.
- **Chart Timeframe:** The prediction dates should correspond to the timeframe of your chart (e.g., daily, hourly) to ensure that trendlines are triggered correctly.
- **Visible Price Range:** Verify that the high and low prices set for trendlines are within the visible range of your chart to ensure that all trendlines and labels are clearly visible.
## **Conclusion**
**Options Betting Range - Extended** is a powerful tool for traders seeking to automate and visualize their options trading ranges across multiple symbols. By providing clear, customizable trendlines based on specific prediction and execution dates, this indicator enhances your ability to identify and act upon strategic trading opportunities with confidence.
---

S&P 500 Sector StrengthsThe "S&P 500 Sector Strengths" indicator is a sophisticated tool designed to provide traders and investors with a comprehensive view of the relative performance of various sectors within the S&P 500 index. This indicator utilizes the True Strength Index (TSI) to measure and compare the strength of different sectors, offering valuable insights into market trends and sector rotations.
At its core, the indicator calculates the TSI for each sector using price data obtained through the request.security() function. The TSI, a momentum oscillator, is computed using a user-defined smoothing period, allowing for customization based on individual preferences and trading styles. The resulting TSI values for each sector are then plotted on the chart, creating a visual representation of sector strengths.
To use this indicator effectively, traders should focus on comparing the movements of different sector lines. Sectors with lines moving higher are showing increasing strength, while those with descending lines are exhibiting weakness. This comparative analysis can help identify potential investment opportunities and sector rotations. Additionally, when multiple sector lines move in tandem, it may signal a broader market trend.
The indicator includes dashed lines at 0.5 and -0.5, serving as reference points for overbought and oversold conditions. Sectors with TSI values above 0.5 might be considered overbought, suggesting caution, while those below -0.5 could be viewed as oversold, potentially indicating buying opportunities.
One of the key advantages of this indicator is its flexibility. Users can toggle the visibility of individual sectors and customize their colors, allowing for a tailored analysis experience. This feature is particularly useful when focusing on specific sectors or reducing chart clutter for clearer visualization.
The indicator's ability to provide a comprehensive overview of all major S&P 500 sectors in a single chart is a significant benefit. This consolidated view enables quick comparisons and helps in identifying relative strengths and weaknesses across sectors. Such insights can be invaluable for portfolio allocation decisions and in spotting emerging market trends.
Moreover, the dynamic legend feature enhances the indicator's usability. It automatically updates to display only the visible sectors, improving chart readability and interpretation.
By leveraging this indicator, market participants can gain a deeper understanding of sector dynamics within the S&P 500. This enhanced perspective can lead to more informed decision-making in sector allocation strategies and individual stock selection. The indicator's ability to potentially detect early trends by comparing sector strengths adds another layer of value, allowing users to position themselves ahead of broader market movements.
In conclusion, the "S&P 500 Sector Strengths" indicator is a powerful tool that combines technical analysis with sector comparison. Its user-friendly interface, customizable features, and comprehensive sector coverage make it an valuable asset for traders and investors seeking to navigate the complexities of the S&P 500 market with greater confidence and insight.

Daily BreadWhat it does:
This script uses specific multiple true ranges from a 30 EMA baseline to plot lines that represent 10% buying increments. Although the common period for ATR is 14, this script employs a period of 20 for smoothing that I have determined is more effective when used with a daily candle chart. It includes onscreen trend signals to identify an uptrend or downtrend when the 50 EMA crosses the 90 EMA and will also display a coloured directional signal at each candle beyond an EMA cross to identify the current trend.
The script plots a scale of percentage labels at the end of each line to identify the percent of an account intended to be in short or longer term trades.
How it does it:
The script uses a 30 EMA baseline and then multiplies ATR increments of +1, +2, +4 and -1 through -7. These ATR multiples and the EMA are plotted as 11 lines, 10 of which make up the range of 10% increments from 10% to 100% with the 11th line being the High Band representing the extreme high or expected sale of any holdings. The percentage label scale uses variable declarations to position and colour match a percentage label to each line.
Intended use:
It is intended to be used for short term trading or long term investing with a daily market index chart such as SPY and multiple exchange traded funds that track said market index. A different ETF is purchased when a daily SPY candle reaches a lower buy band using 10% of a total account value. The sale of any ETFs is at the discretion of the trader and dependent on investment strategy (short term trading or long term inventing) and the trend. When short term trading in a downtrend or when daily candles are below the 50 EMA, selling would be done every 2 to 3 bands above a buy to mitigate the risk of a significant portion of an account getting caught in a downtrend. In an uptrend the High Band would be used to sell any holdings.

Unlock the Power of Seasonality: Monthly Performance StrategyThe Monthly Performance Strategy leverages the power of seasonality—those cyclical patterns that emerge in financial markets at specific times of the year. From tax deadlines to industry-specific events and global holidays, historical data shows that certain months can offer strong opportunities for trading. This strategy was designed to help traders capture those opportunities and take advantage of recurring market patterns through an automated and highly customizable approach.
The Inspiration Behind the Strategy:
This strategy began with the idea that market performance is often influenced by seasonal factors. Historically, certain months outperform others due to a variety of reasons, like earnings reports, holiday shopping, or fiscal year-end events. By identifying these periods, traders can better time their market entries and exits, giving them an advantage over those who solely rely on technical indicators or news events.
The Monthly Performance Strategy was built to take this concept and automate it. Instead of manually analyzing market data for each month, this strategy enables you to select which months you want to focus on and then executes trades based on predefined rules, saving you time and optimizing the performance of your trades.
Key Features:
Customizable Month Selection: The strategy allows traders to choose specific months to test or trade on. You can select any combination of months—for example, January, July, and December—to focus on based on historical trends. Whether you’re targeting the historically strong months like December (often driven by the 'Santa Rally') or analyzing quieter months for low volatility trades, this strategy gives you full control.
Automated Monthly Entries and Exits: The strategy automatically enters a long position on the first day of your selected month(s) and exits the trade at the beginning of the next month. This makes it perfect for traders who want to benefit from seasonal patterns without manually monitoring the market. It ensures precision in entering and exiting trades based on pre-set timeframes.
Re-entry on Stop Loss or Take Profit: One of the standout features of this strategy is its ability to re-enter a trade if a position hits the stop loss (SL) or take profit (TP) level during the selected month. If your trade reaches either a SL or TP before the month ends, the strategy will automatically re-enter a new trade the next trading day. This feature ensures that you capture multiple trading opportunities within the same month, instead of exiting entirely after a successful or unsuccessful trade. Essentially, it keeps your capital working for you throughout the entire month, not just when conditions align perfectly at the beginning.
Built-in Risk Management: Risk management is a vital part of this strategy. It incorporates an Average True Range (ATR)-based stop loss and take profit system. The ATR helps set dynamic levels based on the market’s volatility, ensuring that your stops and targets adjust to changing market conditions. This not only helps limit potential losses but also maximizes profit potential by adapting to market behavior.
Historical Performance Testing: You can backtest this strategy on any period by setting the start year. This allows traders to analyze past market data and optimize their strategy based on historical performance. You can fine-tune which months to trade based on years of data, helping you identify trends and patterns that provide the best trading results.
Versatility Across Asset Classes: While this strategy can be particularly effective for stock market indices and sector rotation, it’s versatile enough to apply to other asset classes like forex, commodities, and even cryptocurrencies. Each asset class may exhibit different seasonal behaviors, allowing you to explore opportunities across various markets with this strategy.
How It Works:
The trader selects which months to test or trade, for example, January, April, and October.
The strategy will automatically open a long position on the first trading day of each selected month.
If the trade hits either the take profit or stop loss within the month, the strategy will close the current position and re-enter a new trade on the next trading day, provided the month has not yet ended. This ensures that the strategy continues to capture any potential gains throughout the month, rather than stopping after one successful trade.
At the start of the next month, the position is closed, and if the next month is also selected, a new trade is initiated following the same process.
Risk Management and Dynamic Adjustments:
Incorporating risk management with this strategy is as easy as turning on the ATR-based system. The strategy will automatically calculate stop loss and take profit levels based on the market’s current volatility, adjusting dynamically to the conditions. This ensures that the risk is controlled while allowing for flexibility in capturing profits during both high and low volatility periods.
Maximizing the Seasonal Edge:
By automating entries and exits based on specific months and combining that with dynamic risk management, the Ultimate Monthly Performance Strategy takes advantage of seasonal patterns without requiring constant monitoring. The added re-entry feature after hitting a stop loss or take profit ensures that you are always in the game, maximizing your chances to capture profitable trades during favorable seasonal periods.
Who Can Benefit from This Strategy?
This strategy is perfect for traders who:
Want to exploit the predictable, recurring patterns that occur during specific months of the year.
Prefer a hands-off, automated trading approach that allows them to focus on other aspects of their portfolio or life.
Seek to manage risk effectively with ATR-based stop losses and take profits that adjust to market conditions.
Appreciate the ability to re-enter trades when a take profit or stop loss is hit within the month, ensuring that they don't miss out on multiple opportunities during a favorable period.
In summary, the Ultimate Monthly Performance Strategy provides traders with a comprehensive tool to capitalize on seasonal trends, optimize their trading opportunities throughout the year, and manage risk effectively. The built-in re-entry system ensures you continue to benefit from the market even after hitting targets within the same month, making it a robust strategy for traders looking to maximize their edge in any market.
Risk Disclaimer:
Trading financial markets involves significant risk and may not be suitable for all investors. The Monthly Performance Strategy is designed to help traders identify seasonal trends, but past performance does not guarantee future results. It is important to carefully consider your risk tolerance, financial situation, and trading goals before using any strategy. Always use appropriate risk management and consult with a professional financial advisor if necessary. The use of this strategy does not eliminate the risk of losses, and traders should be prepared for the possibility of losing their entire investment. Be sure to test the strategy on a demo account before applying it in live markets.

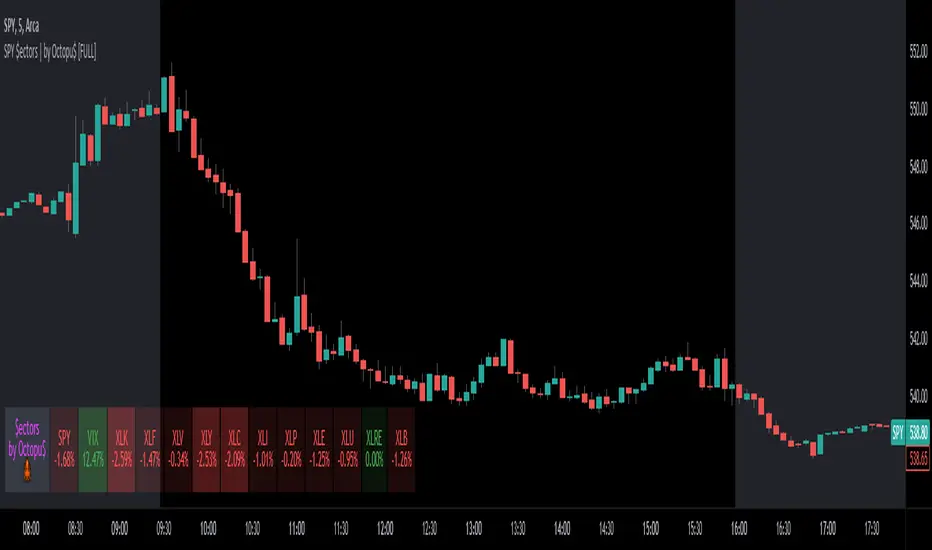
SPY $ectors | by Octopu$🏭 SPY Sectors with % Variance and Ticker Status| by Octopu$
What is SPY Sectors?
They are 11 SPY Sectors based on activity, which groups together their specific markets as well as the composition about the Tickers on the Sector.
For example: information technology, consumer discretionary, consumer staples, health care, financials, industrials, communication services, energy, , materials, utilities, real estate.
It is an useful resource for a trading system:
Can be used to follow up with tickers/sectors up and down moves and percentages as well as overall status and market sentiment as a whole.
AMEX:SPY
This indicator however should not be used as a standalone tool.
(The combination of factors relies on your own knowledge about Confluence Factors along with your Due Diligence)
This indicator is not an advice to buy or sell securities in any form.
ANY Ticker. ANY Timeframe.
Features:
• ALL Sector Track
• Up and Down Status
• Green and Red Colors
• % Indication
Options:
• Customization
• Location
Notes:
v1.0
Indicator release.
Changes and updates can come in the future for additional functionalities or per requests. Follow and Stay Tuned!
Did you like it? Please Support and Shoot me a message! I'd appreciate if you dropped by to say thanks! Thank you.
- Octopu$
🐙
QQQ and SPY Price Levels [MW]Introduction:
Don’t let SPY and QQQ resistance levels hurt your futures trading anymore. The QQQ and SPY Price Levels indicator automagically provides easily accessible QQQ price levels for NASDAQ-related charts such as QQQ, /NQ and /MNQ futures, and leveraged ETFs such as TQQQ and SQQQ as well as for SPY price levels for S&P 500-related charts such as SPY, /ES and /MES futures, SPX, and leveraged ETFs such as UPRO and SPXU. If you’ve ever traded futures, or anything QQQ- or SPY-related and wanted to know at what price would the corresponding asset reach a key whole number level of QQQ or SPY, like 400, 440, 445, or even 447.50, this tool is for you. Key 10x, 5x, and even 2.5x multiples of QQQ and SPY can act as support or resistance for other related-assets. Until now, there hasn’t been an indicator that can serve as an easy visual cue to know exactly when that is about to happen across assets.
This indicator is a fork of the original SPY Price Levels indicator, which only considered SPY-related assets.
Settings:
QQQ/SPY 2.5x: Show closest levels above and below that are multiples of 2.5 on QQQ
QQQ/SPY 5x: Show closest levels above and below that are multiples of 5 on QQQ
QQQ/SPY 10x: Show closest levels above and below that are multiples of 10 on QQQ
Show QQQ/SPY Price Label: Show the current QQQ/SPY price
Extend lines to the left: Extend label lines for each price level to the beginning of the chart
Calculations:
This indicator defines the ratio between the price of QQQ/SPY and another NASDAQ/S&P-related asset and uses that multiplier once the user-defined price increments are defined. For example, if /MNQ is at 19000 and QQQ is at 465, then the ratio would be 40.8.
The incremental QQQ levels that are above and below the QQQ price are calculated using the following equations:
qqqLevelUp = _multiplier * math.ceil(_qqqClose / _multiplier)
qqqLevelDown = _multiplier * math.floor(_qqqClose / _multiplier)
The conversion ratio is then multiplied by that amount to get the final estimated corresponding price using the calculation:
levelUp := _conversion * qqqLevelUp
levelDown := _conversion * qqqLevelDown
For leveraged assets, the conversion must be used on the difference between the current QQQ price and the incremental upper and lower levels.
For example, the calculation for the next level up looks like the following:
levelUpDelta := math.abs(_qqqClose - qqqLevelUp)
levelUp := close + _conversion * (levelUpDelta * _leverage)
This logic is identical for SPY-related assets.
How to Use:
The QQQ and SPY Price Levels indicator aims to be as unobtrusive as possible. The default view shows 3 labels and 2 lines that are all aligned to the right of the main chart, so that it interferes as little as possible with any other indicators. It can be added to any /NQ or /MNQ futures chart, SQQQ, TQQQ, and, of course, QQQ as well as any /ES /MES futures chart, SPXU, UPRO, SPX, and of course SPY. The most immediate price levels for each multiplier appears above and below the current price along with the price of QQQ/SPY.
For example, MNQU2024 is currently at 19594. By looking at the indicator the next QQQ increment below is at 475, or 19556 on the MNQU2024 chart. This potential support is marked with a green label that shows both prices. The next increment above is at QQQ 477.50, or 19659 on the MESU2024 chart. And the QQQ price itself, is also shown (and can be removed) at 475.92.
QQQ and SPY price increments of 2.5, 5, and 10 tend to consistently act at the very least as emotional support and resistance levels. Weak, or weakening volume and/or momentum when these levels are hit can trigger a strong rejection, and can sometimes precipitate lengthy consolidation periods at those levels. Watching an NASDAQ- and S&P 500-related asset come to a halt, fall off a cliff, or react in some other unintuitive way could very well be the result of a QQQ/SPY level being reached. Even though many of us know that this relationship exists, it’s easy to forget. So, this indicator helps to ensure that its users keep that relationship front and center.
By extending the lines into the past on QQQ/SPY and their related assets, you can see what reactions happened at these key levels.
Other Usage Notes and Limitations:
The calculations used only provide an estimated relationship or a close approximation, and are not exact.
It's important for traders to be aware of the limitations of any indicator and to use them as part of a broader, well-rounded trading strategy that includes risk management, fundamental analysis, and other tools that can help with reducing false signals, determining trend direction, and providing additional confirmation for a trade decision. Diversifying strategies and not relying solely on one type of indicator or analysis can help mitigate some of these risks.

SP500 RatiosThe "SP500 Ratios" indicator is a powerful tool developed for the TradingView platform, allowing users to access a variety of financial ratios and inflation-adjusted data related to the S&P 500 index. This indicator integrates with Nasdaq Data Link (formerly known as Quandl) to retrieve historical data, providing a comprehensive overview of key financial metrics associated with the S&P 500.
Key Features
Price to Sales Ratio: Quarterly ratio of price to sales (revenue) for the S&P 500.
Dividend Yield: Monthly dividend yield based on 12-month dividend per share.
Price Earnings Ratio (PE Ratio): Monthly price-to-earnings ratio based on trailing twelve-month reported earnings.
CAPE Ratio (Shiller PE Ratio): Monthly cyclically adjusted PE ratio, based on average inflation-adjusted earnings over the past ten years.
Earnings Yield: Monthly earnings yield, the inverse of the PE ratio.
Price to Book Ratio: Quarterly ratio of price to book value.
Inflation Adjusted S&P 500: Monthly S&P 500 level adjusted for inflation.
Revenue Per Share: Quarterly trailing twelve-month sales per share, not adjusted for inflation.
Earnings Per Share: Monthly real earnings per share, adjusted for inflation.
User Configuration
The indicator offers flexibility through user-configurable options. You can choose to display or hide each metric according to your analysis needs. Users can also adjust the line width for better visibility on the chart.
Visualization
The selected data is plotted on the chart with distinct colors for each metric, facilitating visual analysis. A dynamic legend table is also generated in the top-right corner of the chart, listing the currently displayed metrics with their associated colors.
This indicator is ideal for traders and analysts seeking detailed insights into the financial performance and valuations of the S&P 500, while benefiting from the customization flexibility offered by TradingView.

Relative Strength (Volatility Adjusted)The volatility adjusted relative strength indicator offers a more precise approach to traditional RS indicators by incorporating volatility adjustments into its calculations. This will provide traders with a more nuanced view of relative performance between a selected instrument and a comparison index.
Identifying Relative Strength (RS) and Weakness (RW) against a benchmark like the SPY is crucial for traders, as it highlights institutional activity in an equity, which retail traders rarely achieve on their own. However, the traditional method of simply comparing the rate of change of a stock to the rate of change for the SPY can be flawed. This method often fails to account for the inherent volatility of each stock, leading to misleading RS/RW readings.
Consider two stocks that both move in response to SPY's movements. If SPY moves significantly more than its average (measured by its ATR), and the stock does the same, traditional RS calculations might show strength when, in fact, the stock is just mirroring SPY's increased volatility. For instance, if SPY typically moves $0.25 an hour but suddenly moves $1, and a stock typically moves $0.50 but moves $2, the stock's apparent RS might be overstated, when in reality there is no relative strength for the stock.
By adjusting for volatility using the ATR (Average True Range), we normalize these movements and get a clearer picture of true RS/RW. For example, if SPY moves 5 times its average rate and a stock moves the same multiple of its own ATR, the RS should be considered neutral rather than strong. Similarly if a stock in absolute terms moves $1 while the SPY also moves $1 but the stock usually moves at twice the rate of the SPY, the stock should be considered relatively weak - not neutral.
Usage
Use this to identify stocks with actual strength or weakness compared to the market.
When the RS line is above 0 and above the moving average it indicates a stock with relative strength that is still gaining more strength.
When the RS line is above 0 but above the moving average it indicates a stock with relative strength that is currently losing strength.
When the RS line is below 0 and below the moving average it indicates a stock with relative weakness that is still losing strength.
When the RS line is below 0 but above the moving average it indicates a stock with relative weakness that is starting to gain back some strength.

S&P Short-Range Oscillator**SHOULD BE USED ON THE S&P 500 ONLY**
The S&P Short-Range Oscillator (SRO), inspired by the principles of Jim Cramer's oscillator, is a technical analysis tool designed to help traders identify potential buy and sell signals in the stock market, specifically for the S&P 500 index. The SRO combines several market indicators to provide a normalized measure of market sentiment, assisting traders in making informed decisions.
The SRO utilizes two simple moving averages (SMAs) of different lengths: a 5-day SMA and a 10-day SMA. It also incorporates the daily price change and market breadth (the net change of closing prices). The 5-day and 10-day SMAs are calculated based on the closing prices. The daily price change is determined by subtracting the opening price from the closing price. Market breadth is calculated as the difference between the current closing price and the previous closing price.
The raw value of the oscillator, referred to as SRO Raw, is the sum of the daily price change, the 5-day SMA, the 10-day SMA, and the market breadth. This raw value is then normalized using its mean and standard deviation over a 20-day period, ensuring that the oscillator is centered and maintains a consistent scale. Finally, the normalized value is scaled to fit within the range of -15 to 15.
When interpreting the SRO, a value below -5 indicates that the market is potentially oversold, suggesting it might be a good time to start buying stocks as the market could be poised for a rebound. Conversely, a value above 5 suggests that the market is potentially overbought. In this situation, it may be prudent to hold on to existing positions or consider selling if you have substantial gains.
The SRO is visually represented as a blue line on a chart, making it easy to track its movements. Red and green horizontal lines mark the overbought (5) and oversold (-5) levels, respectively. Additionally, the background color changes to light red when the oscillator is overbought and light green when it is oversold, providing a clear visual cue.
By incorporating the S&P Short-Range Oscillator into your trading strategy, you can gain valuable insights into market conditions and make more informed decisions about when to buy, sell, or hold your stocks. However, always consider other market factors and perform your own analysis before making any trading decisions.
The S&P Short-Range Oscillator is a powerful tool for traders looking to gain insights into market sentiment. It provides clear buy and sell signals through its combination of multiple indicators and normalization process. However, traders should be aware of its lagging nature and potential complexity, and use it in conjunction with other analysis methods for the best results.
Disclaimer
The S&P Short-Range Oscillator is for informational purposes only and should not be considered financial advice. Trading involves risk, and you should conduct your own research or consult a financial advisor before making investment decisions. The author is not responsible for any losses incurred from using this indicator. Use at your own risk.
