Correlation HeatMap Matrix Data [TradingFinder]🔵 Introduction
Correlation is a statistical measure that shows the degree and direction of a linear relationship between two assets.
Its value ranges from -1 to +1 : +1 means perfect positive correlation, 0 means no linear relationship, and -1 means perfect negative correlation.
In financial markets, correlation is used for portfolio diversification, risk management, pairs trading, intermarket analysis, and identifying divergences.
Correlation HeatMap Matrix Data TradingFinder is a Pine Script v6 library that calculates and returns raw correlation matrix data between up to 20 symbols. It only provides the data – it does not draw or render the heatmap – making it ideal for use in other scripts that handle visualization or further analysis. The library uses ta.correlation for fast and accurate calculations.
It also includes two helper functions for visual styling :
CorrelationColor(corr) : takes the correlation value as input and generates a smooth gradient color, ranging from strong negative to strong positive correlation.
CorrelationTextColor(corr) : takes the correlation value as input and returns a text color that ensures optimal contrast over the background color.
Library
"Correlation_HeatMap_Matrix_Data_TradingFinder"
CorrelationColor(corr)
Parameters:
corr (float)
CorrelationTextColor(corr)
Parameters:
corr (float)
Data_Matrix(Corr_Period, Sym_1, Sym_2, Sym_3, Sym_4, Sym_5, Sym_6, Sym_7, Sym_8, Sym_9, Sym_10, Sym_11, Sym_12, Sym_13, Sym_14, Sym_15, Sym_16, Sym_17, Sym_18, Sym_19, Sym_20)
Parameters:
Corr_Period (int)
Sym_1 (string)
Sym_2 (string)
Sym_3 (string)
Sym_4 (string)
Sym_5 (string)
Sym_6 (string)
Sym_7 (string)
Sym_8 (string)
Sym_9 (string)
Sym_10 (string)
Sym_11 (string)
Sym_12 (string)
Sym_13 (string)
Sym_14 (string)
Sym_15 (string)
Sym_16 (string)
Sym_17 (string)
Sym_18 (string)
Sym_19 (string)
Sym_20 (string)
🔵 How to use
Import the library into your Pine Script using the import keyword and its full namespace.
Decide how many symbols you want to include in your correlation matrix (up to 20). Each symbol must be provided as a string, for example FX:EURUSD .
Choose the correlation period (Corr\_Period) in bars. This is the lookback window used for the calculation, such as 20, 50, or 100 bars.
Call Data_Matrix(Corr_Period, Sym_1, ..., Sym_20) with your selected parameters. The function will return an array containing the correlation values for every symbol pair (upper triangle of the matrix plus diagonal).
For example :
var string Sym_1 = '' , var string Sym_2 = '' , var string Sym_3 = '' , var string Sym_4 = '' , var string Sym_5 = '' , var string Sym_6 = '' , var string Sym_7 = '' , var string Sym_8 = '' , var string Sym_9 = '' , var string Sym_10 = ''
var string Sym_11 = '', var string Sym_12 = '', var string Sym_13 = '', var string Sym_14 = '', var string Sym_15 = '', var string Sym_16 = '', var string Sym_17 = '', var string Sym_18 = '', var string Sym_19 = '', var string Sym_20 = ''
switch Market
'Forex' => Sym_1 := 'EURUSD' , Sym_2 := 'GBPUSD' , Sym_3 := 'USDJPY' , Sym_4 := 'USDCHF' , Sym_5 := 'USDCAD' , Sym_6 := 'AUDUSD' , Sym_7 := 'NZDUSD' , Sym_8 := 'EURJPY' , Sym_9 := 'EURGBP' , Sym_10 := 'GBPJPY'
,Sym_11 := 'AUDJPY', Sym_12 := 'EURCHF', Sym_13 := 'EURCAD', Sym_14 := 'GBPCAD', Sym_15 := 'CADJPY', Sym_16 := 'CHFJPY', Sym_17 := 'NZDJPY', Sym_18 := 'AUDNZD', Sym_19 := 'USDSEK' , Sym_20 := 'USDNOK'
'Stock' => Sym_1 := 'NVDA' , Sym_2 := 'AAPL' , Sym_3 := 'GOOGL' , Sym_4 := 'GOOG' , Sym_5 := 'META' , Sym_6 := 'MSFT' , Sym_7 := 'AMZN' , Sym_8 := 'AVGO' , Sym_9 := 'TSLA' , Sym_10 := 'BRK.B'
,Sym_11 := 'UNH' , Sym_12 := 'V' , Sym_13 := 'JPM' , Sym_14 := 'WMT' , Sym_15 := 'LLY' , Sym_16 := 'ORCL', Sym_17 := 'HD' , Sym_18 := 'JNJ' , Sym_19 := 'MA' , Sym_20 := 'COST'
'Crypto' => Sym_1 := 'BTCUSD' , Sym_2 := 'ETHUSD' , Sym_3 := 'BNBUSD' , Sym_4 := 'XRPUSD' , Sym_5 := 'SOLUSD' , Sym_6 := 'ADAUSD' , Sym_7 := 'DOGEUSD' , Sym_8 := 'AVAXUSD' , Sym_9 := 'DOTUSD' , Sym_10 := 'TRXUSD'
,Sym_11 := 'LTCUSD' , Sym_12 := 'LINKUSD', Sym_13 := 'UNIUSD', Sym_14 := 'ATOMUSD', Sym_15 := 'ICPUSD', Sym_16 := 'ARBUSD', Sym_17 := 'APTUSD', Sym_18 := 'FILUSD', Sym_19 := 'OPUSD' , Sym_20 := 'USDT.D'
'Custom' => Sym_1 := Sym_1_C , Sym_2 := Sym_2_C , Sym_3 := Sym_3_C , Sym_4 := Sym_4_C , Sym_5 := Sym_5_C , Sym_6 := Sym_6_C , Sym_7 := Sym_7_C , Sym_8 := Sym_8_C , Sym_9 := Sym_9_C , Sym_10 := Sym_10_C
,Sym_11 := Sym_11_C, Sym_12 := Sym_12_C, Sym_13 := Sym_13_C, Sym_14 := Sym_14_C, Sym_15 := Sym_15_C, Sym_16 := Sym_16_C, Sym_17 := Sym_17_C, Sym_18 := Sym_18_C, Sym_19 := Sym_19_C , Sym_20 := Sym_20_C
= Corr.Data_Matrix(Corr_period, Sym_1 ,Sym_2 ,Sym_3 ,Sym_4 ,Sym_5 ,Sym_6 ,Sym_7 ,Sym_8 ,Sym_9 ,Sym_10,Sym_11,Sym_12,Sym_13,Sym_14,Sym_15,Sym_16,Sym_17,Sym_18,Sym_19,Sym_20)
Loop through or index into this array to retrieve each correlation value for your custom layout or logic.
Pass each correlation value to CorrelationColor() to get the corresponding gradient background color, which reflects the correlation’s strength and direction (negative to positive).
For example :
Corr.CorrelationColor(SYM_3_10)
Pass the same correlation value to CorrelationTextColor() to get the correct text color for readability against that background.
For example :
Corr.CorrelationTextColor(SYM_1_1)
Use these colors in a table or label to render your own heatmap or any other visualization you need.
Statistics

FunctionADFLibrary "FunctionADF"
Augmented Dickey-Fuller test (ADF), The ADF test is a statistical method used to assess whether a time series is stationary – meaning its statistical properties (like mean and variance) do not change over time. A time series with a unit root is considered non-stationary and often exhibits non-mean-reverting behavior, which is a key concept in technical analysis.
Reference:
-
- rtmath.net
- en.wikipedia.org
adftest(data, n_lag, conf)
: Augmented Dickey-Fuller test for stationarity.
Parameters:
data (array) : Data series.
n_lag (int) : Maximum lag.
conf (string) : Confidence Probability level used to test for critical value, (`90%`, `95%`, `99%`).
Returns: `adf` The test statistic. \
`crit` Critical value for the test statistic at the 10 % levels. \
`nobs` Number of observations used for the ADF regression and calculation of the critical values.


AnnualizedReturnCalculatorLibrary "AnnualizedReturnCalculator"
TODO: add library description here
calculateAnnualizedReturn(isStartTime, enableLog)
Parameters:
isStartTime (bool) : 开始时间的BOOL值变量(用于标记策略开始时间)
enableLog (bool) : 是否输出日志
Returns:
返回持仓基准年化收益率、资金基准年化收益率、总收益、平均资金占用

LiliALHUNTERSystem_v2📚 **Library: LiliALHUNTERSystem_v2**
This library provides a powerful target management system for Pine Script developers.
It includes advanced calculators for EMA, RMA, and Supertrend, and introduces a central `createTargets()` function to dynamically render target lines and labels based on long/short trade logic.
🛠️ **Main Features:**
– Dynamic horizontal & vertical target lines
– Dual target configuration (Target 1 & Target 2)
– Directional logic via `isLong1`, `isLong2`
– Integrated Supertrend validation
– Visual dashboard and label display
– Works seamlessly with custom indicators
🎯 **Purpose:**
The `LiliALHUNTERSystem_v2` Library enables Pine coders to manage and visualize targets consistently across all trading strategies and indicators. It simplifies target logic while maintaining visual clarity and modular usage.
⚠️ **Disclaimer:**
This script is intended for educational and analytical purposes only. It does not constitute financial advice.
Library "LiliALHUNTERSystem_v2"
ema_calc(len, source)
Parameters:
len (simple int)
source (float)
rma_calc(len, source)
Parameters:
len (simple int)
source (float)
supertrend_calc(length, factor)
Parameters:
length (simple int)
factor (float)
createTargets(config, state, source1A, source1B, source2A, source2B)
Parameters:
config (TargetConfig)
state (TargetState)
source1A (float)
source1B (float)
source2A (float)
source2B (float)
showDashboard(state, dashLoc, textSize)
Parameters:
state (TargetState)
dashLoc (string)
textSize (string)
TargetConfig
Fields:
enableTarget1 (series bool)
enableTarget2 (series bool)
isLong1 (series bool)
isLong2 (series bool)
target1Condition (series string)
target2Condition (series string)
target1Color (series color)
target2Color (series color)
target1Style (series string)
target2Style (series string)
distTarget1 (series float)
distTarget2 (series float)
distOptions1 (series string)
distOptions2 (series string)
showLabels (series bool)
showDash (series bool)
TargetState
Fields:
target1LineV (series line)
target1LineH (series line)
target2LineV (series line)
target2LineH (series line)
target1Lbl (series label)
target2Lbl (series label)
target1Active (series bool)
target2Active (series bool)
target1Value (series float)
target2Value (series float)
countTargets1 (series int)
countTgReached1 (series int)
countTargets2 (series int)
countTgReached2 (series int)

FastMetrixLibrary "FastMetrix"
This is a library I've been tweaking and working with for a while and I find it useful to get valuable technical analysis metrics faster (why its called FastMetrix). A lot of is personal to my trading style, so sorry if it does not have everything you want. The way I get my variables from library to script is by copying the return function into my new script.
TODO: Volatility and short term price analysis functions
slope(source, smoothing)
Parameters:
source (float)
smoothing (int)
integral(topfunction, bottomfunction, start, end)
Parameters:
topfunction (float)
bottomfunction (float)
start (int)
end (int)
deviation(x, y)
Parameters:
x (float)
y (float)
getema(len)
TODO: return important exponential long term moving averages and derivatives/variables
Parameters:
len (simple int)
getsma(len)
TODO: return requested sma
Parameters:
len (int)
kc(mult, len)
TODO: Return Keltner Channels variables and calculations
Parameters:
mult (simple float)
len (simple int)
bollinger(len, mult)
TODO: returns bollinger bands with optimal settings
Parameters:
len (int)
mult (simple float)
volatility(atrlen, smoothing)
TODO: Returns volatility indicators based on atr
Parameters:
atrlen (simple int)
smoothing (int)
premarketfib()
countinday(xcondition)
Parameters:
xcondition (bool)
countinsession(condition, n)
Parameters:
condition (bool)
n (int)
LMAsLibrary "LMAs"
Credits
Thank you to @QuantraSystems for dynamic calculations.
Introduction
This lightweight library offers dynamic implementations of popular moving averages that adapt their length automatically as new bars are added to the chart.
Each function is built on a dynamic length formula:
len = math.min(maxLength, bar_index + 1)
This approach ensures that calculations begin as early as the first bar, allowing for smoother initialization and more consistent behavior across all timeframes. It’s especially useful in custom scripts that run from bar 0 or when historical data is limited.
Usage
You can use this library as a drop-in replacement for standard moving averages. It provides more flexibility and stability in live or backtesting environments where fixed-length indicators may delay or fail to initialize properly.
Why Use This?
• Works from the very first bar
• Avoids na values during early bars
• Great for real-time indicators, strategies, and bar-replay
• Clean and efficient code with dynamic behavior
How to Use
Import the library into your script and call any of the included functions just like you would with their native counterparts.
Summary
A lightweight Pine Script™ library offering dynamic moving averages that work seamlessly from the very first bar. Ideal for strategies and indicators requiring robust initialization and adaptive behavior.
SMA(sourceData, maxLength)
Dynamic SMA
Parameters:
sourceData (float)
maxLength (int)
EMA(src, length)
Dynamic EMA
Parameters:
src (float)
length (int)
DEMA(src, length)
Dynamic DEMA
Parameters:
src (float)
length (int)
TEMA(src, length)
Dynamic TEMA
Parameters:
src (float)
length (int)
WMA(src, length)
Dynamic WMA
Parameters:
src (float)
length (int)
HMA(src, length)
Dynamic HMA
Parameters:
src (float)
length (int)
VWMA(src, volsrc, length)
Dynamic VWMA
Parameters:
src (float)
volsrc (float)
length (int)
SMMA(src, length)
Dynamic SMMA
Parameters:
src (float)
length (int)
LSMA(src, length, offset)
Dynamic LSMA
Parameters:
src (float)
length (int)
offset (int)
RMA(src, length)
Dynamic RMA
Parameters:
src (float)
length (int)
ALMA(src, length, offset_sigma, sigma)
Dynamic ALMA
Parameters:
src (float)
length (int)
offset_sigma (float)
sigma (float)
ZLSMA(src, length)
Dynamic ZLSMA
Parameters:
src (float)
length (int)
FRAMA(src, length)
Parameters:
src (float)
length (int)
KAMA(src, length)
Dynamic KAMA
Parameters:
src (float)
length (int)
JMA(src, length, phase)
Dynamic JMA
Parameters:
src (float)
length (int)
phase (float)
T3(src, length, volumeFactor)
Dynamic T3
Parameters:
src (float)
length (int)
volumeFactor (float)

TAIndicatorsThis library offers a comprehensive suite of enhanced technical indicator functions, building upon TradingView's built-in indicators. The primary advantage of this library is its expanded flexibility, allowing you to select from a wider range of moving average types for calculations and smoothing across various indicators.
The core difference between these functions and TradingView's standard ones is the ability to specify different moving average types beyond the default. While a standard ta.rsi() is fixed, the rsi() in this library, for example, can be smoothed by an 'SMMA (RMA)', 'WMA', 'VWMA', or others, giving you greater control over your analysis.
█ FEATURES
This library provides enhanced versions of the following popular indicators:
Moving Average (ma): A versatile MA function that includes optional secondary smoothing and Bollinger Bands.
RSI (rsi): Calculate RSI with an optional smoothed signal line using various MA types, plus built-in divergence detection.
MACD (macd): A MACD function where you can define the MA type for both the main calculation and the signal line.
ATR (atr): An ATR function that allows for different smoothing types.
VWAP (vwap): A comprehensive anchored VWAP with multiple configurable bands.
ADX (adx): A standard ADX calculation.
Cumulative Volume Delta (cvd): Provides CVD data based on a lower timeframe.
Bollinger Bands (bb): Create Bollinger Bands with a customizable MA type for the basis line.
Keltner Channels (kc): Keltner Channels with selectable MA types and band styles.
On-Balance Volume (obv): An OBV indicator with an optional smoothed signal line using various MA types.
... and more to come! This library will be actively maintained, with new useful indicator functions added over time.
█ HOW TO USE
To use this library in your scripts, import it using its publishing link. You can then call the functions directly.
For example, to calculate a Weighted Moving Average (WMA) and then smooth it with a Simple Moving Average (SMA) :
import ActiveQuants/TAIndicators/1 as tai
// Calculate a 20-period WMA of the close
// Then, smooth the result with a 10-period SMA
= tai.ma("WMA", close, 20, "SMA", 10)
plot(myWma, color = color.blue)
plot(smoothedWma, color = color.orange)
█ Why Choose This Library?
If you're looking for more control and customization than what's offered by the standard built-in functions, this library is for you. By allowing for a variety of smoothing methods across multiple indicators, it enables a more nuanced and personalized approach to technical analysis. Fine-tune your indicators to better fit your trading style and strategies.

StatMetricsLibrary "StatMetrics"
A utility library for common statistical indicators and ratios used in technical analysis.
Includes Z-Score, correlation, PLF, SRI, Sharpe, Sortino, Omega ratios, and normalization tools.
zscore(src, len)
Calculates the Z-score of a series
Parameters:
src (float) : The input price or series (e.g., close)
len (simple int) : The lookback period for mean and standard deviation
Returns: Z-score: number of standard deviations the input is from the mean
corr(x, y, len)
Computes Pearson correlation coefficient between two series
Parameters:
x (float) : First series
y (float) : Second series
len (simple int) : Lookback period
Returns: Correlation coefficient between -1 and 1
plf(src, longLen, shortLen, smoothLen)
Calculates the Price Lag Factor (PLF) as the difference between long and short Z-scores, normalized and smoothed
Parameters:
src (float) : Source series (e.g., close)
longLen (simple int) : Long Z-score period
shortLen (simple int) : Short Z-score period
smoothLen (simple int) : Hull MA smoothing length
Returns: Smoothed and normalized PLF oscillator
sri(signal, len)
Computes the Statistical Reliability Index (SRI) based on trend persistence
Parameters:
signal (float) : A price or signal series (e.g., smoothed PLF)
len (simple int) : Lookback period for smoothing and deviation
Returns: Normalized trend reliability score
sharpe(src, len)
Calculates the Sharpe Ratio over a period
Parameters:
src (float) : Price series (e.g., close)
len (simple int) : Lookback period
Returns: Sharpe ratio value
sortino(src, len)
Calculates the Sortino Ratio over a period, using only downside volatility
Parameters:
src (float) : Price series
len (simple int) : Lookback period
Returns: Sortino ratio value
omega(src, len)
Calculates the Omega Ratio as the ratio of upside to downside return area
Parameters:
src (float) : Price series
len (simple int) : Lookback period
Returns: Omega ratio value
beta(asset, benchmark, len)
Calculates beta coefficient of asset vs benchmark using rolling covariance
Parameters:
asset (float) : Series of the asset (e.g., close)
benchmark (float) : Series of the benchmark (e.g., SPX close)
len (simple int) : Lookback window
Returns: Beta value (slope of linear regression)
alpha(asset, benchmark, len)
Calculates rolling alpha of an asset relative to a benchmark
Parameters:
asset (float) : Series of the asset (e.g., close)
benchmark (float) : Series of the benchmark (e.g., SPX close)
len (simple int) : Lookback window
Returns: Alpha value (excess return not explained by Beta exposure)
skew(x, len)
Computes skewness of a return series
Parameters:
x (float) : Input series (e.g., returns)
len (simple int) : Lookback period
Returns: Skewness value
kurtosis(x, len)
Computes kurtosis of a return series
Parameters:
x (float) : Input series (e.g., returns)
len (simple int) : Lookback period
Returns: Kurtosis value
cv(x, len)
Calculates Coefficient of Variation
Parameters:
x (float) : Input series (e.g., returns or prices)
len (simple int) : Lookback period
Returns: CV value
autocorr(x, len)
Calculates autocorrelation with 1-lag
Parameters:
x (float) : Series to test
len (simple int) : Lookback window
Returns: Autocorrelation at lag 1
stderr(x, len)
Calculates rolling standard error of a series
Parameters:
x (float) : Input series
len (simple int) : Lookback window
Returns: Standard error (std dev / sqrt(n))
info_ratio(asset, benchmark, len)
Calculates the Information Ratio
Parameters:
asset (float) : Asset price series
benchmark (float) : Benchmark price series
len (simple int) : Lookback period
Returns: Information ratio (alpha / tracking error)
tracking_error(asset, benchmark, len)
Measures deviation from benchmark (Tracking Error)
Parameters:
asset (float) : Asset return series
benchmark (float) : Benchmark return series
len (simple int) : Lookback window
Returns: Tracking error value
max_drawdown(x, len)
Computes maximum drawdown over a rolling window
Parameters:
x (float) : Price series
len (simple int) : Lookback window
Returns: Rolling max drawdown percentage (as a negative value)
zscore_signal(z, ob, os)
Converts Z-score into a 3-level signal
Parameters:
z (float) : Z-score series
ob (float) : Overbought threshold
os (float) : Oversold threshold
Returns: -1, 0, or 1 depending on signal state
r_squared(x, y, len)
Calculates rolling R-squared (coefficient of determination)
Parameters:
x (float) : Asset returns
y (float) : Benchmark returns
len (simple int) : Lookback window
Returns: R-squared value (0 to 1)
entropy(x, len)
Approximates Shannon entropy using log returns
Parameters:
x (float) : Price series
len (simple int) : Lookback period
Returns: Approximate entropy
zreversal(z)
Detects Z-score reversals to the mean
Parameters:
z (float) : Z-score series
Returns: +1 on upward reversal, -1 on downward
momentum_rank(x, len)
Calculates relative momentum strength
Parameters:
x (float) : Price series
len (simple int) : Lookback window
Returns: Proportion of lookback where current price is higher
normalize(x, len)
Normalizes a series to a 0–1 range over a period
Parameters:
x (float) : The input series
len (simple int) : Lookback period
Returns: Normalized value between 0 and 1
composite_score(score1, score2, score3)
Combines multiple normalized scores into a composite score
Parameters:
score1 (float)
score2 (float)
score3 (float)
Returns: Average composite score

MonthlyPnLTableLibrary "MonthlyPnLTable"
monthlyPnL(currentClose, initialOpenPrice, monthsToDisplay)
Parameters:
currentClose (float)
initialOpenPrice (float)
monthsToDisplay (int)
displayPnLTable(pnls, pnlMonths, pnlYears, textSizeOption, labelColor)
Parameters:
pnls (array)
pnlMonths (array)
pnlYears (array)
textSizeOption (string)
labelColor (color)

Crypto_in_details_MAlibCrypto_in_details_MaLib — Advanced Moving Average Library for Pine Script
Overview:
Crypto_in_details_MaLib is a comprehensive, performance-optimized Moving Average (MA) library designed specifically for Pine Script v6 users seeking advanced technical analysis tools. Developed by Crypto_in_details, this library consolidates the most popular and sophisticated MA calculation methods — including classical, weighted, exponential, and Hull variants — into one seamless package.
Key Features:
Implements a wide range of Moving Averages: SMA, EMA, WMA, RMA, VWMA, HMA, TEMA, EHMA, THMA.
Designed for precision and flexibility — suitable for diverse trading strategies and indicator development.
Fully typed functions compatible with Pine Script v6 standards.
Simplifies your scripting workflow by providing ready-to-use MA functions via clean and easy-to-import methods.
Well-documented and maintained by an experienced Pine Script developer.
Why Use Crypto_in_details_MaLib?
Gain access to advanced MA calculations that enhance trend analysis, smoothing, and signal accuracy.
Save time on coding complex moving averages from scratch.
Easily extend or combine with your own strategies or indicators for improved performance.
Rely on a tested and community-driven solution backed by a prolific Pine Script author.
Ideal for:
Traders and developers building custom indicators or strategies requiring versatile MA techniques.
Anyone looking to improve their Pine Script efficiency and code maintainability.
Pine Script enthusiasts wanting a professional-grade MA toolkit.

VolumeFlowOscillatorLibVolume Flow Oscillator Library
Overview
The Volume Flow Oscillator library provides a comprehensive framework for analyzing directional volume flow in financial markets. It creates a multi-band oscillator system that transforms price and volume data into a spectrum of sensitivity bands, revealing the underlying buying and selling pressure.
Technical Approach
The library combines price direction with trading volume to generate an oscillator that fluctuates around a zero line, with positive values indicating buying pressure and negative values showing selling pressure. Using sophisticated ALMA (Arnaud Legoux Moving Average) smoothing techniques with asymmetric sensitivity, the library creates seven distinct bands that help identify various intensity levels of volume flow.
Key Features
Multi-band oscillator system with seven sensitivity levels
Directional volume flow analysis combining price movement and volume
Zero-line oscillation showing the balance between buying and selling pressure
Asymmetric ALMA smoothing for different sensitivity on positive/negative bands
Customizable lookback periods and multipliers for fine-tuning
Color-coded visualization for intuitive chart reading
Applications
This library offers developers a versatile foundation for creating volume-based indicators that go beyond simple volume measurement to reveal the directional force behind market movements. Ideal for confirming price trends, detecting divergences, identifying volume climaxes, and assessing overall market strength.

TradeTrackerLibrary "TradeTracker"
Simple Library for tracking trades
method track(this)
tracks trade when called on every bar
Namespace types: Trade
Parameters:
this (Trade) : Trade object
Returns: current Trade object
Trade
Has the constituents to track trades generated by any method.
Fields:
id (series int)
direction (series int) : Trade direction. Positive values for long and negative values for short trades
initialEntry (series float) : Initial entry price. This value will not change even if the entry is changed in the lifecycle of the trade
entry (series float) : Updated entry price. Allows variations to initial calculated entry. Useful in cases of trailing entry.
initialStop (series float) : Initial stop. Similar to initial entry, this is the first calculated stop for the lifecycle of trade.
stop (series float) : Trailing Stop. If there is no trailing, the value will be same as that of initial trade
targets (array) : array of target values.
startBar (series int) : bar index of starting bar. Set by default when object is created. No need to alter this after that.
endBar (series int) : bar index of last bar in trade. Set by tracker on each execution
startTime (series int) : time of the start bar. Set by default when object is created. No need to alter this after that.
endTime (series int) : time of the ending bar. Updated by tracking method.
status (series int) : Integer parameter to track the status of the trade
retest (series bool) : Boolean parameter to notify if there was retest of the entry price
tafirstlibGeneral Purpose: Starts by stating it's a collection of utility functions for technical analysis.
Core Functionality Areas: Mentions key categories like:
Extrema detection (isMin, isMax, etc.)
Condition checking over time (isMachedInRange, isContinuous, etc.)
Rate of change analysis (isSlowDown)
Moving average calculation (getMA)
Advanced Features: Highlights the more complex functions:
Visualization helpers (getColorNew)
Moving Regression (mr) for smoothing/trend
Cycle analysis (bpDom)
Overall Goal: Concludes by stating the library's aim – simplifying development and enabling complex analysis.
Library "tafirstlib"
TODO: add library description here
isSlowDown(data)
isSlowDown
Parameters:
data (float) : array of numbers
Returns: boolean
isMin(data, maeLength)
isMin
Parameters:
data (float) : array of numbers
maeLength (int) : number
Returns: boolean
isMax(data, maeLength)
isMax
Parameters:
data (float) : array of numbers
maeLength (int) : number
Returns: boolean
isMinStopped(data, maeLength)
isMinStopped
Parameters:
data (float) : array of numbers
maeLength (int) : number
Returns: boolean
isMaxStopped(data, maeLength)
isMaxStopped
Parameters:
data (float) : array of numbers
maeLength (int) : number
Returns: boolean
isLongMinStopped(data, maeLength, distance)
isLongMinStopped
Parameters:
data (float) : array of numbers
maeLength (int) : number
distance (int) : number
Returns: boolean
isLongMaxStopped(data, maeLength, distance)
isLongMaxStopped
Parameters:
data (float) : array of numbers
maeLength (int) : number
distance (int) : number
Returns: boolean
isMachedInRangeSkipCurrent(data, findRange, findValue)
isMachedInRangeSkipCurrent
Parameters:
data (bool) : array of numbers
findRange (int) : number
findValue (bool) : number
Returns: boolean
isMachedInRange(data, findRange, findValue)
isMachedInRange
Parameters:
data (bool) : array of numbers
findRange (int) : number
findValue (bool) : number
Returns: boolean
isMachedColorInRange(data, findRange, findValue)
isMachedColorInRange isMachedColorInRange(series color data, int findRange, color findValue)
Parameters:
data (color) : series of color
findRange (int) : int
findValue (color) : color
Returns: boolean
countMachedInRange(data, findRange, findValue)
countMachedInRange
Parameters:
data (bool) : array of numbers
findRange (int) : number
findValue (bool) : number
Returns: number
getColor(data)
getColor
Parameters:
data (float) : array of numbers
Returns: color
getColorNew(data)
getColorNew
Parameters:
data (float) : array of numbers
Returns: color
isColorBetter(color_data)
isColorBetter
Parameters:
color_data (color) : array of colors
Returns: boolean
isColorWorst(color_data)
isColorWorst
Parameters:
color_data (color) : array of colors
Returns: boolean
isColorBetter2(color_data)
isColorBetter2
Parameters:
color_data (color) : array of colors
Returns: boolean
isColorWorst2(color_data)
isColorWorst2
Parameters:
color_data (color) : array of colors
Returns: boolean
isDecreased2Bar(data)
isDecreased2Bar
Parameters:
data (float) : array of numbers
Returns: boolean
isContinuousAdvance(targetSeries, range2Find, howManyException)
isContinuousAdvance
Parameters:
targetSeries (bool) : array of booleans
range2Find (int) : number
howManyException (int) : number
Returns: boolean
isContinuous(targetSeries, range2Find, truefalse)
isContinuous
Parameters:
targetSeries (bool) : array of booleans
range2Find (int) : number
truefalse (bool) : boolean
Returns: boolean
isContinuousNotNow(targetSeries, range2Find, truefalse)
isContinuousNotNow
Parameters:
targetSeries (bool) : array of booleans
range2Find (int) : number
truefalse (bool) : boolean
Returns: boolean
isContinuousTwoFactors(targetSeries, range2Find, truefalse)
isContinuousTwoFactors
Parameters:
targetSeries (bool) : array of booleans
range2Find (int) : number
truefalse (bool) : boolean
Returns: boolean
findEventInRange(startDataBarIndex, neededDataBarIndex, currentBarIndex)
findEventInRange
Parameters:
startDataBarIndex (int) : number
neededDataBarIndex (int) : number
currentBarIndex (int) : number
Returns: boolean
findMin(firstdata, secondata, thirddata, forthdata)
findMin
Parameters:
firstdata (float) : number
secondata (float) : number
thirddata (float) : number
forthdata (float) : number
Returns: number
findMax(firstdata, secondata, thirddata, forthdata)
findMax
Parameters:
firstdata (float) : number
secondata (float) : number
thirddata (float) : number
forthdata (float) : number
Returns: number
getMA(src, length, mav)
getMA
Parameters:
src (float) : number
length (simple int) : number
mav (string) : string
Returns: number
mr(mrb_src, mrb_window, mrb_degree)
Parameters:
mrb_src (float)
mrb_window (int)
mrb_degree (int)
bpDom(maeLength, bpw, mult)
Parameters:
maeLength (int)
bpw (float)
mult (float)

FunctionSurvivalEstimationLibrary "FunctionSurvivalEstimation"
The Survival Estimation function, also known as Kaplan-Meier estimation or product-limit method, is a statistical technique used to estimate the survival probability of an individual over time. It's commonly used in medical research and epidemiology to analyze the survival rates of patients with different treatments, diseases, or risk factors.
What does it do?
The Survival Estimation function takes into account censored observations (i.e., individuals who are still alive at a certain point) and calculates the probability that an individual will survive beyond a specific time period. It's particularly useful when dealing with right-censoring, where some subjects are lost to follow-up or have not experienced the event of interest by the end of the study.
Interpretation
The Survival Estimation function provides a plot of the estimated survival probability over time, which can be used to:
1. Compare survival rates between different groups (e.g., treatment arms)
2. Identify patterns in the data that may indicate differences in mortality or disease progression
3. Make predictions about future outcomes based on historical data
4. In a trading context it may be used to ascertain the survival ratios of trading under specific conditions.
Reference:
www.global-developments.org
"Beyond GDP" ~ www.aeaweb.org
en.wikipedia.org
www.kdnuggets.com
survival_probability(alive_at_age, initial_alive)
Kaplan-Meier Survival Estimator.
Parameters:
alive_at_age (int) : The number of subjects still alive at a age.
initial_alive (int) : The Total number of initial subjects.
Returns: The probability that a subject lives longer than a certain age.
utility(c, l)
Captures the utility value from consumption and leisure.
Parameters:
c (float) : Consumption.
l (float) : Leisure.
Returns: Utility value from consumption and leisure.
welfare_utility(age, b, u, s)
Calculate the welfare utility value based age, basic needs and social interaction.
Parameters:
age (int) : Age of the subject.
b (float) : Value representing basic needs (food, shelter..).
u (float) : Value representing overall well-being and happiness.
s (float) : Value representing social interaction and connection with others.
Returns: Welfare utility value.
expected_lifetime_welfare(beta, consumption, leisure, alive_data, expectation)
Calculates the expected lifetime welfare of an individual based on their consumption, leisure, and survival probability over time.
Parameters:
beta (float) : Discount factor.
consumption (array) : List of consumption values at each step of the subjects life.
leisure (array) : List of leisure values at each step of the subjects life.
alive_data (array) : List of subjects alive at each age, the first element is the total or initial number of subjects.
expectation (float) : Optional, `defaut=1.0`. Expectation or weight given to this calculation.
Returns: Expected lifetime welfare value.

NR_VersatilitiesLibrary "NR_Versatilities"
Versatilities (aka, Versatile Utilities) includes:
- Seventeen Price Variants returned as a tuple,
- Eight Smoothing functions rolled into one,
- Pick any Past Value from any series with offset,
- Or just the previous value from any series.
pastVal(src, len)
Fetches past value from src that came len distance ago
Parameters:
src (float) : source series
len (int) : lookback distance - (optional) default is 1
Returns: latest src if len <= 0, else src
previous(src)
Fetches past value from src that came len distance ago
Parameters:
src (float) : source series
Returns: previous value in the series if found, else current value
price_variants()
Computes Several different averages using current and previous OHLC values
Returns: Seventeen Uncommon Average Price Combinations
dynamic_MA(matyp, masrc, malen, lsmaoff, almasgm, almaoff, almaflr)
Dynamically computes Eight different MAs on-demand individually, or an average of all taken together
Parameters:
matyp (string) : pick one of these MAs - ALMA, EMA, HMA, LSMA, RMA, SMA, SWMA, WMA, ALL
masrc (float) : source series to compute MA
malen (simple int) : lookback distance for MA
lsmaoff (simple int) : optional LSMA offset - default is 0
almasgm (simple float) : optional ALMA sigma - default is 5
almaoff (simple float) : optional ALMA offset - default is 0.5
almaflr (simple bool) : optional ALMA floor flag - default is false
Returns: MA series for chosen type or, an average of all of them, if chosen so

HarmonicMapLibLibrary "HarmonicMapLib"
Harmonic Pattern Library implementation utilising maps
method tostring(this)
convert Range value to string
Namespace types: Range
Parameters:
this (Range) : Range value
Returns: converted string representation
method tostring(this)
convert array of Range value to string
Namespace types: array
Parameters:
this (array) : array object
Returns: converted string representation
method tostring(this)
convert map of string to Range value to string
Namespace types: map
Parameters:
this (map) : map object
Returns: converted string representation
method tostring(this)
convert RatioMap to string
Namespace types: RatioMap
Parameters:
this (RatioMap) : RatioMap object
Returns: converted string representation
method tostring(this)
convert array of RatioMap to string
Namespace types: array
Parameters:
this (array) : array object
Returns: converted string representation
method tostring(this)
convert map of string to RatioMap to string
Namespace types: map
Parameters:
this (map) : map object
Returns: converted string representation
method tostring(this)
convert map of string to bool to string
Namespace types: map
Parameters:
this (map) : map object
Returns: converted string representation
method tostring(this)
convert PrzRange to string
Namespace types: PrzRange
Parameters:
this (PrzRange) : PrzRange object
Returns: converted string representation
method tostring(this)
convert array of PrzRange to string
Namespace types: array
Parameters:
this (array) : array object
Returns: converted string representation
getHarmonicMap()
Creates the RatioMap for harmonic patterns
Returns: map haronic ratio rules for all patterns
method evaluate(patternsMap, pattern, ratioRange, properties, ratioValue)
evaluates harmonic ratio range
Namespace types: map
Parameters:
patternsMap (map) : parameter containing valid pattern names
pattern (string) : Pattern type to be evaluated
ratioRange (Range) : ratio range to be checked
properties (ScanProperties) : Scan Properties
ratioValue (float)
Returns: void
method evaluate(przRange, pattern, ratioRange, priceRange, properties)
Evaluate PRZ ranges
Namespace types: map
Parameters:
przRange (map)
pattern (string) : Pattern name
ratioRange (Range) : Range of ratio for the pattern
priceRange (Range) : Price range based on ratio
properties (ScanProperties) : ScanProperties object
Returns: void
method scanRatio(currentPatterns, rules, properties, ratioName, ratioValue)
Scan for particular named ratio of harmonic pattern to filter valid patterns
Namespace types: map
Parameters:
currentPatterns (map) : Current valid patterns map
rules (map) : map Harmonic ratio rules
properties (ScanProperties) : ScanProperties object
ratioName (string) : Specific ratio name
ratioValue (float) : ratio value to be checked
Returns: updated currentPatterns object
method scanPatterns(patterns, x, a, b, c, d, properties)
Scan for patterns based on X, A, B, C, D values
Namespace types: map
Parameters:
patterns (map) : List of allowed patterns
x (float) : X coordinate
a (float) : A coordinate
b (float) : B coordinate
c (float) : C coordinate
d (float) : D coordinate
properties (ScanProperties) : ScanProperties object. If na, default values are initialised
Returns: updated valid patterns map
method scanProjections(patterns, x, a, b, c, properties)
Scan for projections based on X, A, B, C values
Namespace types: map
Parameters:
patterns (map) : List of allowed patterns
x (float) : X coordinate
a (float) : A coordinate
b (float) : B coordinate
c (float) : C coordinate
properties (ScanProperties) : ScanProperties object. If na, default values are initialised
Returns: updated valid projections map
method merge(this, other)
merge two ranges into one
Namespace types: Range
Parameters:
this (Range) : first range
other (Range) : second range
Returns: combined range
method union(this, other)
union of two ranges into one
Namespace types: Range
Parameters:
this (Range) : first range
other (Range) : second range
Returns: union range
method overlaps(this, other)
checks if two ranges intersect
Namespace types: Range
Parameters:
this (Range) : first range
other (Range) : second range
Returns: true if intersects, false otherwise
method consolidate(this)
Consolidate ranges into PRZ
Namespace types: map
Parameters:
this (map) : map of Ranges
Returns: consolidated PRZ
method consolidateMany(this)
Consolidate ranges into multiple PRZ ranges
Namespace types: map
Parameters:
this (map) : map of Ranges
Returns: consolidated array of PRZ ranges
method getRange(currentPatterns, x, a, b, c, properties)
Get D range based on X, A, B, C coordinates for the current patterns
Namespace types: map
Parameters:
currentPatterns (map) : List of valid patterns
x (float) : X coordinate
a (float) : A coordinate
b (float) : B coordinate
c (float) : C coordinate
properties (ScanProperties) : ScanProperties object. If na, default values are initialised
Returns: map of D ranges
method getPrzRange(currentPatterns, x, a, b, c, properties)
Get PRZ range based on X, A, B, C coordinates for the current patterns
Namespace types: map
Parameters:
currentPatterns (map) : List of valid patterns
x (float) : X coordinate
a (float) : A coordinate
b (float) : B coordinate
c (float) : C coordinate
properties (ScanProperties) : ScanProperties object. If na, default values are initialised
Returns: PRZRange for the pattern
method getProjectionRanges(currentPatterns, x, a, b, c, properties)
Get projection range based on X, A, B, C coordinates for the current patterns
Namespace types: map
Parameters:
currentPatterns (map) : List of valid patterns
x (float) : X coordinate
a (float) : A coordinate
b (float) : B coordinate
c (float) : C coordinate
properties (ScanProperties) : ScanProperties object. If na, default values are initialised
Returns: array of projection ranges
Range
Collection of range values
Fields:
values (array) : array of float values
RatioMap
ratio map for pattern
Fields:
ratioMap (map) : map of string to Range (array of float)
ScanProperties
Pattern Scanning properties
Fields:
strictMode (series bool) : strict scanning mode will check for overflows
logScale (series bool) : scan ratios in log scale
errorMin (series float) : min error threshold
errorMax (series float)
mintick (series float) : minimum tick value of price
PrzRange
Potential reversal zone range
Fields:
patterns (array) : array of pattern names for the given XABCD combination
prz (Range) : PRZ range
TrendLibrary "Trend"
calculateSlopeTrend(source, length, thresholdMultiplier)
Parameters:
source (float)
length (int)
thresholdMultiplier (float)
Purpose:
The primary goal of this function is to determine the short-term trend direction of a given data series (like closing prices). It does this by calculating the slope of the data over a specified period and then comparing that slope against a dynamic threshold based on the data's recent volatility. It classifies the trend into one of three states: Upward, Downward, or Flat.
Parameters:
`source` (Type: `series float`): This is the input data series you want to analyze. It expects a series of floating-point numbers, typically price data like `close`, `open`, `hl2` (high+low)/2, etc.
`length` (Type: `int`): This integer defines the lookback period. The function will analyze the `source` data over the last `length` bars to calculate the slope and standard deviation.
`thresholdMultiplier` (Type: `float`, Default: `0.1`): This is a sensitivity factor. It's multiplied by the standard deviation to determine how steep the slope needs to be before it's considered a true upward or downward trend. A smaller value makes it more sensitive (detects trends earlier, potentially more false signals), while a larger value makes it less sensitive (requires a stronger move to confirm a trend).
Calculation Steps:
Linear Regression: It first calculates the value of a linear regression line fitted to the `source` data over the specified `length` (`ta.linreg(source, length, 0)`). Linear regression finds the "best fit" straight line through the data points.
Slope Calculation: It then determines the slope of this linear regression line. Since `ta.linreg` gives the *value* of the line on the current bar, the slope is calculated as the difference between the current bar's linear regression value (`linRegValue`) and the previous bar's value (`linRegValue `). A positive difference means an upward slope, negative means downward.
Volatility Measurement: It calculates the standard deviation (`ta.stdev(source, length)`) of the `source` data over the same `length`. Standard deviation is a measure of how spread out the data is, essentially quantifying its recent volatility.
Adaptive Threshold: An adaptive threshold (`threshold`) is calculated by multiplying the standard deviation (`stdDev`) by the `thresholdMultiplier`. This is crucial because it means the definition of a "flat" trend adapts to the market's volatility. In volatile times, the threshold will be wider, requiring a larger slope to signal a trend. In quiet times, the threshold will be narrower.
Trend Determination: Finally, it compares the calculated `slope` to the adaptive `threshold`:
If the `slope` is greater than the positive `threshold`, the trend is considered **Upward**, and the function returns `1`.
If the `slope` is less than the negative `threshold` (`-threshold`), the trend is considered **Downward**, and the function returns `-1`.
If the `slope` falls between `-threshold` and `+threshold` (inclusive of 0), the trend is considered **Flat**, and the function returns `0`.
Return Value:
The function returns an integer representing the determined trend direction:
`1`: Upward trend
`-1`: Downward trend
`0`: Flat trend
In essence, this library function provides a way to gauge trend direction using linear regression, but with a smart filter (the adaptive threshold) to avoid classifying minor noise or low-volatility periods as significant trends.
rate_of_changeLibrary "rate_of_change"
// @description: Applies ROC algorithm to any pair of values.
// This library function is used to scale change of value (price, volume) to a percentage value, just as the ROC indicator would do. It is good practice to scale arbitrary ranges to set boundaries when you try to train statistical model.
rateOfChange(value, base, hardlimit)
This function is a helper to scale a value change to its percentage value.
Parameters:
value (float)
base (float)
hardlimit (int)
Returns: per: A float comprised between 0 and 100

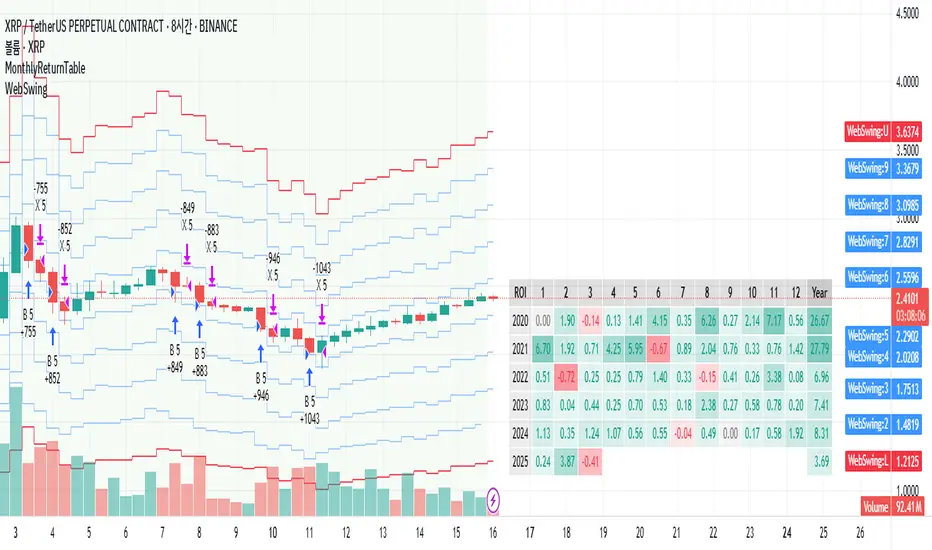
MonthlyReturnTableLibrary "MonthlyReturnTable"
TODO: The table displays monthly returns, profits, MDD, and number of trades.
get_table(mode, tablePosition, precision, textSize, marginTop, marginBottom, marginLeft, marginRight, colorHead, colorBull, colorBear, colorZero)
: get_table
Parameters:
mode (string)
tablePosition (string)
precision (int)
textSize (int)
marginTop (int)
marginBottom (int)
marginLeft (int)
marginRight (int)
colorHead (color)
colorBull (color)
colorBear (color)
colorZero (color)
Returns: : null, plot perfTable
DynamicMALibrary "DynamicMA"
Dynamic Moving Averages Library
Introduction
The Dynamic Moving Averages Library is a specialized collection of custom built functions designed to calculate moving averages dynamically, beginning from the first available bar. Unlike standard moving averages, which rely on fixed length lookbacks, this library ensures that indicators remain fully functional from the very first data point, making it an essential tool for analysing assets with short time series or limited historical data.
This approach allows traders and developers to build robust indicators that do not require a preset amount of historical data before generating meaningful outputs. It is particularly advantageous for:
Newly listed assets with minimal price history.
High-timeframe trading, where large lookback periods can lead to delayed or missing data.
By eliminating the constraints of fixed lookback periods, this library enables the seamless construction of trend indicators, smoothing functions, and hybrid models that adapt instantly to market conditions.
Comprehensive Set of Custom Moving Averages
The library includes a wide range of custom dynamic moving averages, each designed for specific analytical use cases:
SMA (Simple Moving Average) – The fundamental moving average, dynamically computed.
EMA (Exponential Moving Average) – Adaptive smoothing for better trend tracking.
DEMA (Double Exponential Moving Average) – Faster trend detection with reduced lag.
TEMA (Triple Exponential Moving Average) – Even more responsive than DEMA.
WMA (Weighted Moving Average) – Emphasizes recent price action while reducing noise.
VWMA (Volume Weighted Moving Average) – Accounts for volume to give more weight to high-volume periods.
HMA (Hull Moving Average) – A superior smoothing method with low lag.
SMMA (Smoothed Moving Average) – A hybrid approach between SMA and EMA.
LSMA (Least Squares Moving Average) – Uses linear regression for trend detection.
RMA (Relative Moving Average) – Used in RSI-based calculations for smooth momentum readings.
ALMA (Arnaud Legoux Moving Average) – A Gaussian-weighted MA for superior signal clarity.
Hyperbolic MA (HyperMA) – A mathematically optimized averaging method with dynamic weighting.
Each function dynamically adjusts its calculation length to match the available bar count, ensuring instant functionality on all assets.
Fully Optimized for Pine Script v6
This library is built on Pine Script v6, ensuring compatibility with modern TradingView indicators and scripts. It includes exportable functions for seamless integration into custom indicators, making it easy to develop trend-following models, volatility filters, and adaptive risk-management systems.
Why Use Dynamic Moving Averages?
Traditional moving averages suffer from a common limitation: they require a fixed historical window to generate meaningful values. This poses several problems:
New Assets Have No Historical Data - If an asset has only been trading for a short period, traditional moving averages may not be able to generate valid signals.
High Timeframes Require Massive Lookbacks - On 1W or 1M charts, a 200-period SMA would require 200 weeks or months of data, making it unusable on newer assets.
Delayed Signal Initialization - Standard indicators often take dozens of bars to stabilize, reducing effectiveness when trading new trends.
The Dynamic Moving Averages Library eliminates these issues by ensuring that every function:
Starts calculation from bar one, using available data instead of waiting for a lookback period.
Adapts dynamically across timeframes, making it equally effective on low or high timeframes.
Allows smoother, more responsive trend tracking, particularly useful for volatile or low-liquidity assets.
This flexibility makes it indispensable for custom script developers, quantitative analysts, and discretionary traders looking to build more adaptive and resilient indicators.
Final Summary
The Dynamic Moving Averages Library is a versatile and powerful set of functions designed to overcome the limitations of fixed-lookback indicators. By dynamically adjusting the calculation length from the first bar, this library ensures that moving averages remain fully functional across all timeframes and asset types, making it an essential tool for traders and developers alike.
With built-in adaptability, low-lag smoothing, and support for multiple moving average types, this library unlocks new possibilities for quantitative trading and strategy development - especially for assets with short price histories or those traded on higher timeframes.
For traders looking to enhance signal reliability, minimize lag, and build adaptable trading systems, the Dynamic Moving Averages Library provides an efficient and flexible solution.
SMA(sourceData, maxLength)
Dynamic SMA
Parameters:
sourceData (float)
maxLength (int)
EMA(src, length)
Dynamic EMA
Parameters:
src (float)
length (int)
DEMA(src, length)
Dynamic DEMA
Parameters:
src (float)
length (int)
TEMA(src, length)
Dynamic TEMA
Parameters:
src (float)
length (int)
WMA(src, length)
Dynamic WMA
Parameters:
src (float)
length (int)
HMA(src, length)
Dynamic HMA
Parameters:
src (float)
length (int)
VWMA(src, volsrc, length)
Dynamic VWMA
Parameters:
src (float)
volsrc (float)
length (int)
SMMA(src, length)
Dynamic SMMA
Parameters:
src (float)
length (int)
LSMA(src, length, offset)
Dynamic LSMA
Parameters:
src (float)
length (int)
offset (int)
RMA(src, length)
Dynamic RMA
Parameters:
src (float)
length (int)
ALMA(src, length, offset_sigma, sigma)
Dynamic ALMA
Parameters:
src (float)
length (int)
offset_sigma (float)
sigma (float)
HyperMA(src, length)
Dynamic HyperbolicMA
Parameters:
src (float)
length (int)

ValueAtTime█ OVERVIEW
This library is a Pine Script® programming tool for accessing historical values in a time series using UNIX timestamps . Its data structure and functions index values by time, allowing scripts to retrieve past values based on absolute timestamps or relative time offsets instead of relying on bar index offsets.
█ CONCEPTS
UNIX timestamps
In Pine Script®, a UNIX timestamp is an integer representing the number of milliseconds elapsed since January 1, 1970, at 00:00:00 UTC (the UNIX Epoch ). The timestamp is a unique, absolute representation of a specific point in time. Unlike a calendar date and time, a UNIX timestamp's meaning does not change relative to any time zone .
This library's functions process series values and corresponding UNIX timestamps in pairs , offering a simplified way to identify values that occur at or near distinct points in time instead of on specific bars.
Storing and retrieving time-value pairs
This library's `Data` type defines the structure for collecting time and value information in pairs. Objects of the `Data` type contain the following two fields:
• `times` – An array of "int" UNIX timestamps for each recorded value.
• `values` – An array of "float" values for each saved timestamp.
Each index in both arrays refers to a specific time-value pair. For instance, the `times` and `values` elements at index 0 represent the first saved timestamp and corresponding value. The library functions that maintain `Data` objects queue up to one time-value pair per bar into the object's arrays, where the saved timestamp represents the bar's opening time .
Because the `times` array contains a distinct UNIX timestamp for each item in the `values` array, it serves as a custom mapping for retrieving saved values. All the library functions that return information from a `Data` object use this simple two-step process to identify a value based on time:
1. Perform a binary search on the `times` array to find the earliest saved timestamp closest to the specified time or offset and get the element's index.
2. Access the element from the `values` array at the retrieved index, returning the stored value corresponding to the found timestamp.
Value search methods
There are several techniques programmers can use to identify historical values from corresponding timestamps. This library's functions include three different search methods to locate and retrieve values based on absolute times or relative time offsets:
Timestamp search
Find the value with the earliest saved timestamp closest to a specified timestamp.
Millisecond offset search
Find the value with the earliest saved timestamp closest to a specified number of milliseconds behind the current bar's opening time. This search method provides a time-based alternative to retrieving historical values at specific bar offsets.
Period offset search
Locate the value with the earliest saved timestamp closest to a defined period offset behind the current bar's opening time. The function calculates the span of the offset based on a period string . The "string" must contain one of the following unit tokens:
• "D" for days
• "W" for weeks
• "M" for months
• "Y" for years
• "YTD" for year-to-date, meaning the time elapsed since the beginning of the bar's opening year in the exchange time zone.
The period string can include a multiplier prefix for all supported units except "YTD" (e.g., "2W" for two weeks).
Note that the precise span covered by the "M", "Y", and "YTD" units varies across time. The "1M" period can cover 28, 29, 30, or 31 days, depending on the bar's opening month and year in the exchange time zone. The "1Y" period covers 365 or 366 days, depending on leap years. The "YTD" period's span changes with each new bar, because it always measures the time from the start of the current bar's opening year.
█ CALCULATIONS AND USE
This library's functions offer a flexible, structured approach to retrieving historical values at or near specific timestamps, millisecond offsets, or period offsets for different analytical needs.
See below for explanations of the exported functions and how to use them.
Retrieving single values
The library includes three functions that retrieve a single stored value using timestamp, millisecond offset, or period offset search methods:
• `valueAtTime()` – Locates the saved value with the earliest timestamp closest to a specified timestamp.
• `valueAtTimeOffset()` – Finds the saved value with the earliest timestamp closest to the specified number of milliseconds behind the current bar's opening time.
• `valueAtPeriodOffset()` – Finds the saved value with the earliest timestamp closest to the period-based offset behind the current bar's opening time.
Each function has two overloads for advanced and simple use cases. The first overload searches for a value in a user-specified `Data` object created by the `collectData()` function (see below). It returns a tuple containing the found value and the corresponding timestamp.
The second overload maintains a `Data` object internally to store and retrieve values for a specified `source` series. This overload returns a tuple containing the historical `source` value, the corresponding timestamp, and the current bar's `source` value, making it helpful for comparing past and present values from requested contexts.
Retrieving multiple values
The library includes the following functions to retrieve values from multiple historical points in time, facilitating calculations and comparisons with values retrieved across several intervals:
• `getDataAtTimes()` – Locates a past `source` value for each item in a `timestamps` array. Each retrieved value's timestamp represents the earliest time closest to one of the specified timestamps.
• `getDataAtTimeOffsets()` – Finds a past `source` value for each item in a `timeOffsets` array. Each retrieved value's timestamp represents the earliest time closest to one of the specified millisecond offsets behind the current bar's opening time.
• `getDataAtPeriodOffsets()` – Finds a past value for each item in a `periods` array. Each retrieved value's timestamp represents the earliest time closest to one of the specified period offsets behind the current bar's opening time.
Each function returns a tuple with arrays containing the found `source` values and their corresponding timestamps. In addition, the tuple includes the current `source` value and the symbol's description, which also makes these functions helpful for multi-interval comparisons using data from requested contexts.
Processing period inputs
When writing scripts that retrieve historical values based on several user-specified period offsets, the most concise approach is to create a single text input that allows users to list each period, then process the "string" list into an array for use in the `getDataAtPeriodOffsets()` function.
This library includes a `getArrayFromString()` function to provide a simple way to process strings containing comma-separated lists of periods. The function splits the specified `str` by its commas and returns an array containing every non-empty item in the list with surrounding whitespaces removed. View the example code to see how we use this function to process the value of a text area input .
Calculating period offset times
Because the exact amount of time covered by a specified period offset can vary, it is often helpful to verify the resulting times when using the `valueAtPeriodOffset()` or `getDataAtPeriodOffsets()` functions to ensure the calculations work as intended for your use case.
The library's `periodToTimestamp()` function calculates an offset timestamp from a given period and reference time. With this function, programmers can verify the time offsets in a period-based data search and use the calculated offset times in additional operations.
For periods with "D" or "W" units, the function calculates the time offset based on the absolute number of milliseconds the period covers (e.g., `86400000` for "1D"). For periods with "M", "Y", or "YTD" units, the function calculates an offset time based on the reference time's calendar date in the exchange time zone.
Collecting data
All the `getDataAt*()` functions, and the second overloads of the `valueAt*()` functions, collect and maintain data internally, meaning scripts do not require a separate `Data` object when using them. However, the first overloads of the `valueAt*()` functions do not collect data, because they retrieve values from a user-specified `Data` object.
For cases where a script requires a separate `Data` object for use with these overloads or other custom routines, this library exports the `collectData()` function. This function queues each bar's `source` value and opening timestamp into a `Data` object and returns the object's ID.
This function is particularly useful when searching for values from a specific series more than once. For instance, instead of using multiple calls to the second overloads of `valueAt*()` functions with the same `source` argument, programmers can call `collectData()` to store each bar's `source` and opening timestamp, then use the returned `Data` object's ID in calls to the first `valueAt*()` overloads to reduce memory usage.
The `collectData()` function and all the functions that collect data internally include two optional parameters for limiting the saved time-value pairs to a sliding window: `timeOffsetLimit` and `timeframeLimit`. When either has a non-na argument, the function restricts the collected data to the maximum number of recent bars covered by the specified millisecond- and timeframe-based intervals.
NOTE : All calls to the functions that collect data for a `source` series can execute up to once per bar or realtime tick, because each stored value requires a unique corresponding timestamp. Therefore, scripts cannot call these functions iteratively within a loop . If a call to these functions executes more than once inside a loop's scope, it causes a runtime error.
█ EXAMPLE CODE
The example code at the end of the script demonstrates one possible use case for this library's functions. The code retrieves historical price data at user-specified period offsets, calculates price returns for each period from the retrieved data, and then populates a table with the results.
The example code's process is as follows:
1. Input a list of periods – The user specifies a comma-separated list of period strings in the script's "Period list" input (e.g., "1W, 1M, 3M, 1Y, YTD"). Each item in the input list represents a period offset from the latest bar's opening time.
2. Process the period list – The example calls `getArrayFromString()` on the first bar to split the input list by its commas and construct an array of period strings.
3. Request historical data – The code uses a call to `getDataAtPeriodOffsets()` as the `expression` argument in a request.security() call to retrieve the closing prices of "1D" bars for each period included in the processed `periods` array.
4. Display information in a table – On the latest bar, the code uses the retrieved data to calculate price returns over each specified period, then populates a two-row table with the results. The cells for each return percentage are color-coded based on the magnitude and direction of the price change. The cells also include tooltips showing the compared daily bar's opening date in the exchange time zone.
█ NOTES
• This library's architecture relies on a user-defined type (UDT) for its data storage format. UDTs are blueprints from which scripts create objects , i.e., composite structures with fields containing independent values or references of any supported type.
• The library functions search through a `Data` object's `times` array using the array.binary_search_leftmost() function, which is more efficient than looping through collected data to identify matching timestamps. Note that this built-in works only for arrays with elements sorted in ascending order .
• Each function that collects data from a `source` series updates the values and times stored in a local `Data` object's arrays. If a single call to these functions were to execute in a loop , it would store multiple values with an identical timestamp, which can cause erroneous search behavior. To prevent looped calls to these functions, the library uses the `checkCall()` helper function in their scopes. This function maintains a counter that increases by one each time it executes on a confirmed bar. If the count exceeds the total number of bars, indicating the call executes more than once in a loop, it raises a runtime error .
• Typically, when requesting higher-timeframe data with request.security() while using barmerge.lookahead_on as the `lookahead` argument, the `expression` argument should be offset with the history-referencing operator to prevent lookahead bias on historical bars. However, the call in this script's example code enables lookahead without offsetting the `expression` because the script displays results only on the last historical bar and all realtime bars, where there is no future data to leak into the past. This call ensures the displayed results use the latest data available from the context on realtime bars.
Look first. Then leap.
█ EXPORTED TYPES
Data
A structure for storing successive timestamps and corresponding values from a dataset.
Fields:
times (array) : An "int" array containing a UNIX timestamp for each value in the `values` array.
values (array) : A "float" array containing values corresponding to the timestamps in the `times` array.
█ EXPORTED FUNCTIONS
getArrayFromString(str)
Splits a "string" into an array of substrings using the comma (`,`) as the delimiter. The function trims surrounding whitespace characters from each substring, and it excludes empty substrings from the result.
Parameters:
str (series string) : The "string" to split into an array based on its commas.
Returns: (array) An array of trimmed substrings from the specified `str`.
periodToTimestamp(period, referenceTime)
Calculates a UNIX timestamp representing the point offset behind a reference time by the amount of time within the specified `period`.
Parameters:
period (series string) : The period string, which determines the time offset of the returned timestamp. The specified argument must contain a unit and an optional multiplier (e.g., "1Y", "3M", "2W", "YTD"). Supported units are:
- "Y" for years.
- "M" for months.
- "W" for weeks.
- "D" for days.
- "YTD" (Year-to-date) for the span from the start of the `referenceTime` value's year in the exchange time zone. An argument with this unit cannot contain a multiplier.
referenceTime (series int) : The millisecond UNIX timestamp from which to calculate the offset time.
Returns: (int) A millisecond UNIX timestamp representing the offset time point behind the `referenceTime`.
collectData(source, timeOffsetLimit, timeframeLimit)
Collects `source` and `time` data successively across bars. The function stores the information within a `Data` object for use in other exported functions/methods, such as `valueAtTimeOffset()` and `valueAtPeriodOffset()`. Any call to this function cannot execute more than once per bar or realtime tick.
Parameters:
source (series float) : The source series to collect. The function stores each value in the series with an associated timestamp representing its corresponding bar's opening time.
timeOffsetLimit (simple int) : Optional. A time offset (range) in milliseconds. If specified, the function limits the collected data to the maximum number of bars covered by the range, with a minimum of one bar. If the call includes a non-empty `timeframeLimit` value, the function limits the data using the largest number of bars covered by the two ranges. The default is `na`.
timeframeLimit (simple string) : Optional. A valid timeframe string. If specified and not empty, the function limits the collected data to the maximum number of bars covered by the timeframe, with a minimum of one bar. If the call includes a non-na `timeOffsetLimit` value, the function limits the data using the largest number of bars covered by the two ranges. The default is `na`.
Returns: (Data) A `Data` object containing collected `source` values and corresponding timestamps over the allowed time range.
method valueAtTime(data, timestamp)
(Overload 1 of 2) Retrieves value and time data from a `Data` object's fields at the index of the earliest timestamp closest to the specified `timestamp`. Callable as a method or a function.
Parameters:
data (series Data) : The `Data` object containing the collected time and value data.
timestamp (series int) : The millisecond UNIX timestamp to search. The function returns data for the earliest saved timestamp that is closest to the value.
Returns: ( ) A tuple containing the following data from the `Data` object:
- The stored value corresponding to the identified timestamp ("float").
- The earliest saved timestamp that is closest to the specified `timestamp` ("int").
valueAtTime(source, timestamp, timeOffsetLimit, timeframeLimit)
(Overload 2 of 2) Retrieves `source` and time information for the earliest bar whose opening timestamp is closest to the specified `timestamp`. Any call to this function cannot execute more than once per bar or realtime tick.
Parameters:
source (series float) : The source series to analyze. The function stores each value in the series with an associated timestamp representing its corresponding bar's opening time.
timestamp (series int) : The millisecond UNIX timestamp to search. The function returns data for the earliest bar whose timestamp is closest to the value.
timeOffsetLimit (simple int) : Optional. A time offset (range) in milliseconds. If specified, the function limits the collected data to the maximum number of bars covered by the range, with a minimum of one bar. If the call includes a non-empty `timeframeLimit` value, the function limits the data using the largest number of bars covered by the two ranges. The default is `na`.
timeframeLimit (simple string) : (simple string) Optional. A valid timeframe string. If specified and not empty, the function limits the collected data to the maximum number of bars covered by the timeframe, with a minimum of one bar. If the call includes a non-na `timeOffsetLimit` value, the function limits the data using the largest number of bars covered by the two ranges. The default is `na`.
Returns: ( ) A tuple containing the following data:
- The `source` value corresponding to the identified timestamp ("float").
- The earliest bar's timestamp that is closest to the specified `timestamp` ("int").
- The current bar's `source` value ("float").
method valueAtTimeOffset(data, timeOffset)
(Overload 1 of 2) Retrieves value and time data from a `Data` object's fields at the index of the earliest saved timestamp closest to `timeOffset` milliseconds behind the current bar's opening time. Callable as a method or a function.
Parameters:
data (series Data) : The `Data` object containing the collected time and value data.
timeOffset (series int) : The millisecond offset behind the bar's opening time. The function returns data for the earliest saved timestamp that is closest to the calculated offset time.
Returns: ( ) A tuple containing the following data from the `Data` object:
- The stored value corresponding to the identified timestamp ("float").
- The earliest saved timestamp that is closest to `timeOffset` milliseconds before the current bar's opening time ("int").
valueAtTimeOffset(source, timeOffset, timeOffsetLimit, timeframeLimit)
(Overload 2 of 2) Retrieves `source` and time information for the earliest bar whose opening timestamp is closest to `timeOffset` milliseconds behind the current bar's opening time. Any call to this function cannot execute more than once per bar or realtime tick.
Parameters:
source (series float) : The source series to analyze. The function stores each value in the series with an associated timestamp representing its corresponding bar's opening time.
timeOffset (series int) : The millisecond offset behind the bar's opening time. The function returns data for the earliest bar's timestamp that is closest to the calculated offset time.
timeOffsetLimit (simple int) : Optional. A time offset (range) in milliseconds. If specified, the function limits the collected data to the maximum number of bars covered by the range, with a minimum of one bar. If the call includes a non-empty `timeframeLimit` value, the function limits the data using the largest number of bars covered by the two ranges. The default is `na`.
timeframeLimit (simple string) : Optional. A valid timeframe string. If specified and not empty, the function limits the collected data to the maximum number of bars covered by the timeframe, with a minimum of one bar. If the call includes a non-na `timeOffsetLimit` value, the function limits the data using the largest number of bars covered by the two ranges. The default is `na`.
Returns: ( ) A tuple containing the following data:
- The `source` value corresponding to the identified timestamp ("float").
- The earliest bar's timestamp that is closest to `timeOffset` milliseconds before the current bar's opening time ("int").
- The current bar's `source` value ("float").
method valueAtPeriodOffset(data, period)
(Overload 1 of 2) Retrieves value and time data from a `Data` object's fields at the index of the earliest timestamp closest to a calculated offset behind the current bar's opening time. The calculated offset represents the amount of time covered by the specified `period`. Callable as a method or a function.
Parameters:
data (series Data) : The `Data` object containing the collected time and value data.
period (series string) : The period string, which determines the calculated time offset. The specified argument must contain a unit and an optional multiplier (e.g., "1Y", "3M", "2W", "YTD"). Supported units are:
- "Y" for years.
- "M" for months.
- "W" for weeks.
- "D" for days.
- "YTD" (Year-to-date) for the span from the start of the current bar's year in the exchange time zone. An argument with this unit cannot contain a multiplier.
Returns: ( ) A tuple containing the following data from the `Data` object:
- The stored value corresponding to the identified timestamp ("float").
- The earliest saved timestamp that is closest to the calculated offset behind the bar's opening time ("int").
valueAtPeriodOffset(source, period, timeOffsetLimit, timeframeLimit)
(Overload 2 of 2) Retrieves `source` and time information for the earliest bar whose opening timestamp is closest to a calculated offset behind the current bar's opening time. The calculated offset represents the amount of time covered by the specified `period`. Any call to this function cannot execute more than once per bar or realtime tick.
Parameters:
source (series float) : The source series to analyze. The function stores each value in the series with an associated timestamp representing its corresponding bar's opening time.
period (series string) : The period string, which determines the calculated time offset. The specified argument must contain a unit and an optional multiplier (e.g., "1Y", "3M", "2W", "YTD"). Supported units are:
- "Y" for years.
- "M" for months.
- "W" for weeks.
- "D" for days.
- "YTD" (Year-to-date) for the span from the start of the current bar's year in the exchange time zone. An argument with this unit cannot contain a multiplier.
timeOffsetLimit (simple int) : Optional. A time offset (range) in milliseconds. If specified, the function limits the collected data to the maximum number of bars covered by the range, with a minimum of one bar. If the call includes a non-empty `timeframeLimit` value, the function limits the data using the largest number of bars covered by the two ranges. The default is `na`.
timeframeLimit (simple string) : Optional. A valid timeframe string. If specified and not empty, the function limits the collected data to the maximum number of bars covered by the timeframe, with a minimum of one bar. If the call includes a non-na `timeOffsetLimit` value, the function limits the data using the largest number of bars covered by the two ranges. The default is `na`.
Returns: ( ) A tuple containing the following data:
- The `source` value corresponding to the identified timestamp ("float").
- The earliest bar's timestamp that is closest to the calculated offset behind the current bar's opening time ("int").
- The current bar's `source` value ("float").
getDataAtTimes(timestamps, source, timeOffsetLimit, timeframeLimit)
Retrieves `source` and time information for each bar whose opening timestamp is the earliest one closest to one of the UNIX timestamps specified in the `timestamps` array. Any call to this function cannot execute more than once per bar or realtime tick.
Parameters:
timestamps (array) : An array of "int" values representing UNIX timestamps. The function retrieves `source` and time data for each element in this array.
source (series float) : The source series to analyze. The function stores each value in the series with an associated timestamp representing its corresponding bar's opening time.
timeOffsetLimit (simple int) : Optional. A time offset (range) in milliseconds. If specified, the function limits the collected data to the maximum number of bars covered by the range, with a minimum of one bar. If the call includes a non-empty `timeframeLimit` value, the function limits the data using the largest number of bars covered by the two ranges. The default is `na`.
timeframeLimit (simple string) : Optional. A valid timeframe string. If specified and not empty, the function limits the collected data to the maximum number of bars covered by the timeframe, with a minimum of one bar. If the call includes a non-na `timeOffsetLimit` value, the function limits the data using the largest number of bars covered by the two ranges. The default is `na`.
Returns: ( ) A tuple of the following data:
- An array containing a `source` value for each identified timestamp (array).
- An array containing an identified timestamp for each item in the `timestamps` array (array).
- The current bar's `source` value ("float").
- The symbol's description from `syminfo.description` ("string").
getDataAtTimeOffsets(timeOffsets, source, timeOffsetLimit, timeframeLimit)
Retrieves `source` and time information for each bar whose opening timestamp is the earliest one closest to one of the time offsets specified in the `timeOffsets` array. Each offset in the array represents the absolute number of milliseconds behind the current bar's opening time. Any call to this function cannot execute more than once per bar or realtime tick.
Parameters:
timeOffsets (array) : An array of "int" values representing the millisecond time offsets used in the search. The function retrieves `source` and time data for each element in this array. For example, the array ` ` specifies that the function returns data for the timestamps closest to one day and one week behind the current bar's opening time.
source (float) : (series float) The source series to analyze. The function stores each value in the series with an associated timestamp representing its corresponding bar's opening time.
timeOffsetLimit (simple int) : Optional. A time offset (range) in milliseconds. If specified, the function limits the collected data to the maximum number of bars covered by the range, with a minimum of one bar. If the call includes a non-empty `timeframeLimit` value, the function limits the data using the largest number of bars covered by the two ranges. The default is `na`.
timeframeLimit (simple string) : Optional. A valid timeframe string. If specified and not empty, the function limits the collected data to the maximum number of bars covered by the timeframe, with a minimum of one bar. If the call includes a non-na `timeOffsetLimit` value, the function limits the data using the largest number of bars covered by the two ranges. The default is `na`.
Returns: ( ) A tuple of the following data:
- An array containing a `source` value for each identified timestamp (array).
- An array containing an identified timestamp for each offset specified in the `timeOffsets` array (array).
- The current bar's `source` value ("float").
- The symbol's description from `syminfo.description` ("string").
getDataAtPeriodOffsets(periods, source, timeOffsetLimit, timeframeLimit)
Retrieves `source` and time information for each bar whose opening timestamp is the earliest one closest to a calculated offset behind the current bar's opening time. Each calculated offset represents the amount of time covered by a period specified in the `periods` array. Any call to this function cannot execute more than once per bar or realtime tick.
Parameters:
periods (array) : An array of period strings, which determines the time offsets used in the search. The function retrieves `source` and time data for each element in this array. For example, the array ` ` specifies that the function returns data for the timestamps closest to one day, week, and month behind the current bar's opening time. Each "string" in the array must contain a unit and an optional multiplier. Supported units are:
- "Y" for years.
- "M" for months.
- "W" for weeks.
- "D" for days.
- "YTD" (Year-to-date) for the span from the start of the current bar's year in the exchange time zone. An argument with this unit cannot contain a multiplier.
source (float) : (series float) The source series to analyze. The function stores each value in the series with an associated timestamp representing its corresponding bar's opening time.
timeOffsetLimit (simple int) : Optional. A time offset (range) in milliseconds. If specified, the function limits the collected data to the maximum number of bars covered by the range, with a minimum of one bar. If the call includes a non-empty `timeframeLimit` value, the function limits the data using the largest number of bars covered by the two ranges. The default is `na`.
timeframeLimit (simple string) : Optional. A valid timeframe string. If specified and not empty, the function limits the collected data to the maximum number of bars covered by the timeframe, with a minimum of one bar. If the call includes a non-na `timeOffsetLimit` value, the function limits the data using the largest number of bars covered by the two ranges. The default is `na`.
Returns: ( ) A tuple of the following data:
- An array containing a `source` value for each identified timestamp (array).
- An array containing an identified timestamp for each period specified in the `periods` array (array).
- The current bar's `source` value ("float").
- The symbol's description from `syminfo.description` ("string").

VolumeProfileLibrary "VolumeProfile"
Analyzes volume and price and calculates a volume profile, in particular the Point Of Control and Value Area values.
new(rowSizeInTicks, valueAreaCoverage, startTime)
Constructor method that creates a new Volume Profile
Parameters:
rowSizeInTicks (float) : Internal row size (aka resolution) of the volume profile. Useful for most futures contracts would be '1 / syminfo.mintick'. Default '4'.
valueAreaCoverage (int) : Percentage of total volume that is considered the Value Area. Default '70'
startTime (int) : Start time (unix timestamp in milliseconds) of the Volume Profile. Default 'time'.
Returns: VolumeProfile object
method calculatePOC(vp)
Calculates current Point Of Control of the VP
Namespace types: VolumeProfile
Parameters:
vp (VolumeProfile)
Returns: void
method calculateVA(vp)
Calculates current Value Area High and Low of the VP
Namespace types: VolumeProfile
Parameters:
vp (VolumeProfile)
Returns: void
method update(vp, h, l, v, t)
Processes new chart data and sorts volume into rows. Then calls calculatePOC() and calculateVA() to update the VP. Parameters are usually the output of request.security_lower_tf.
Namespace types: VolumeProfile
Parameters:
vp (VolumeProfile)
h (array) : Array of highs
l (array) : Array of lows
v (array) : Array of volumes
t (array) : Array of candle times
Returns: void
method setSessionHigh(vp, h)
Sets the high of the session the VP is tracking
Namespace types: VolumeProfile
Parameters:
vp (VolumeProfile)
h (float)
Returns: void
method setSessionLow(vp, l)
Sets the low of the session the VP is tracking
Namespace types: VolumeProfile
Parameters:
vp (VolumeProfile)
l (float)
Returns: void
method getPOC(vp)
Gets the current Point Of Control
Namespace types: VolumeProfile
Parameters:
vp (VolumeProfile)
Returns: Point Of Control (float)
method getVAH(vp)
Gets the current Value Area High
Namespace types: VolumeProfile
Parameters:
vp (VolumeProfile)
Returns: Value Area High (float)
method getVAL(vp)
Gets the current Value Area Low
Namespace types: VolumeProfile
Parameters:
vp (VolumeProfile)
Returns: Value Area Low (float)
VolumeProfile
Fields:
rowSizeInTicks (series float)
valueAreaCoverage (series int)
startTime (series int)
valueAreaHigh (series float)
pointOfControl (series float)
valueAreaLow (series float)
sessionHigh (series float)
sessionLow (series float)
volumeByRow (map)
totalVolume (series float)
pocRow (series float)
pocVol (series float)
