JohnEhlersFourierTransformLibrary "JohnEhlersFourierTransform"
Fourier Transform for Traders By John Ehlers, slightly modified to allow to inspect other than the 8-50 frequency spectrum.
reference:
www.mesasoftware.com
high_pass_filter(source) Detrended version of the data by High Pass Filtering with a 40 Period cutoff
Parameters:
source : float, data source.
Returns: float.
transformed_dft(source, start_frequency, end_frequency) DFT by John Elhers.
Parameters:
source : float, data source.
start_frequency : int, lower bound of the frequency window, must be a positive number >= 0, window must be less than or 30.
end_frequency : int, upper bound of the frequency window, must be a positive number >= 0, window must be less than or 30.
Returns: tuple with float, float array.
db_to_rgb(db, transparency) converts the frequency decibels to rgb.
Parameters:
db : float, decibels value.
transparency : float, transparency value.
Returns: color.
Statistics

FunctionCosineSimilarityLibrary "FunctionCosineSimilarity"
Cosine Similarity method.
function(sample_a, sample_b) Measure the similarity of 2 vectors.
Parameters:
sample_a : float array, values.
sample_b : float array, values.
Returns: float.
diss(cosim) Dissimilarity helper function.
Parameters:
cosim : float, cosine similarity value (0 > 1)
Returns: float

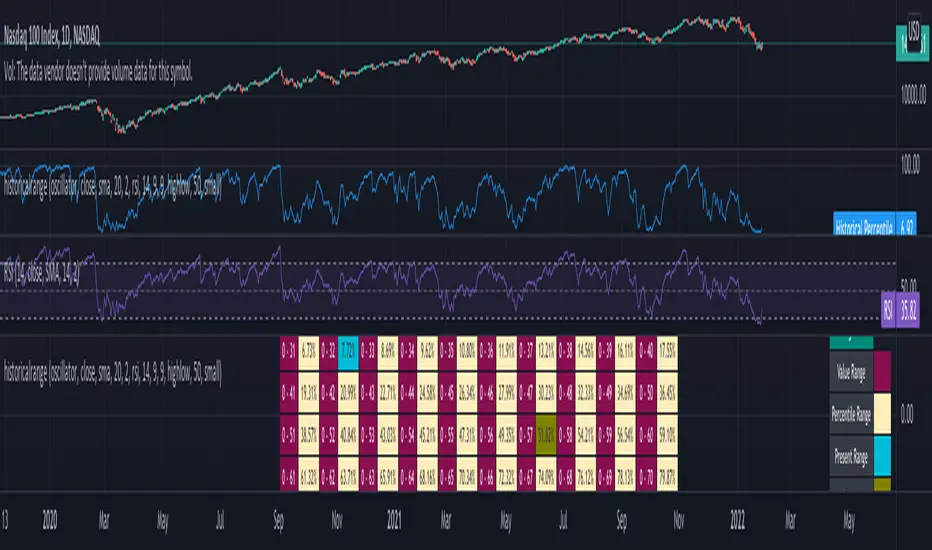
historicalrangeLibrary "historicalrange"
Library provices a method to calculate historical percentile range of series.
hpercentrank(source) calculates historical percentrank of the source
Parameters:
source : Source for which historical percentrank needs to be calculated. Source should be ranging between 0-100. If using a source which can beyond 0-100, use short term percentrank to baseline them.
Returns: pArray - percentrank array which contains how many instances of source occurred at different levels.
upperPercentile - percentile based on higher value
lowerPercentile - percentile based on lower value
median - median value of the source
max - max value of the source
distancefromath(source) returns stats on historical distance from ath in terms of percentage
Parameters:
source : for which stats are calculated
Returns: percentile and related historical stats regarding distance from ath
distancefromma(maType, length, source) returns stats on historical distance from moving average in terms of percentage
Parameters:
maType : Moving Average Type : Can be sma, ema, hma, rma, wma, vwma, swma, highlow, linreg, median
length : Moving Average Length
source : for which stats are calculated
Returns: percentile and related historical stats regarding distance from ath
bpercentb(source, maType, length, multiplier, sticky) returns percentrank and stats on historical bpercentb levels
Parameters:
source : Moving Average Source
maType : Moving Average Type : Can be sma, ema, hma, rma, wma, vwma, swma, highlow, linreg, median
length : Moving Average Length
multiplier : Standard Deviation multiplier
sticky : - sticky boundaries which will only change when value is outside boundary.
Returns: percentile and related historical stats regarding Bollinger Percent B
kpercentk(source, maType, length, multiplier, useTrueRange, sticky) returns percentrank and stats on historical kpercentk levels
Parameters:
source : Moving Average Source
maType : Moving Average Type : Can be sma, ema, hma, rma, wma, vwma, swma, highlow, linreg, median
length : Moving Average Length
multiplier : Standard Deviation multiplier
useTrueRange : - if set to false, uses high-low.
sticky : - sticky boundaries which will only change when value is outside boundary.
Returns: percentile and related historical stats regarding Keltener Percent K
dpercentd(useAlternateSource, alternateSource, length, sticky) returns percentrank and stats on historical dpercentd levels
Parameters:
useAlternateSource : - Custom source is used only if useAlternateSource is set to true
alternateSource : - Custom source
length : - donchian channel length
sticky : - sticky boundaries which will only change when value is outside boundary.
Returns: percentile and related historical stats regarding Donchian Percent D
oscillator(type, length, shortLength, longLength, source, highSource, lowSource, method, highlowLength, sticky) oscillator - returns Choice of oscillator with custom overbought/oversold range
Parameters:
type : - oscillator type. Valid values : cci, cmo, cog, mfi, roc, rsi, stoch, tsi, wpr
length : - Oscillator length - not used for TSI
shortLength : - shortLength only used for TSI
longLength : - longLength only used for TSI
source : - custom source if required
highSource : - custom high source for stochastic oscillator
lowSource : - custom low source for stochastic oscillator
method : - Valid values for method are : sma, ema, hma, rma, wma, vwma, swma, highlow, linreg, median
highlowLength : - length on which highlow of the oscillator is calculated
sticky : - overbought, oversold levels won't change unless crossed
Returns: percentile and related historical stats regarding oscillator
WIPNNetworkLibrary "WIPNNetwork"
this is a work in progress (WIP) and prone to have some errors, so use at your own risk...
let me know if you find any issues..
Method for a generalized Neural Network.
network(x) Generalized Neural Network Method.
Parameters:
x : TODO: add parameter x description here
Returns: TODO: add what function returns

FunctionPatternDecompositionLibrary "FunctionPatternDecomposition"
Methods for decomposing price into common grid/matrix patterns.
series_to_array(source, length) Helper for converting series to array.
Parameters:
source : float, data series.
length : int, size.
Returns: float array.
smooth_data_2d(data, rate) Smooth data sample into 2d points.
Parameters:
data : float array, source data.
rate : float, default=0.25, the rate of smoothness to apply.
Returns: tuple with 2 float arrays.
thin_points(data_x, data_y, rate) Thin the number of points.
Parameters:
data_x : float array, points x value.
data_y : float array, points y value.
rate : float, default=2.0, minimum threshold rate of sample stdev to accept points.
Returns: tuple with 2 float arrays.
extract_point_direction(data_x, data_y) Extract the direction each point faces.
Parameters:
data_x : float array, points x value.
data_y : float array, points y value.
Returns: float array.
find_corners(data_x, data_y, rate) ...
Parameters:
data_x : float array, points x value.
data_y : float array, points y value.
rate : float, minimum threshold rate of data y stdev.
Returns: tuple with 2 float arrays.
grid_coordinates(data_x, data_y, m_size) transforms points data to a constrained sized matrix format.
Parameters:
data_x : float array, points x value.
data_y : float array, points y value.
m_size : int, default=10, size of the matrix.
Returns: flat 2d pseudo matrix.

statisticsLibrary "statistics"
General statistics library.
erf(x) The "error function" encountered in integrating the normal
distribution (which is a normalized form of the Gaussian function).
Parameters:
x : The input series.
Returns: The Error Function evaluated for each element of x.
erfc(x)
Parameters:
x : The input series
Returns: The Complementary Error Function evaluated for each alement of x.
sumOfReciprocals(src, len) Calculates the sum of the reciprocals of the series.
For each element 'elem' in the series:
sum += 1/elem
Should the element be 0, the reciprocal value of 0 is used instead
of NA.
Parameters:
src : The input series.
len : The length for the sum.
Returns: The sum of the resciprocals of 'src' for 'len' bars back.
mean(src, len) The mean of the series.
(wrapper around ta.sma).
Parameters:
src : The input series.
len : The length for the mean.
Returns: The mean of 'src' for 'len' bars back.
average(src, len) The mean of the series.
(wrapper around ta.sma).
Parameters:
src : The input series.
len : The length for the average.
Returns: The average of 'src' for 'len' bars back.
geometricMean(src, len) The Geometric Mean of the series.
The geometric mean is most important when using data representing
percentages, ratios, or rates of change. It cannot be used for
negative numbers
Since the pure mathematical implementation generates a very large
intermediate result, we performed the calculation in log space.
Parameters:
src : The input series.
len : The length for the geometricMean.
Returns: The geometric mean of 'src' for 'len' bars back.
harmonicMean(src, len) The Harmonic Mean of the series.
The harmonic mean is most applicable to time changes and, along
with the geometric mean, has been used in economics for price
analysis. It is more difficult to calculate; therefore, it is less
popular than eiter of the other averages.
0 values are ignored in the calculation.
Parameters:
src : The input series.
len : The length for the harmonicMean.
Returns: The harmonic mean of 'src' for 'len' bars back.
median(src, len) The median of the series.
(a wrapper around ta.median)
Parameters:
src : The input series.
len : The length for the median.
Returns: The median of 'src' for 'len' bars back.
variance(src, len, biased) The variance of the series.
Parameters:
src : The input series.
len : The length for the variance.
biased : Wether to use the biased calculation (for a population), or the
unbiased calculation (for a sample set). .
Returns: The variance of 'src' for 'len' bars back.
stdev(src, len, biased) The standard deviation of the series.
Parameters:
src : The input series.
len : The length for the stdev.
biased : Wether to use the biased calculation (for a population), or the
unbiased calculation (for a sample set). .
Returns: The standard deviation of 'src' for 'len' bars back.
skewness(src, len) The skew of the series.
Skewness measures the amount of distortion from a symmetric
distribution, making the curve appear to be short on the left
(lower prices) and extended to the right (higher prices). The
extended side, either left or right is called the tail, and a
longer tail to the right is called positive skewness. Negative
skewness has the tail extending towards the left.
Parameters:
src : The input series.
len : The length for the skewness.
Returns: The skewness of 'src' for 'len' bars back.
kurtosis(src, len) The kurtosis of the series.
Kurtosis describes the peakedness or flatness of a distribution.
This can be used as an unbiased assessment of whether prices are
trending or moving sideways. Trending prices will ocver a wider
range and thus a flatter distribution (kurtosis < 3; negative
kurtosis). If prices are range-bound, there will be a clustering
around the mean and we have positive kurtosis (kurtosis > 3)
Parameters:
src : The input series.
len : The length for the kurtosis.
Returns: The kurtosis of 'src' for 'len' bars back.
excessKurtosis(src, len) The normalized kurtosis of the series.
kurtosis > 0 --> positive kurtosis --> trending
kurtosis < 0 --> negative krutosis --> range-bound
Parameters:
src : The input series.
len : The length for the excessKurtosis.
Returns: The excessKurtosis of 'src' for 'len' bars back.
normDist(src, len, value) Calculates the probability mass for the value according to the
src and length. It calculates the probability for value to be
present in the normal distribution calculated for src and length.
Parameters:
src : The input series.
len : The length for the normDist.
value : The series of values to calculate the normal distance for
Returns: The normal distance of 'value' to 'src' for 'len' bars back.
normDistCumulative(src, len, value) Calculates the cumulative probability mass for the value according
to the src and length. It calculates the cumulative probability for
value to be present in the normal distribution calculated for src
and length.
Parameters:
src : The input series.
len : The length for the normDistCumulative.
value : The series of values to calculate the cumulative normal distance
for
Returns: The cumulative normal distance of 'value' to 'src' for 'len' bars
back.
zScore(src, len, value) Returns then z-score of objective to the series src.
It returns the number of stdev's the objective is away from the
mean(src, len)
Parameters:
src : The input series.
len : The length for the zScore.
value : The series of values to calculate the cumulative normal distance
for
Returns: The z-score of objectiv with respect to src and len.
er(src, len) Calculates the efficiency ratio of the series.
It measures the noise of the series. The lower the number, the
higher the noise.
Parameters:
src : The input series.
len : The length for the efficiency ratio.
Returns: The efficiency ratio of 'src' for 'len' bars back.
efficiencyRatio(src, len) Calculates the efficiency ratio of the series.
It measures the noise of the series. The lower the number, the
higher the noise.
Parameters:
src : The input series.
len : The length for the efficiency ratio.
Returns: The efficiency ratio of 'src' for 'len' bars back.
fractalEfficiency(src, len) Calculates the efficiency ratio of the series.
It measures the noise of the series. The lower the number, the
higher the noise.
Parameters:
src : The input series.
len : The length for the efficiency ratio.
Returns: The efficiency ratio of 'src' for 'len' bars back.
mse(src, len) Calculates the Mean Squared Error of the series.
Parameters:
src : The input series.
len : The length for the mean squared error.
Returns: The mean squared error of 'src' for 'len' bars back.
meanSquaredError(src, len) Calculates the Mean Squared Error of the series.
Parameters:
src : The input series.
len : The length for the mean squared error.
Returns: The mean squared error of 'src' for 'len' bars back.
rmse(src, len) Calculates the Root Mean Squared Error of the series.
Parameters:
src : The input series.
len : The length for the root mean squared error.
Returns: The root mean squared error of 'src' for 'len' bars back.
rootMeanSquaredError(src, len) Calculates the Root Mean Squared Error of the series.
Parameters:
src : The input series.
len : The length for the root mean squared error.
Returns: The root mean squared error of 'src' for 'len' bars back.
mae(src, len) Calculates the Mean Absolute Error of the series.
Parameters:
src : The input series.
len : The length for the mean absolute error.
Returns: The mean absolute error of 'src' for 'len' bars back.
meanAbsoluteError(src, len) Calculates the Mean Absolute Error of the series.
Parameters:
src : The input series.
len : The length for the mean absolute error.
Returns: The mean absolute error of 'src' for 'len' bars back.

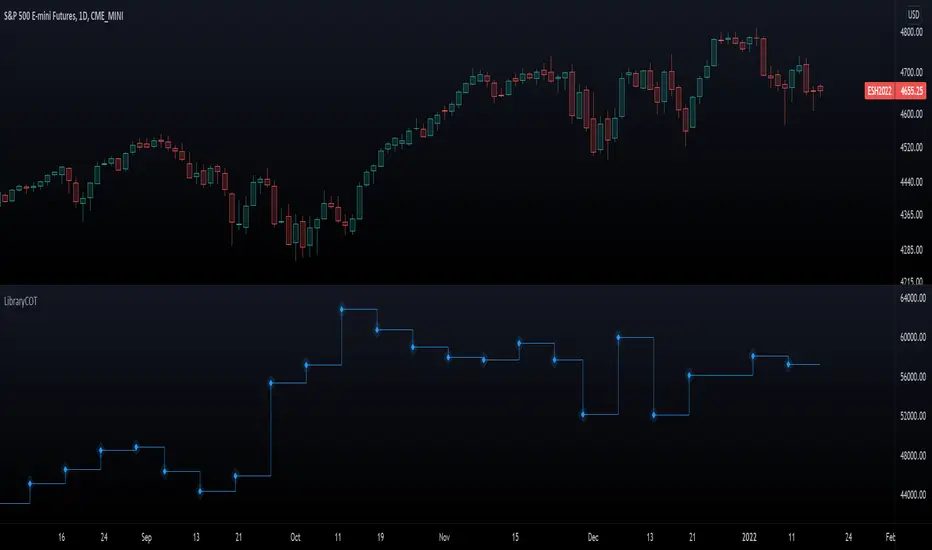
LibraryCOT█ OVERVIEW
This library is a Pine programmer's tool that provides functions to access Commitment of Traders (COT) data for futures. Four of our scripts use it:
• Commitment of Traders: Legacy Metrics
• Commitment of Traders: Disaggregated Metrics
• Commitment of Traders: Financial Metrics
• Commitment of Traders: Total
If you do not program in Pine and want to use COT data, please see the indicators linked above.
█ CONCEPTS
Commitment of Traders (COT) data is tallied by the Commodity Futures Trading Commission (CFTC) , a US federal agency that oversees the trading of derivative markets such as futures in the US. It is weekly data that provides traders with information about open interest for an asset. The CFTC oversees derivative markets traded on different exchanges, so COT data is available for assets that can be traded on CBOT, CME, NYMEX, COMEX, and ICEUS.
Accessing COT data from a Pine script requires the generation of a ticker ID string for use with request.security() . The ticker string must be encoded in a special format that includes both CFTC and TradingView-specific content. The format of the ticker IDs is somewhat complex; this library's functions make their generation easier. Note that if you know the COT ticker ID string for specific data, you can enter it from the chart's "Symbol Search" dialog box.
A ticker for COT data in Pine has the following structure:
COT:__<_metricDirection><_metricType>
where an underscore prefixing a component name inside <> is only included if the component is not a null string, and:
Is a digit representing the type of the COT report the data comes from: "" for legacy COT data, "2" for disaggregated data and "3" for financial data.
Is a six digit code that represents a commodity. Example: wheat futures (root "ZW") have the code "001602".
Is either "F" if the report data should exclude Options data, or "FO" if such data is included.
Is the TradingView code of the metric. This library's `metricNameAndDirectionToTicker()` function creates both
the and components of a COT ticker from the metric names and directions listed in the above chart.
The different metrics are explained in the CFTC's Explanatory Notes .
Is the direction of the metric: "Long", "Short", "Spreading" or "No direction".
Not all directions are applicable to all metrics. The valid ones are listed next to each metric in the above chart.
Is the type of the metric, possible values are "All", "Old" and "Other".
The difference between the types is explained in the "Old and Other Futures" section of the CFTC's Explanatory Notes .
As an example, the Legacy report Open Interest data for ZW futures (options included) in the old standard has the ticker "COT:001602_FO_OI_OLD". The same data using the current standard without futures has the ticker "COT:001602_F_OI".
█ USING THE LIBRARY
The first functions in the library are helper functions that generate components of a COT ticker ID. The last function, `COTTickerid()`, is the one that generates the full ticker ID string by calling some of the helper functions. We use it like this in our example:
exampleTicker = COTTickerid(
COTType = "Legacy",
CFTCCode = convertRootToCOTCode("Auto"),
includeOptions = false,
metricName = "Open Interest",
metricDirection = "No direction",
metricType = "All")
This library's chart displays the valid values for the `metricName` and `metricDirection` arguments. They vary for each of the three types of COT data (the `COTType` argument). The chart also displays the COT ticker ID string in the `exampleTicker` variable.
Look first. Then leap.
The library's functions are:
rootToCFTCCode(root)
Accepts a futures root and returns the relevant CFTC code.
Parameters:
root : Root prefix of the future's symbol, e.g. "ZC" for "ZC1!"" or "ZCU2021".
Returns: The part of a COT ticker corresponding to `root`, or "" if no CFTC code exists for the `root`.
currencyToCFTCCode(curr)
Converts a currency string to its corresponding CFTC code.
Parameters:
curr : Currency code, e.g., "USD" for US Dollar.
Returns: The corresponding to the currency, if one exists.
optionsToTicker(includeOptions)
Returns the part of a COT ticker using the `includeOptions` value supplied, which determines whether options data is to be included.
Parameters:
includeOptions : A "bool" value: 'true' if the symbol should include options and 'false' otherwise.
Returns: The part of a COT ticker: "FO" for data that includes options and "F" for data that doesn't.
metricNameAndDirectionToTicker(metricName, metricDirection)
Returns a string corresponding to a metric name and direction, which is one component required to build a valid COT ticker ID.
Parameters:
metricName : One of the metric names listed in this library's chart. Invalid values will cause a runtime error.
metricDirection : Metric direction. Possible values are: "Long", "Short", "Spreading", and "No direction".
Valid values vary with metrics. Invalid values will cause a runtime error.
Returns: The part of a COT ticker ID string, e.g., "OI_OLD" for "Open Interest" and "No direction",
or "TC_L" for "Traders Commercial" and "Long".
typeToTicker(metricType)
Converts a metric type into one component required to build a valid COT ticker ID.
See the "Old and Other Futures" section of the CFTC's Explanatory Notes for details on types.
Parameters:
metricType : Metric type. Accepted values are: "All", "Old", "Other".
Returns: The part of a COT ticker.
convertRootToCOTCode(mode, convertToCOT)
Depending on the `mode`, returns a CFTC code using the chart's symbol or its currency information when `convertToCOT = true`.
Otherwise, returns the symbol's root or currency information. If no COT data exists, a runtime error is generated.
Parameters:
mode : A string determining how the function will work. Valid values are:
"Root": the function extracts the futures symbol root (e.g. "ES" in "ESH2020") and looks for its CFTC code.
"Base currency": the function extracts the first currency in a pair (e.g. "EUR" in "EURUSD") and looks for its CFTC code.
"Currency": the function extracts the quote currency ("JPY" for "TSE:9984" or "USDJPY") and looks for its CFTC code.
"Auto": the function tries the first three modes (Root -> Base Currency -> Currency) until a match is found.
convertToCOT : "bool" value that, when `true`, causes the function to return a CFTC code.
Otherwise, the root or currency information is returned. Optional. The default is `true`.
Returns: If `convertToCOT` is `true`, the part of a COT ticker ID string.
If `convertToCOT` is `false`, the root or currency extracted from the current symbol.
COTTickerid(COTType, CTFCCode, includeOptions, metricName, metricDirection, metricType)
Returns a valid TradingView ticker for the COT symbol with specified parameters.
Parameters:
COTType : A string with the type of the report requested with the ticker, one of the following: "Legacy", "Disaggregated", "Financial".
CTFCCode : The for the asset, e.g., wheat futures (root "ZW") have the code "001602".
includeOptions : A boolean value. 'true' if the symbol should include options and 'false' otherwise.
metricName : One of the metric names listed in this library's chart.
metricDirection : Direction of the metric, one of the following: "Long", "Short", "Spreading", "No direction".
metricType : Type of the metric. Possible values: "All", "Old", and "Other".
Returns: A ticker ID string usable with `request.security()` to fetch the specified Commitment of Traders data.
█ AVAILABLE METRICS
Different COT types provide different metrics. The table of all metrics available for each of the types can be found below.
+------------------------------+------------------------+
| Legacy (COT) Metric Names | Directions |
+------------------------------+------------------------+
| Open Interest | No direction |
| Noncommercial Positions | Long, Short, Spreading |
| Commercial Positions | Long, Short |
| Total Reportable Positions | Long, Short |
| Nonreportable Positions | Long, Short |
| Traders Total | No direction |
| Traders Noncommercial | Long, Short, Spreading |
| Traders Commercial | Long, Short |
| Traders Total Reportable | Long, Short |
| Concentration Gross LT 4 TDR | Long, Short |
| Concentration Gross LT 8 TDR | Long, Short |
| Concentration Net LT 4 TDR | Long, Short |
| Concentration Net LT 8 TDR | Long, Short |
+------------------------------+------------------------+
+-----------------------------------+------------------------+
| Disaggregated (COT2) Metric Names | Directions |
+-----------------------------------+------------------------+
| Open Interest | No Direction |
| Producer Merchant Positions | Long, Short |
| Swap Positions | Long, Short, Spreading |
| Managed Money Positions | Long, Short, Spreading |
| Other Reportable Positions | Long, Short, Spreading |
| Total Reportable Positions | Long, Short |
| Nonreportable Positions | Long, Short |
| Traders Total | No Direction |
| Traders Producer Merchant | Long, Short |
| Traders Swap | Long, Short, Spreading |
| Traders Managed Money | Long, Short, Spreading |
| Traders Other Reportable | Long, Short, Spreading |
| Traders Total Reportable | Long, Short |
| Concentration Gross LE 4 TDR | Long, Short |
| Concentration Gross LE 8 TDR | Long, Short |
| Concentration Net LE 4 TDR | Long, Short |
| Concentration Net LE 8 TDR | Long, Short |
+-----------------------------------+------------------------+
+-------------------------------+------------------------+
| Financial (COT3) Metric Names | Directions |
+-------------------------------+------------------------+
| Open Interest | No Direction |
| Dealer Positions | Long, Short, Spreading |
| Asset Manager Positions | Long, Short, Spreading |
| Leveraged Funds Positions | Long, Short, Spreading |
| Other Reportable Positions | Long, Short, Spreading |
| Total Reportable Positions | Long, Short |
| Nonreportable Positions | Long, Short |
| Traders Total | No Direction |
| Traders Dealer | Long, Short, Spreading |
| Traders Asset Manager | Long, Short, Spreading |
| Traders Leveraged Funds | Long, Short, Spreading |
| Traders Other Reportable | Long, Short, Spreading |
| Traders Total Reportable | Long, Short |
| Concentration Gross LE 4 TDR | Long, Short |
| Concentration Gross LE 8 TDR | Long, Short |
| Concentration Net LE 4 TDR | Long, Short |
| Concentration Net LE 8 TDR | Long, Short |
+-------------------------------+------------------------+
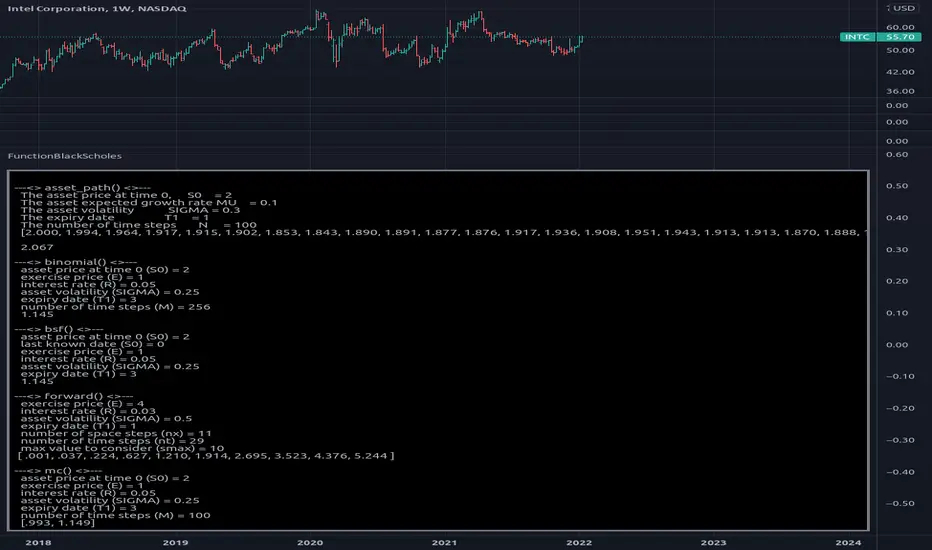
FunctionBlackScholesLibrary "FunctionBlackScholes"
Some methods for the Black Scholes Options Model, which demonstrates several approaches to the valuation of a European call.
// reference:
// people.math.sc.edu
// people.math.sc.edu
asset_path(s0, mu, sigma, t1, n) Simulates the behavior of an asset price over time.
Parameters:
s0 : float, asset price at time 0.
mu : float, growth rate.
sigma : float, volatility.
t1 : float, time to expiry date.
n : int, time steps to expiry date.
Returns: option values at each equal timed step (0 -> t1)
binomial(s0, e, r, sigma, t1, m) Uses the binomial method for a European call.
Parameters:
s0 : float, asset price at time 0.
e : float, exercise price.
r : float, interest rate.
sigma : float, volatility.
t1 : float, time to expiry date.
m : int, time steps to expiry date.
Returns: option value at time 0.
bsf(s0, t0, e, r, sigma, t1) Evaluates the Black-Scholes formula for a European call.
Parameters:
s0 : float, asset price at time 0.
t0 : float, time at which the price is known.
e : float, exercise price.
r : float, interest rate.
sigma : float, volatility.
t1 : float, time to expiry date.
Returns: option value at time 0.
forward(e, r, sigma, t1, nx, nt, smax) Forward difference method to value a European call option.
Parameters:
e : float, exercise price.
r : float, interest rate.
sigma : float, volatility.
t1 : float, time to expiry date.
nx : int, number of space steps in interval (0, L).
nt : int, number of time steps.
smax : float, maximum value of S to consider.
Returns: option values for the european call, float array of size ((nx-1) * (nt+1)).
mc(s0, e, r, sigma, t1, m) Uses Monte Carlo valuation on a European call.
Parameters:
s0 : float, asset price at time 0.
e : float, exercise price.
r : float, interest rate.
sigma : float, volatility.
t1 : float, time to expiry date.
m : int, time steps to expiry date.
Returns: confidence interval for the estimated range of valuation.
FunctionMinkowskiDistanceLibrary "FunctionMinkowskiDistance"
Method for Minkowski Distance,
The Minkowski distance or Minkowski metric is a metric in a normed vector space
which can be considered as a generalization of both the Euclidean distance and
the Manhattan distance.
It is named after the German mathematician Hermann Minkowski.
reference: en.wikipedia.org
double(point_ax, point_ay, point_bx, point_by, p_value) Minkowsky Distance for single points.
Parameters:
point_ax : float, x value of point a.
point_ay : float, y value of point a.
point_bx : float, x value of point b.
point_by : float, y value of point b.
p_value : float, p value, default=1.0(1: manhatan, 2: euclidean), does not support chebychev.
Returns: float
ndim(point_x, point_y, p_value) Minkowsky Distance for N dimensions.
Parameters:
point_x : float array, point x dimension attributes.
point_y : float array, point y dimension attributes.
p_value : float, p value, default=1.0(1: manhatan, 2: euclidean), does not support chebychev.
Returns: float

regressLibrary "regress"
produces the slope (beta), y-intercept (alpha) and coefficient of determination for a linear regression
regress(x, y, len) regress: computes alpha, beta, and r^2 for a linear regression of y on x
Parameters:
x : the explaining (independent) variable
y : the dependent variable
len : use the most recent "len" values of x and y
Returns: : alpha is the x-intercept, beta is the slope, an r2 is the coefficient of determination
Note: the chart does not show anything, use the return values to compute model values in your own application, if you wish.

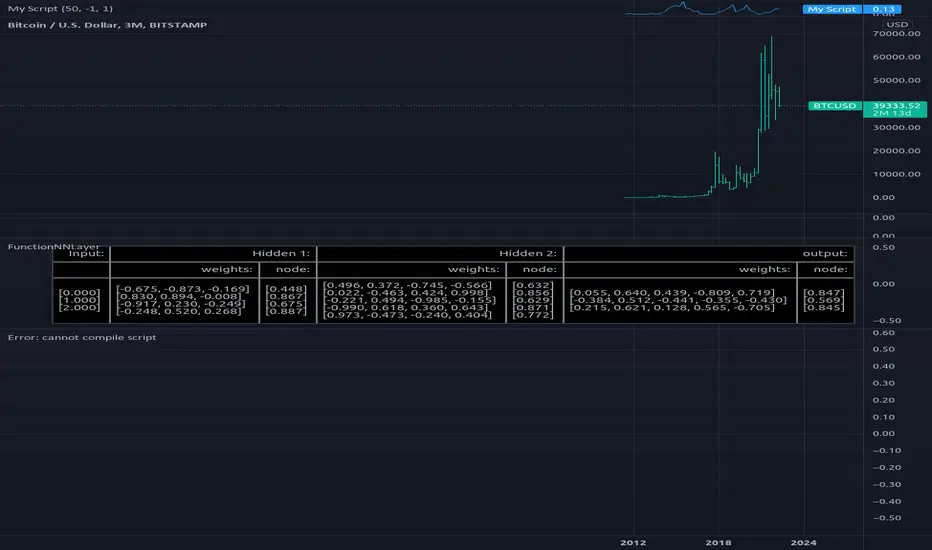
FunctionNNLayerLibrary "FunctionNNLayer"
Generalized Neural Network Layer method.
function(inputs, weights, n_nodes, activation_function, bias, alpha, scale) Generalized Layer.
Parameters:
inputs : float array, input values.
weights : float array, weight values.
n_nodes : int, number of nodes in layer.
activation_function : string, default='sigmoid', name of the activation function used.
bias : float, default=1.0, bias to pass into activation function.
alpha : float, default=na, if required to pass into activation function.
scale : float, default=na, if required to pass into activation function.
Returns: float
FunctionNNPerceptronLibrary "FunctionNNPerceptron"
Perceptron Function for Neural networks.
function(inputs, weights, bias, activation_function, alpha, scale) generalized perceptron node for Neural Networks.
Parameters:
inputs : float array, the inputs of the perceptron.
weights : float array, the weights for inputs.
bias : float, default=1.0, the default bias of the perceptron.
activation_function : string, default='sigmoid', activation function applied to the output.
alpha : float, default=na, if required for activation.
scale : float, default=na, if required for activation.
@outputs float

MLActivationFunctionsLibrary "MLActivationFunctions"
Activation functions for Neural networks.
binary_step(value) Basic threshold output classifier to activate/deactivate neuron.
Parameters:
value : float, value to process.
Returns: float
linear(value) Input is the same as output.
Parameters:
value : float, value to process.
Returns: float
sigmoid(value) Sigmoid or logistic function.
Parameters:
value : float, value to process.
Returns: float
sigmoid_derivative(value) Derivative of sigmoid function.
Parameters:
value : float, value to process.
Returns: float
tanh(value) Hyperbolic tangent function.
Parameters:
value : float, value to process.
Returns: float
tanh_derivative(value) Hyperbolic tangent function derivative.
Parameters:
value : float, value to process.
Returns: float
relu(value) Rectified linear unit (RELU) function.
Parameters:
value : float, value to process.
Returns: float
relu_derivative(value) RELU function derivative.
Parameters:
value : float, value to process.
Returns: float
leaky_relu(value) Leaky RELU function.
Parameters:
value : float, value to process.
Returns: float
leaky_relu_derivative(value) Leaky RELU function derivative.
Parameters:
value : float, value to process.
Returns: float
relu6(value) RELU-6 function.
Parameters:
value : float, value to process.
Returns: float
softmax(value) Softmax function.
Parameters:
value : float array, values to process.
Returns: float
softplus(value) Softplus function.
Parameters:
value : float, value to process.
Returns: float
softsign(value) Softsign function.
Parameters:
value : float, value to process.
Returns: float
elu(value, alpha) Exponential Linear Unit (ELU) function.
Parameters:
value : float, value to process.
alpha : float, default=1.0, predefined constant, controls the value to which an ELU saturates for negative net inputs. .
Returns: float
selu(value, alpha, scale) Scaled Exponential Linear Unit (SELU) function.
Parameters:
value : float, value to process.
alpha : float, default=1.67326324, predefined constant, controls the value to which an SELU saturates for negative net inputs. .
scale : float, default=1.05070098, predefined constant.
Returns: float
exponential(value) Pointer to math.exp() function.
Parameters:
value : float, value to process.
Returns: float
function(name, value, alpha, scale) Activation function.
Parameters:
name : string, name of activation function.
value : float, value to process.
alpha : float, default=na, if required.
scale : float, default=na, if required.
Returns: float
derivative(name, value, alpha, scale) Derivative Activation function.
Parameters:
name : string, name of activation function.
value : float, value to process.
alpha : float, default=na, if required.
scale : float, default=na, if required.
Returns: float
MLLossFunctionsLibrary "MLLossFunctions"
Methods for Loss functions.
mse(expects, predicts) Mean Squared Error (MSE) " MSE = 1/N * sum ((y - y')^2) ".
Parameters:
expects : float array, expected values.
predicts : float array, prediction values.
Returns: float
binary_cross_entropy(expects, predicts) Binary Cross-Entropy Loss (log).
Parameters:
expects : float array, expected values.
predicts : float array, prediction values.
Returns: float
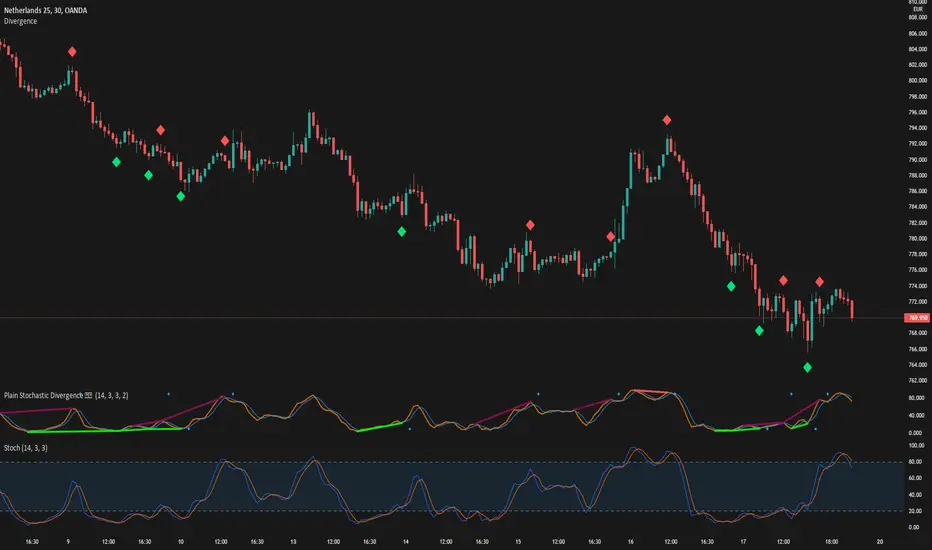
DivergenceLibrary "Divergence"
Calculates a divergence between 2 series
bullish(_src, _low, depth) Calculates bullish divergence
Parameters:
_src : Main series
_low : Comparison series (`low` is used if no argument is supplied)
depth : Fractal Depth (`2` is used if no argument is supplied)
Returns: 2 boolean values for regular and hidden divergence
bearish(_src, _high, depth) Calculates bearish divergence
Parameters:
_src : Main series
_high : Comparison series (`high` is used if no argument is supplied)
depth : Fractal Depth (`2` is used if no argument is supplied)
Returns: 2 boolean values for regular and hidden divergence
I created this library to plug and play divergences in any code.
You can create a divergence indicator from any series you like.
Fractals are used to pinpoint the edge of the series. The higher the depth, the slower the divergence updates get.
My Plain Stochastic Divergence uses the same calculation. Watch it in action.
FunctionPeakDetectionLibrary "FunctionPeakDetection"
Method used for peak detection, similar to MATLAB peakdet method
function(sample_x, sample_y, delta) Method for detecting peaks.
Parameters:
sample_x : float array, sample with indices.
sample_y : float array, sample with data.
delta : float, positive threshold value for detecting a peak.
Returns: tuple with found max/min peak indices.

DailyDeviationLibrary "DailyDeviation"
Helps in determining the relative deviation from the open of the day compared to the high or low values.
hlcDeltaArrays(daysPrior, maxDeviation, spec, res) Retuns a set of arrays representing the daily deviation of price for a given number of days.
Parameters:
daysPrior : Number of days back to get the close from.
maxDeviation : Maximum deviation before a value is considered an outlier. A value of 0 will not filter results.
spec : session.regular (default), session.extended or other time spec.
res : The resolution (default = '1440').
Returns: Where OH = Open vs High, OL = Open vs Low, and OC = Open vs Close
fromOpen(daysPrior, maxDeviation, comparison, spec, res) Retuns a value representing the deviation from the open (to the high or low) of the current day given number of days to measure from.
Parameters:
daysPrior : Number of days back to get the close from.
maxDeviation : Maximum deviation before a value is considered an outlier. A value of 0 will not filter results.
comparison : The value use in comparison to the current open for the day.
spec : session.regular (default), session.extended or other time spec.
res : The resolution (default = '1440').
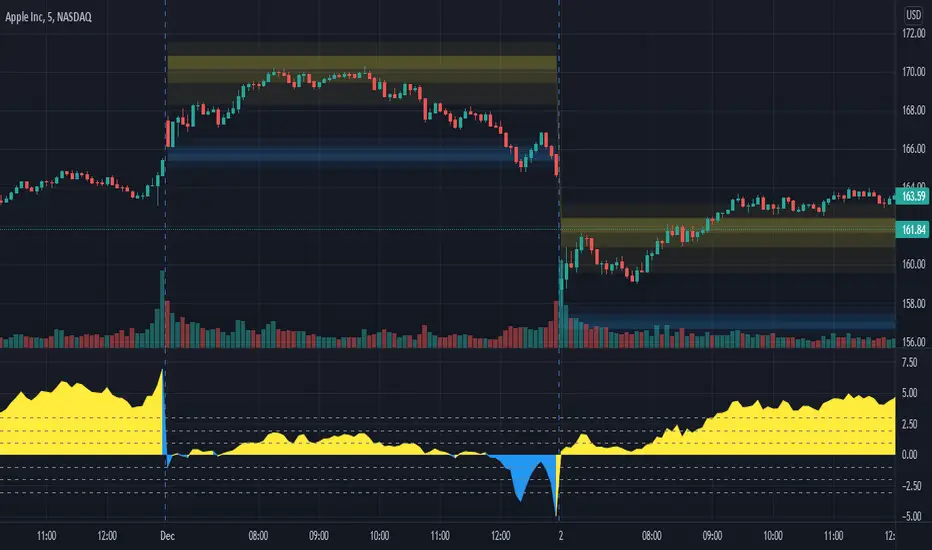
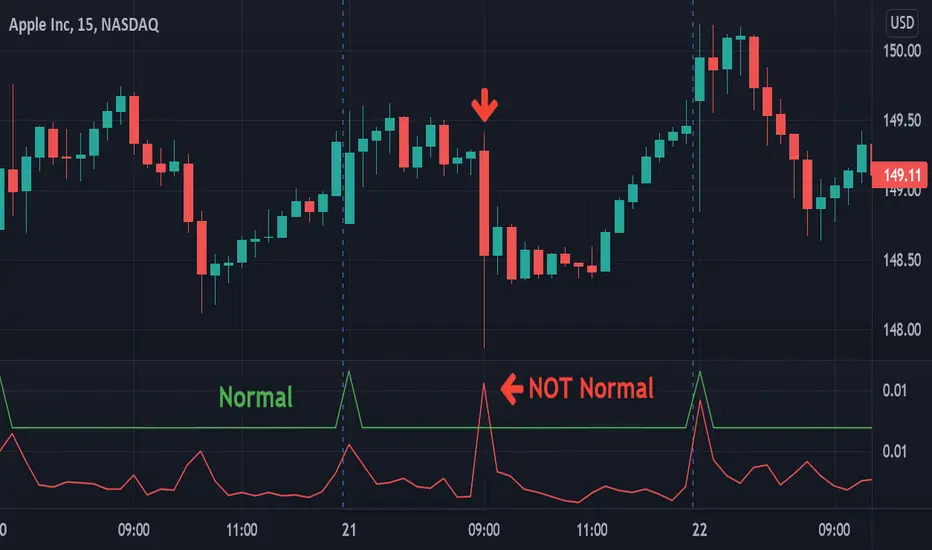
VolatilityLibrary "Volatility"
Functions for determining if volatility (true range) is within or exceeds normal.
The "True Range" (ta.tr) is used for measuring volatility.
Values are normalized by the volume adjusted weighted moving average (VAWMA) to be more like percent moves than price.
current(len) Returns the current price adjusted volatitlity ratio.
Parameters:
len : Number of bars to get a volume adjusted weighted average price.
normal(len, maxDeviation, level, gapDays, spec, res) Returns the normal upper range of volatility. Compensates for overnight gaps within a regular session.
Parameters:
len : Number of bars to measure volatility.
maxDeviation : The limit of volatility before considered an outlier.
level : The amount of standard deviation after cleaning outliers to be considered within normal.
gapDays : The number of days in the past to measure overnight gap volaility.
spec : session.regular (default), session.extended or other time spec.
res : The resolution (default = '1440').
isNormal(len, maxDeviation, level, gapDays, spec, res) Returns true if the volatility (true range) is within normal levels. Compensates for overnight gaps within a regular session.
Parameters:
len : Number of bars to measure volatility.
maxDeviation : The limit of volatility before considered an outlier.
level : The amount of standard deviation after cleaning outliers to be considered within normal.
gapDays : The number of days in the past to measure overnight gap volaility.
spec : session.regular (default), session.extended or other time spec.
res : The resolution (default = '1440').
severity(len, maxDeviation, level, gapDays, spec, res) Returns ratio of the current value to the normal value. Compensates for overnight gaps within a regular session.
Parameters:
len : Number of bars to measure volatility.
maxDeviation : The limit of volatility before considered an outlier.
level : The amount of standard deviation after cleaning outliers to be considered within normal.
gapDays : The number of days in the past to measure overnight gap volaility.
spec : session.regular (default), session.extended or other time spec.
res : The resolution (default = '1440').
DataCleanerLibrary "DataCleaner"
Functions for acquiring outlier levels and acquiring a cleaned version of a series.
outlierLevel(src, len, level) Gets the (standard deviation) outlier level for a given series.
Parameters:
src : The series to average and add a multiple of the standard deviation to.
len : The The number of bars to measure.
level : The positive or negative multiple of the standard deviation to apply to the average. A positive number will be the upper boundary and a negative number will be the lower boundary.
Returns: The average of the series plus the multiple of the standard deviation.
cleanUsing(src, result, len, maxDeviation) Returns an array representing the result series with (outliers provided by the source) removed.
Parameters:
src : The source series to read from.
result : The result series.
len : The maximum size of the resultant array.
maxDeviation : The positive or negative multiple of the standard deviation to apply to the average. A positive number will be the upper boundary and a negative number will be the lower boundary.
Returns: An array containing the cleaned series.
clean(src, len, maxDeviation) Returns an array representing the source series with outliers removed.
Parameters:
src : The source series to read from.
len : The maximum size of the resultant array.
maxDeviation : The positive or negative multiple of the standard deviation to apply to the average. A positive number will be the upper boundary and a negative number will be the lower boundary.
Returns: An array containing the cleaned series.
outlierLevelAdjusted(src, level, len, maxDeviation) Gets the (standard deviation) outlier level for a given series after a single pass of removing any outliers.
Parameters:
src : The series to average and add a multiple of the standard deviation to.
level : The positive or negative multiple of the standard deviation to apply to the average. A positive number will be the upper boundary and a negative number will be the lower boundary.
len : The The number of bars to measure.
maxDeviation : The optional standard deviation level to use when cleaning the series. The default is the value of the provided level.
Returns: The average of the series plus the multiple of the standard deviation.

benchLibrary "bench"
A simple banchmark library to analyse script performance and bottlenecks.
Very useful if you are developing an overly complex application in Pine Script, or trying to optimise a library / function / algorithm...
Supports artificial looping benchmarks (of fast functions)
Supports integrated linear benchmarks (of expensive scripts)
One important thing to note is that the Pine Script compiler will completely ignore any calculations that do not eventually produce chart output. Therefore, if you are performing an artificial benchmark you will need to use the bench.reference(value) function to ensure the calculations are executed.
Please check the examples towards the bottom of the script.
Quick Reference
(Be warned this uses non-standard space characters to get the line indentation to work in the description!)
```
// Looping benchmark style
benchmark = bench.new(samples = 500, loops = 5000)
data = array.new_int()
if bench.start(benchmark)
while bench.loop(benchmark)
array.unshift(data, timenow)
bench.mark(benchmark)
while bench.loop(benchmark)
array.unshift(data, timenow)
bench.mark(benchmark)
while bench.loop(benchmark)
array.unshift(data, timenow)
bench.stop(benchmark)
bench.reference(array.get(data, 0))
bench.report(benchmark, '1x array.unshift()')
// Linear benchmark style
benchmark = bench.new()
data = array.new_int()
bench.start(benchmark)
for i = 0 to 1000
array.unshift(data, timenow)
bench.mark(benchmark)
for i = 0 to 1000
array.unshift(data, timenow)
bench.stop(benchmark)
bench.reference(array.get(data, 0))
bench.report(benchmark,'1000x array.unshift()')
```
Detailed Interface
new(samples, loops) Initialises a new benchmark array
Parameters:
samples : int, the number of bars in which to collect samples
loops : int, the number of loops to execute within each sample
Returns: int , the benchmark array
active(benchmark) Determing if the benchmarks state is active
Parameters:
benchmark : int , the benchmark array
Returns: bool, true only if the state is active
start(benchmark) Start recording a benchmark from this point
Parameters:
benchmark : int , the benchmark array
Returns: bool, true only if the benchmark is unfinished
loop(benchmark) Returns true until call count exceeds bench.new(loop) variable
Parameters:
benchmark : int , the benchmark array
Returns: bool, true while looping
reference(number, string) Add a compiler reference to the chart so the calculations don't get optimised away
Parameters:
number : float, a numeric value to reference
string : string, a string value to reference
mark(benchmark, number, string) Marks the end of one recorded interval and the start of the next
Parameters:
benchmark : int , the benchmark array
number : float, a numeric value to reference
string : string, a string value to reference
stop(benchmark, number, string) Stop the benchmark, ending the final interval
Parameters:
benchmark : int , the benchmark array
number : float, a numeric value to reference
string : string, a string value to reference
report(Prints, benchmark, title, text_size, position)
Parameters:
Prints : the benchmarks results to the screen
benchmark : int , the benchmark array
title : string, add a custom title to the report
text_size : string, the text size of the log console (global size vars)
position : string, the position of the log console (global position vars)
unittest_bench(case) Cache module unit tests, for inclusion in parent script test suite. Usage: bench.unittest_bench(__ASSERTS)
Parameters:
case : string , the current test case and array of previous unit tests (__ASSERTS)
unittest(verbose) Run the bench module unit tests as a stand alone. Usage: bench.unittest()
Parameters:
verbose : bool, optionally disable the full report to only display failures

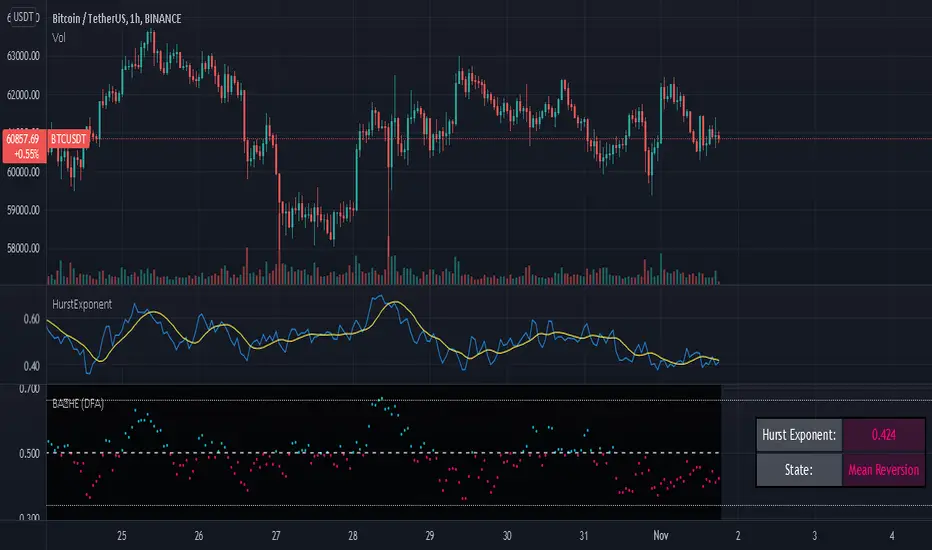
HurstExponentLibrary "HurstExponent"
Library to calculate Hurst Exponent refactored from Hurst Exponent - Detrended Fluctuation Analysis
demean(src) Calculates a series subtracted from the series mean.
Parameters:
src : The series used to calculate the difference from the mean (e.g. log returns).
Returns: The series subtracted from the series mean
cumsum(src, length) Calculates a cumulated sum from the series.
Parameters:
src : The series used to calculate the cumulative sum (e.g. demeaned log returns).
length : The length used to calculate the cumulative sum (e.g. 100).
Returns: The cumulative sum of the series as an array
aproximateLogScale(scale, length) Calculates an aproximated log scale. Used to save sample size
Parameters:
scale : The scale to aproximate.
length : The length used to aproximate the expected scale.
Returns: The aproximated log scale of the value
rootMeanSum(cumulativeSum, barId, numberOfSegments) Calculates linear trend to determine error between linear trend and cumulative sum
Parameters:
cumulativeSum : The cumulative sum array to regress.
barId : The barId for the slice
numberOfSegments : The total number of segments used for the regression calculation
Returns: The error between linear trend and cumulative sum
averageRootMeanSum(cumulativeSum, barId, length) Calculates the Root Mean Sum Measured for each block (e.g the aproximated log scale)
Parameters:
cumulativeSum : The cumulative sum array to regress and determine the average of.
barId : The barId for the slice
length : The length used for finding the average
Returns: The average root mean sum error of the cumulativeSum
criticalValues(length) Calculates the critical values for a hurst exponent for a given length
Parameters:
length : The length used for finding the average
Returns: The critical value, upper critical value and lower critical value for a hurst exponent
slope(cumulativeSum, length) Calculates the hurst exponent slope measured from root mean sum, scaled to log log plot using linear regression
Parameters:
cumulativeSum : The cumulative sum array to regress and determine the average of.
length : The length used for the hurst exponent sample size
Returns: The slope of the hurst exponent
smooth(src, length) Smooths input using advanced linear regression
Parameters:
src : The series to smooth (e.g. hurst exponent slope)
length : The length used to smooth
Returns: The src smoothed according to the given length
exponent(src, hurstLength) Wrapper function to calculate the hurst exponent slope
Parameters:
src : The series used for returns calculation (e.g. close)
hurstLength : The length used to calculate the hurst exponent (should be greater than 50)
Returns: The src smoothed according to the given length
MomentsLibrary "Moments"
Based on Moments (Mean,Variance,Skewness,Kurtosis) . Rewritten for Pinescript v5.
logReturns(src) Calculates log returns of a series (e.g log percentage change)
Parameters:
src : Source to use for the returns calculation (e.g. close).
Returns: Log percentage returns of a series
mean(src, length) Calculates the mean of a series using ta.sma
Parameters:
src : Source to use for the mean calculation (e.g. close).
length : Length to use mean calculation (e.g. 14).
Returns: The sma of the source over the length provided.
variance(src, length) Calculates the variance of a series
Parameters:
src : Source to use for the variance calculation (e.g. close).
length : Length to use for the variance calculation (e.g. 14).
Returns: The variance of the source over the length provided.
standardDeviation(src, length) Calculates the standard deviation of a series
Parameters:
src : Source to use for the standard deviation calculation (e.g. close).
length : Length to use for the standard deviation calculation (e.g. 14).
Returns: The standard deviation of the source over the length provided.
skewness(src, length) Calculates the skewness of a series
Parameters:
src : Source to use for the skewness calculation (e.g. close).
length : Length to use for the skewness calculation (e.g. 14).
Returns: The skewness of the source over the length provided.
kurtosis(src, length) Calculates the kurtosis of a series
Parameters:
src : Source to use for the kurtosis calculation (e.g. close).
length : Length to use for the kurtosis calculation (e.g. 14).
Returns: The kurtosis of the source over the length provided.
skewnessStandardError(sampleSize) Estimates the standard error of skewness based on sample size
Parameters:
sampleSize : The number of samples used for calculating standard error.
Returns: The standard error estimate for skewness based on the sample size provided.
kurtosisStandardError(sampleSize) Estimates the standard error of kurtosis based on sample size
Parameters:
sampleSize : The number of samples used for calculating standard error.
Returns: The standard error estimate for kurtosis based on the sample size provided.
skewnessCriticalValue(sampleSize) Estimates the critical value of skewness based on sample size
Parameters:
sampleSize : The number of samples used for calculating critical value.
Returns: The critical value estimate for skewness based on the sample size provided.
kurtosisCriticalValue(sampleSize) Estimates the critical value of kurtosis based on sample size
Parameters:
sampleSize : The number of samples used for calculating critical value.
Returns: The critical value estimate for kurtosis based on the sample size provided.

pNRTRLibrary "pNRTR"
Provides functions for calculating Nick Rypock Trailing Reverse (NRTR) trend values with higher precision offsets for both low, and high points rather than the standard single offset.
pnrtr(float low_offset = 0.2, float high_offset = 0.2, float value = close)
low_offset
Offset used for nrtr low_point calculations. Default is 0.2.
high_offset
Offset used for nrtr high_point calculations. Default is 0.2.
value
Variable used for nrtr point calculations. Default is close.
