Stochastic Oscillator

inwCoin Stoch+BB AlertSimple alert to go along with the inwCoin Stoch+BB Strategy
Please not that the alerts are persistent, if you already enter the position,
just ignore the rest of the same alert until the opposite alert show up
( long then short / or short then long , if change, just close and enter opposite position )
You can set the alert and let it tell you to iOS app via TradingView app ( yey! )
Please note that, if you don't have bot to track your trailing start/stop. you have to enter the TP/SL manually ( also tracking the position )
So... be careful to follow this alert. just try it with small amount of money first.
and make sure to set stop loss every time because OKEX is a portfolio killer if you don't have any stop loss.

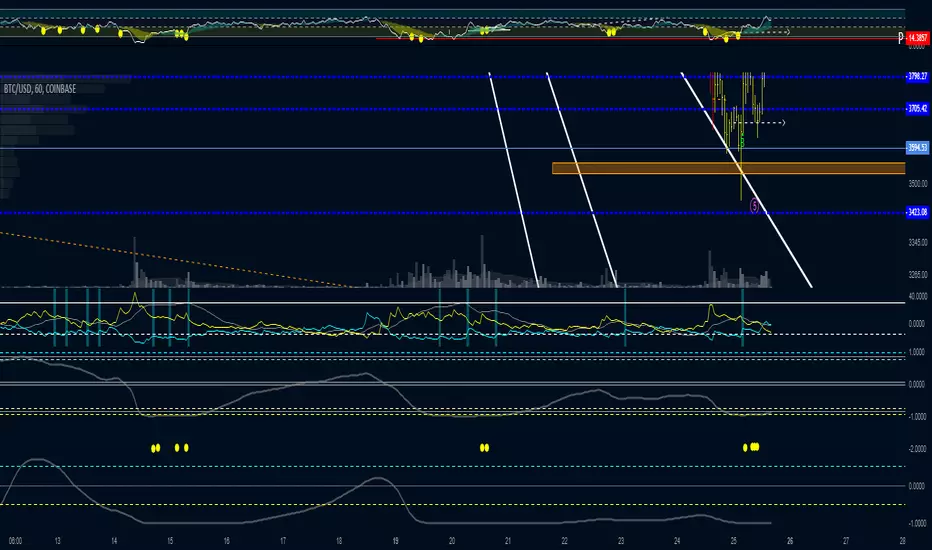
inwCoin BB+Stoch StrategyStrategy using BB and Stoch for entry, trailing for exit.
-------
IDEA
-------
* If price move to reach upper BB and pull back and cross down middle line, and stoch is on OB zone, it will enter short.
* If price move to reach lower BB and pull back and cross up middle line, and stoch is on OS zone, it will enter long.
* Stoch help filter out the bad entry from BB logic, helping with high win trade %
* I smooth out stoch by using 30 length and found out it give better profit%
=============================================
Test Data Detail
=============================================
Exchange : OKEX
Coin : BTCUSD3M
Timeframe : 1H
Date range : 2018/1/1 - 2019/1
For : Trailing with bot ( If you have one :P )
Config
Trade % = 20 ( You can increase trade size of your total port but it will get you into more risky trade. ( but yes, more profit ) ... u can increase trade size if you have enough profit
Trailing Start = 20 ( If you can write bot, it will start trailing when the profit % reach this value )
Trailing Stop = 5 (If you can write bot, it will take profit if the profit drop below this value from trailing start.)
Take Profit = 100 (It will set fixed TP for whipsaw case ( rarely reach this target ) )
Stop % = 50 ( so this trade is RR = 2 nice! )
Leverage = 20 ( so we can withstand the price fluctuation and not get liquidated, if you trade spot, please choose 1 also, please adjust TP and stop accordingly eg. leverage 1 / TP = 20 / SL = 10 )
Trade Direction = Both ( for margin market, if you want to trade spot like Binance you can choose long only )
Stoch Oversold Zone = 30 ( if stoch stay below or equal this value, it is oversold )
Stoch Overbought Zone = 50 ( if stoch stay above or equal this value, it is overbought )
Stoch Length = 30 ( the more length, the more smooth out of Stoch )
SmoothK1 = 1 ( the smoothness of K )

Top GoonTOP GOON indicator
Inverse Fisher Stochastic + Momentum
If you know range rules you will love the TGI
Midpoint+ is BULLISH
Midpoint- is BEARISH
Cyan+ EXTREME BULL
Yellow- EXTREME BEAR
Watch Cyan/Yellow to break for volatility
new versions will be made and updated hear :)
TG is shown on the bottom
Momentum Index by @satoshiheavy is above that
and on top is Satoshi's RSI by @satoshiheavy
Twitter:
@bitcoinTAplus
@satoshiiheavy

Relative Strength Index & Stochastic RSIThis script calculates both RSI (Relative Strength Index) and Stock (Stochastic) RSI Indicators, and plots them with a distinctive background on the same graph. The colors were chosen to be very easy on the eyes.
I published it as a way to give back to this community. Use your own judgement when trading, I am not responsible for any losses resulting from the use of my script.
Feel free to modify the script with no attribution.
StochCMO - Stochastic CMO [SHK]StochCMO is the combination of Stochastic and CMO (Chande Momentum Oscillator).
The StochCMO is an indicator used in technical analysis that ranges between zero and one and is created by applying the Stochastic Oscillator formula to a set of Chande Momentum Oscillator (CMO) values rather than standard price data. Using CMO values within the Stochastic formula gives traders an idea of whether the current CMO value is overbought or oversold - a measure that becomes specifically useful when the CMO value is confined between its signal levels of 20 and 80.
Usage:
The usage of StochCMO is similar to StochRSI.
StochCMO vs StochRSI:
The difference between these indicators can be realized by comparing CMO & RSI:
CMO is similar to the Relative Strength Index (RSI) except that it measures momentum on both up days and down days. The CMO also does not use internal smoothing and thus does not obscure short-term extremes in momentum. As a result, the CMO often reaches over bought and over sold areas more regularly than momentum indicators, such as the RSI, that have internal smoothing.
Hope it helps you.

Fibonacci Gann Support/Resistance (FGSR) Stochastic Cloud[cI8DH]This script shows Fib and Gann levels. It is basically reverse engineered stochastic. Default levels include golden ratios (0.618 and 0.382) and Gann ratios (0, 0.25, 0.5, 0.75, 1.0). There are two methods of calculating swings, one is based on time alone as in standard stochastic and another is partially time dependent. A comparison is shown in the chart below.
I found 0.42 and 0.58 are interesting retracement levels for BTC on long term swings as shown in the chart below.
Note that you should tune the length based on the instrument you are trading.
Here is a TL;DR list of my indicators to save you some time from looking at my obsolete indicators.

WH RSIRSI modified to candles with stoch overlay. Default settings at 14 but recommend 5 if scalping for more sensitive movements. Green zone is bullish zone, blue is neutral, and red is bearish for both stoch and rsi.

TREND REVERSAL DETECTOR TR detector: Trade with the trend not against it. This indicator will warn you in advance before the market changes its direction.

VolumeS as stochv1just to show a concept . I use volume S to make it as stoch and add to it MTF function
B=buy
S=sell
D=down
if you do not like the MTF fuction just remove it from code or put the time frame of graph to be exact as MTF one
I did not add alert as it just a concept idea , to make it more complex it easy if you add more indicators to it and then compare the signals
have fun

Kojirokousi Daijyunkan StochasticsKojirokousi Daijyunkan Stochastics
Original indicator by Kojirokousi
Short term trading indicator
This indicator can be combined with Kojirokousi Daijyunkan EMA
Evolution of stochastics
小次郎講師 大循環ストキャスティクス(大スト)
小次郎講師によるオリジナルのインジケーター
短期トレード
移動平均線大循環分析と併用することもできる
ストキャスティクスを発展させたもの

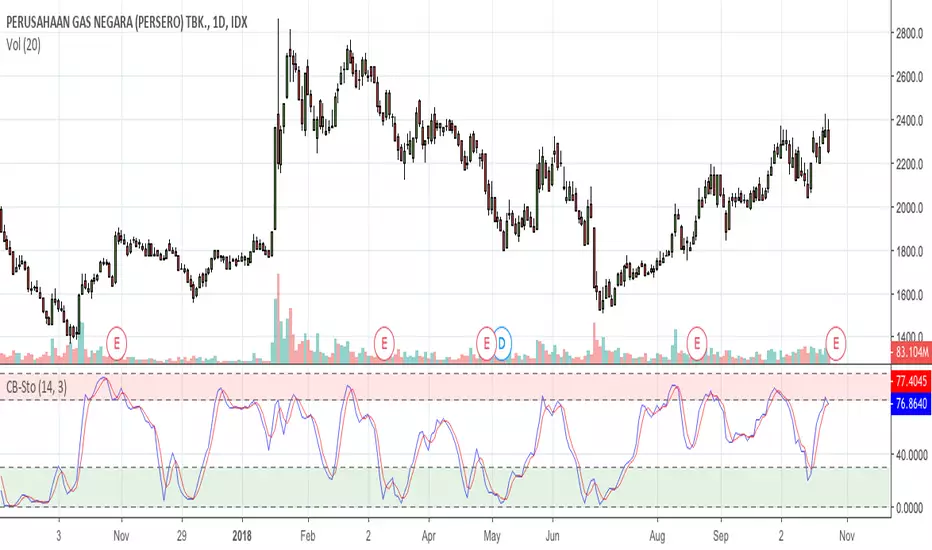
ChartBite Swing Indicator - LiteObjective
This indicator will be for Swing Trader, to hold stock for 2-10 candles.
It will generate entry signal (long) by using Trend and Stochastic Crossing in Oversold Area (below 30) and no sell signal but until crossing down the StopLoss (TrailStop)
Market / Timeframe
I create this indicator mainly for Indonesian Market COMPOSITE (Indonesian Stock Exchange)
using Daily Chart and/or Hourly Chart
Trend
This indicator will use long and short moving average to detect trend,
ShortMA above LongMa means Uptrend and vice versa.
Uptrend means it's safe for entry position.
Downtrend will be shown clearly by red area on chart. (not recommended for entry position)
Buy Signal
Buy signal will kick in, when
- Stochastic cross up on Oversold area (below 30)
- ShortMA > LongMA
- LastPrice > LongMA
Sell Signal
We use StopLoss (Trailstop) which comes from the Lowest Low of 2 or 3 last Candle
Sell will trigger when Low < StopLoss
This script is best used together with "ChartBite Swing Stochastic - Lite" to give a better view on how Buy Signal created.
All parameters and colors are adjustable, and can be flexible enough to address your preferences.
This indicator is free to use but It's invite only script.
To use this indicator, please message me, and I'll grant access to you.
Success Always and Profit Always,
Salam sukses dan Cuan Selalu.
regards,
Tommy Yu

ChartBite Swing Stochastic - LiteThe script is simply to show Stochastic with overbought and oversold area with colors.
Red : Overbought Area (level 80-100)
Green : Oversold Area (level 0-20)
All colors and parameters can be changed to your needs, but I suggest leave it as default.
The crossing in oversold are is a timing to entry long.
and the crossing in overbought area is to entry short (to sell)
ChartBite Swing Stochastic - Lite can be combined with the ChartBite Swing Indicator - Lite to create signals.
This script is Invite Only but It's free to use, just send me message, and I'll grant access to you.
Success and Profit Always
Salam Sukses dan Cuan Selalu
Trader Set CycleA very heavily modified stochastic. As you can see in the picture, not only the range of movement is changes, but also, it's not clamped at 100 and will not clamp at -100. No more nasty noises when stochastic "sticks" to 100 when the price is constantly goes up or vice versa.
Please, don't ask for access, only my students from my classes will have access to this indicator, at least for time being. If at any time in future I wish to sell, you will find the price and how to buy in the comments bellow.
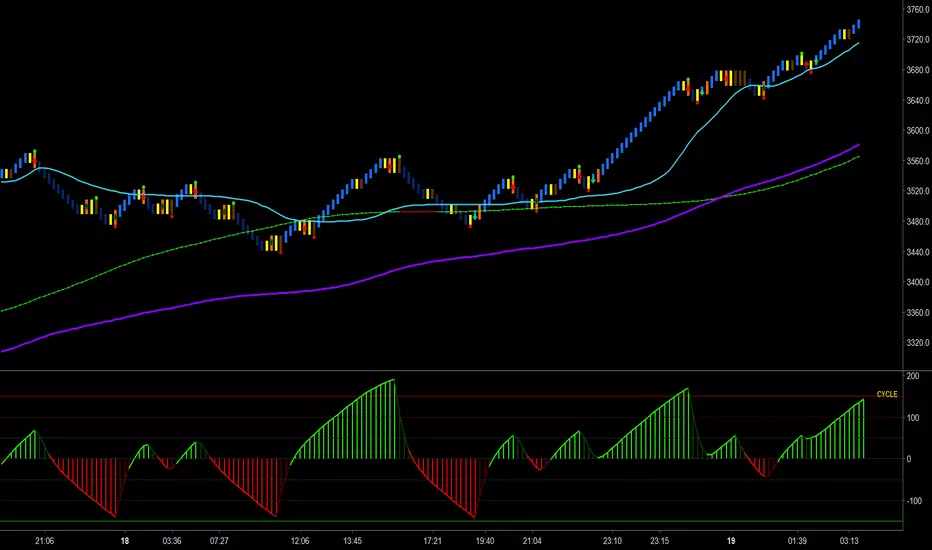
Schaff Trend CycleThis indicator was originally developed by Doug Schaff in the 1990s (published in 2008).
Stochastic (public) by mnazrizversion 1.0
Green when
a) K line cross up Oversold line
b) K line meet D line
Red when
a) K line cross down Overbought line
b) D line meet K line

Stochastic & MACD Strategy Ver 1.0This strategy is inspired by ChartArt and jasonluk28.
The following input changes from the initial ChartArt version to achieve higher stability and profit:
Fast MA Len:11
Slow MA len: 24
Stoch Len: 20
No difference is found in minor changes (+-10) lv. of overbought/oversold
It works above 40% winning rate in Heng Heng Index, Shanghai Composite, Dow Jones Industrial Averge, S&P 500 NASDAQ, VT (World Total Market) and in 15 mins chart
Profit: above ~10 to 30% in less than 1year backtest for most major indice of China and US and ~62% in Heng Seng Index (Hong Kong) & 40.5% in SZSE Composite (Shen Zhen)
P.S. Profit: 700 (Tencent) +150.5%, 939 (CCB) +66.5%, 1299 (AIA) +45%, 2628 (CLIC) +41%, 1 (CK Hutchison) +31%
NFLX +82.5%, BABA +55.5%, AMZN +44%, GOOG +38%, MCD +24.5%
However, Loss in FB -19% , AMD -38.5%
Not suitable for stocks with great influences in News or Events ???
RSI / Stoch / SRSI / MFI / Aroon Overlay [SigmaDraconis]Combines 4 popular indicators (RSI, Stoch, SRSI, MFI) and 1 peculiar one (Aroon) in 1 for those who want to save indicators but not only.
This is an evolution of my (simpler) "RSI / Stoch / Stoch RSI (SRSI) Overlay " that you can find on my scripts.
Added bands for oversold/overbought areas (70/30 common for RSI and 80/20 for SRSI and MFI), as well as a middle 50 horizontal line.
Neutral bands around 55-45 added as well that can be hidden for less clutter. I also recommend a more transparent coloring for these since Pine script doesn't allow default transparency for horizontal lines.
By default only RSI and Stoch are activated, you can activate Aroon, MFI and SRSI on the inputs window.
Some extra notes:
* RSI, Stoch and MFI can help to strengthen one's decision as well as Aroon to predict a possible trend reversal, SRSI can show when RSI has high probability of being topped or bottomed when oversold/overbought but don't forget to look at volume and how the trend progresses that can keep SRSI above 80 or below 20 while RSI and price continues to trend, divergences are most helpful here to find possible reversal areas.
* This chart depicts some interesting divergences, as well as Stoch tops and bottoms and confluences between RSI/MFI and Stoch on some over-extended tops and bottoms that shown being good reversal zones.
RSI resistances are shown as well, failing to break above 60 or the neutral zone (this is a bearish BTC trend chart after all) or failing to gain support to break up certain levels (RSI notes a more bullish trend when consistently above 60 and more bearish below 40).
If you like it and use it to profit, please tip me below :)
Tip jars:
BTC: 15nMBiEGVrdGcu9C1h6QRcTNRvugHkqrMQ
ETH: 0xC33845946c48B61fBCbEA0367ec2238CaF2b73bc
BTS: sigma-draconis

Inside Bar Alert I need help!!! I created the alert but it triggering during the formation not once it has printed. Does anyone know who to make it trigger the alert once the inside bar is complete and make it plot an arrow when the inside bar has formed?

[ProfitTrailer] Stoch StudyProfitTrailer buy/sell study for STOCH strategy.
The script highlights the regions where trailing is most likely to succeed.
DiNapoli Bundle Oscillators 3-in-1DiNapoli Oscillators 3-in-1 is a Bundle that includes the 3 oscillators used by DiNapoli in just 1 single indicator :
DiNapoli MACD (Dema)
DiNapoli Preferred Stochastic
DiNapoli Detrended Oscillator (DOSC)
This Bundle version includes the following features :
Ability to select which Oscillator to plot: MACD, Stochastic or Detrended
Show/Hide the Oscillation Lines
Show Crosses with Signal Line
Add a label to each oscillator for ease of identification
Adapt OB/OS Factor Ratio to each Market
Show OB/OS Levels
Show Preceding OB/OS Cloud
Show Divergences (experimental)
For convenience it also includes Custom Alerts . Now it is possible to get alerts on:
Oscillator Cross
Bullish Oscillator Cross
Bearish Oscillator Cross
OverBought Condition
Entering OverBought Condition
Exiting OverBought Condition
OverSold Condition
Entering OverSold Condition
Exiting OverSold Condition
Possible Regular Divergence
Possible Regular Bullish Divergence
Possible Regular Bearish Divergence
This indicator is meant to be used by professional traders.
If you would like to subscribe , please send me a private message.
