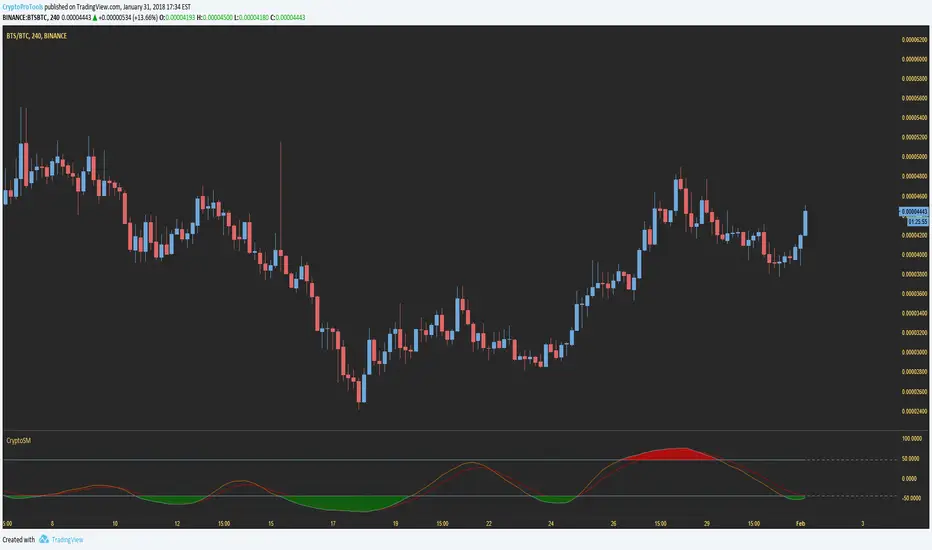
Slow Stoch 21 Day Oscillator21 day Slow Stoch Oscillator, adjustable smoothing, sell set to 84 and buy set to 13
Stochastic Oscillator


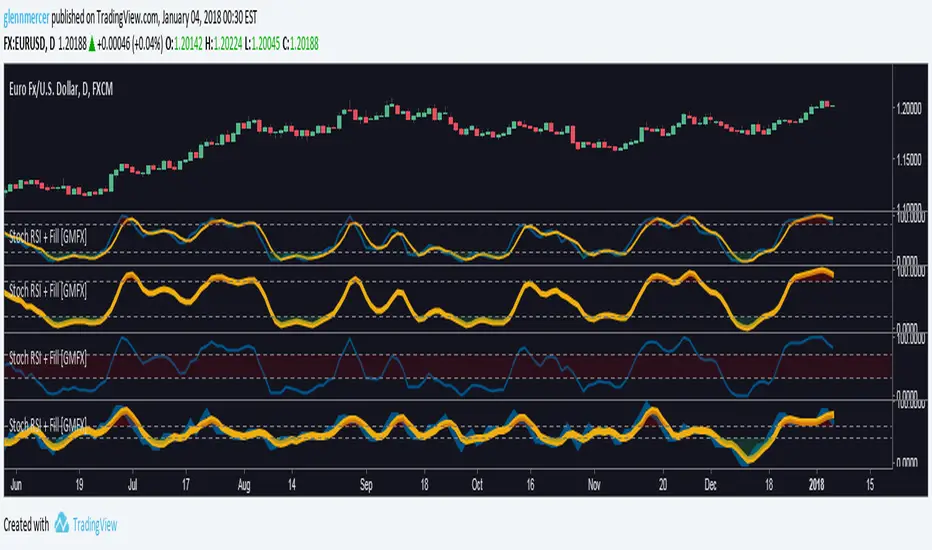
Stochastic RSI w/ Fill [GMercerFX]This is a variation on the StochRSI indicator with MANY more options for customization. These options include:
Color fill for OB and OS conditions on either K or D values
Ability to fill center or disable
Adjustable overbought and oversold levels
Easy line width adjustments
Ability to show or hide either k or d lines
All original StochRSI options
Enjoy!
@gmercerfx

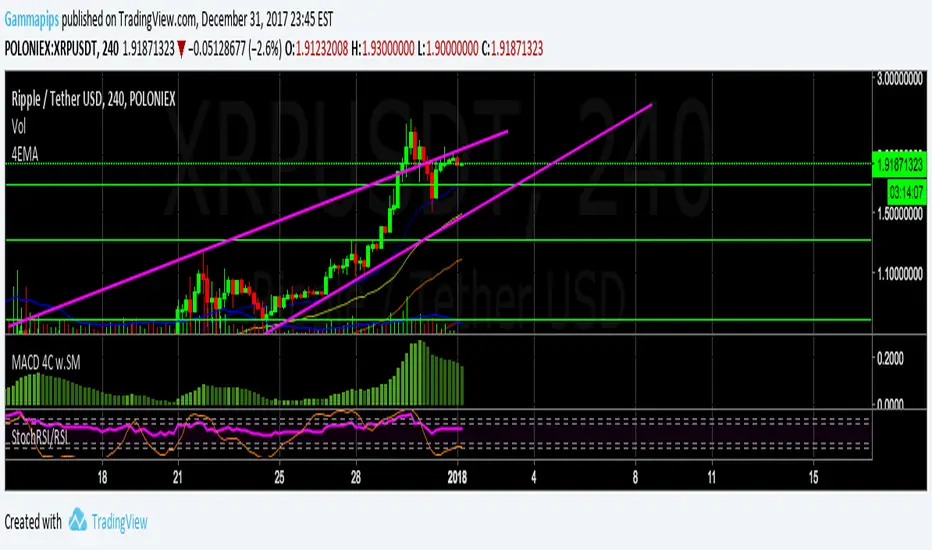
RSI + Stoch/RSIThis is a combination of 2 of the most used indicators. RSI and stochastic/RSI
Ive coded them both to work together to save space on your chart and work as only ONE indicator.
I specifically only use the D line with my rsi , but you have the option to use the K and D line if you so choose.
RSI is good for momentum
Stochastic is good for short term momentum.
They work very well together and if you are a swing trader or scalper they can help immensely when looking for sniper entry areas after you've done you're initial pattern, level, fibonacci and wave analysis.
I like the way this works and have been using these two indicators for a while so I figured I would share.
Happy new year everyone, God bless!
Trend Following StochasticI decided to work on a series of trend-following indicators, which use special moving averages to catch up with the market's trend.
This "Trend Following Stochastic" does a great job in smoothing out unnecessary noises and tries to give users a more accurate direction to which the market is moving.
If you want this TA, please put me on notice in personal message. Happy trading!

Crypto Money Bot - Trading Bot for Bitcoin (BTCUSD)This takes my previous script, adds even more logic conditions, and sets up long and short entries in a strategy that can trade.
Default settings with a $5,000 starting balance have shown this bot to get the following results:
Net Profit: $ 10302.70 / 206.05 %
EXAMPLES
LOGIC
This indicator looks for accumulation of buying and selling along with trend flows for oversold and overbought opportunities to align the trade entries. It does not trade all the time, but when it does pull a trade the success rates are higher.
You could choose to pair this with another indicator to do a manual entry, or to manage your stop losses and money management strategy.
PROOF
Check out the reviews on the original indicator that this is built upon (and more logic) is here:
NOTES
You can try this strategy on other charts if you want, it is only tested and supported on BTCUSD. To try it on ETHUSD, change the settings from BTC to ETH. If you get a "resolve_error" it means that specific coin is not supported.
ACCESS
If you'd like to use my custom indicator - send 0.05 BTC to 32Hagdtq7PCR4inF4ZPkCReEjyecm2eNaP then email me at samurai_crypto@protonmail.com with your TradingView username and your transaction ID and I will add you.
Costs are lifetime with full support via email on how to use it.

Ehlers-Smoothed Stochastic Oscillator [Krypt]This indicator is in principle similar to Stochastic Oscillator, but contains the following improvements:
- advanced Ehlers-based smoothing (typically results in earlier signals than regular EMA smoothing)
- graceful degradation when few candles present for improved accuracy in the beginning of the chart
- buy/sell signals based on K-D crossover above/below thresholds

Stochastics Real DealAfter years studying stochastics, here is the real deal
Stochastics comfirmation with very high probability setups
Green dots = it's time to consider stochastic signal of Buying
Red dots = it's time to consider stochastic signal of Selling
No dots = ignore stochastics signal
The formula for dots is really top secret
It works best on 1D timeframe
You can try the indicator for a trial period (just write in comments to have access), if you want unlimited access you can PM me after trial period
Remember: trading is a risky business, trade at your own risk. I'm not responsable for any gain or loss.

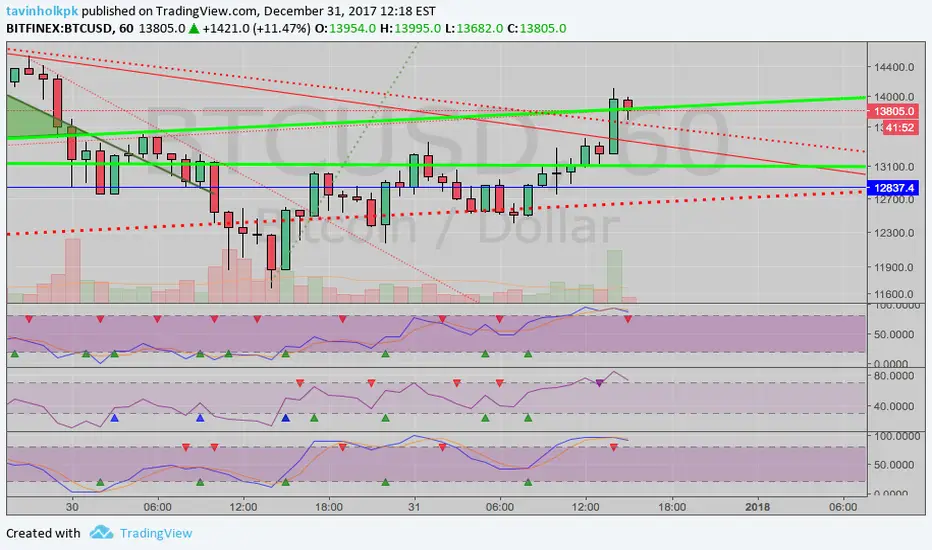
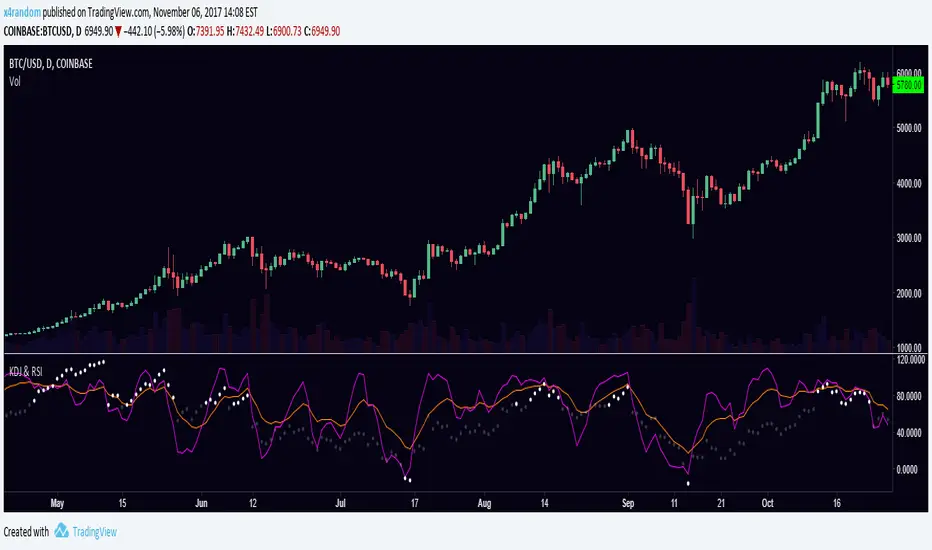
KDJ & RSIRSI and KDJ indicator combined.
KDJ: Buy when J (purple) is going up and and crossing KD (orange) from below. Sell vise versa.
RSI: Overbought when RSI is over 70, oversold when RSI is under -10.
Crazy OscillatorStrategy script.
By invitation only.
Works like a RSI / stochastic oscillator.
Set the levels that you would like to open and close your positions and back-test it on the markets/time frames of your choice.
The dotted yellow lines on the chart represent the opening positions.


Lazy Monies Bitcoin ScalperAn edit of my previous script "1h gold lazy monies" so that it can be applied to 5m bitcoin charts. Unfortunately the time scale that it can be back tested for is quite short so it only manages to test 40 trades, so I would be a little cautious trading using this under very different market conditions. The fact that Bitcoin is largely traded emotionally by stoners and flat earthers from their mothers basement makes it easier to be a parasite off those tiny swings. Average trade length is about 9 hours but that is because trades that have the ability to catch larger moves stay open longer, most trades are designed for shorter time frames. It is able to make profit through up and down trends. DO NOT trade this strategy through CFDs because the spread will eat up all your profit.

Buy/Sell Signal Using Stochastic and RSIThe use of stoch rsi above 55 and below 45 to determine buying and selling pressure.

Cuathro EMA StrategyIt's a long term script based on multiples EMA, crossover and crossunder.
Based on two good scripts CM Sling and OCC.
Always adjust resolution at least twice than chart.
Enjoy it! BTCUSD

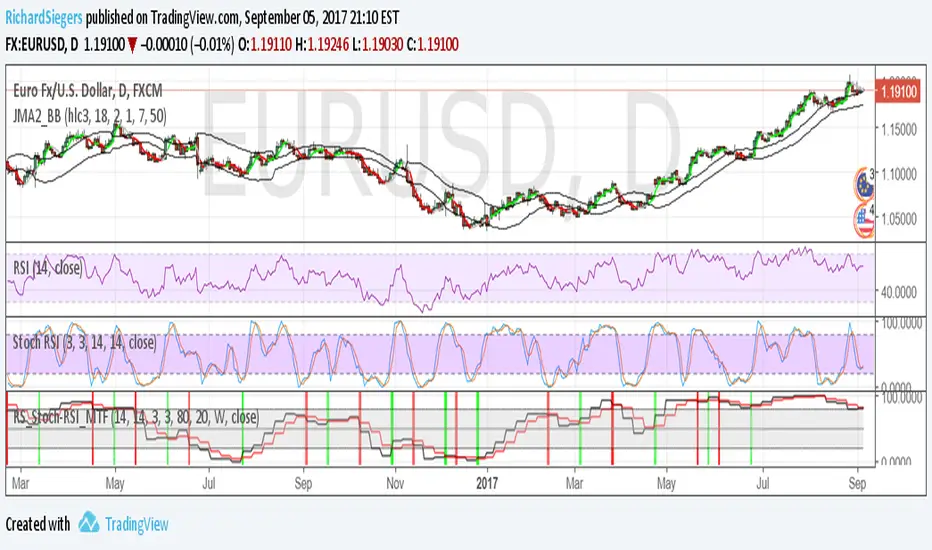
RS_Stoch-RSI_MTFmodification by Richard Siegers that turned stochastic mtf from ChrisMoody into stochastic-rsi mtf
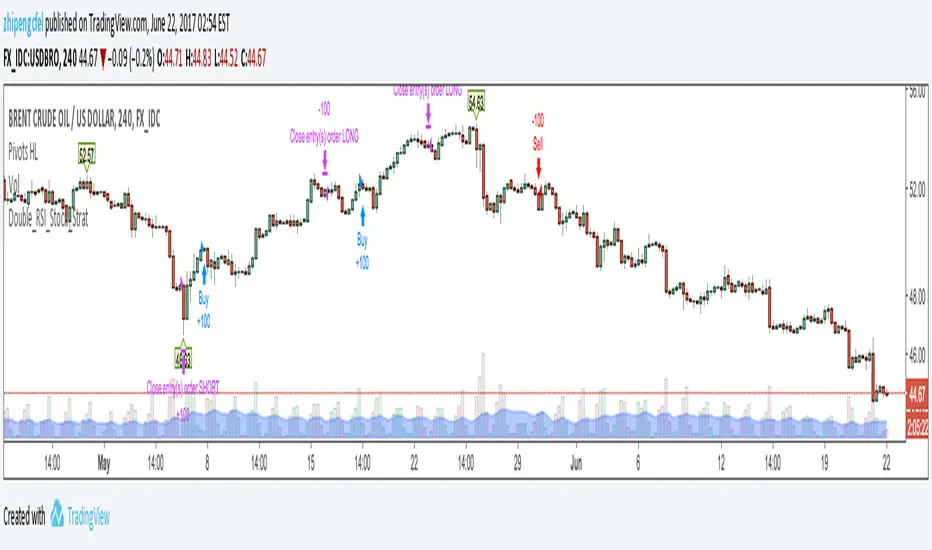
Double RSI with stochastic Strategy with SL (by Zhipengcfel)Added stop loss level when open positions. Results got better and max drawback reduced.
The current limitations are it will not add positions if having opened positions although meeting the entry conditions.
Next steps are adding positions when meeting entry conditions and set a upper limit quantities for open positions.

Double RSI with stochastic Strategy on UKOIL (by Zhipengcfel)Adapted the double RSI with stochastic strategy to UKOIL. I optimised the strategy input parameters for UKOIL. It looks promising.
Currently I have not adapted stop loss to the script yet, only enter and exit condition based on trend. Next step I will add stop loss for the strategy and backtest it again.
Due to it is still in development and optimisation, I am sorry that I will not publish it to public currently.
I just use it as a development elog.
Thanks to tradingview for such a good blog system. -:)
Double RSI lines with stochastic Strategy (by Zhipengcfel)Double RSI lines to find the current trend. The Stochastic was used to buy (if double RSI line shows bull trend) or sell (if double RSI line shows bearish trend).
This is just a demo vision and can not be used for real auto trading, so i will not publish the full script.
Thanks to @ChartArt.
Good luck to all!
