RSI on VWAP Upgraded strategyFirst of all, the idea of apply RSI to VWAP was inspired by XaviZ; at least, that where I first saw that.
I simply applied the idea and searched for apply this on lower timeframe (M15) to increase the number of positions and improve the profit factor.
The conditions to enter are the same :
long : enter on RSI crossover oversold level
short : enter on RSI crossunder oversell level
To close position, I found a little change to apply :
long : close position when RSI(VWAP) went in overbought zone and crossunder the overbought level OR after being at least x bars in the overbought zone (parameter is 28 by default) => when the first condition happens
short : close position when RSI(VWAP) went in oversold zone and crossover the oversold level OR after being at least x bars in the oversell zone (parameter is 28 by default) => when the first condition happens
With this change, I got better results specially on BTCUSDTPERP (M15) where I reach a 6.8 profit factor with 119 trades closed. Not BAD !
The defaults parameters are the best found for BTCUSDTPERP (M15), but the strategy works fine for other pairs if you take time to find the rights combinations.
In this strategy you can change (with defaults in () ):
RSI length (28)
RSI overbought level (85)
RSI oversell level (30)
Number of bars before leaving as explain above (28)
The choice to take longs only, shorts only or both
The number of coin/token by position
The start date for backtesting
Please note that the script use a pyramiding parameter of 3 (can be changed in the first line of the script); that means that you can take up to 3 positions before closing. It lets you improve average enter price but increase the risk. 3 is the best I found to improve profit factor without expose myself too much.
This script would be better if automated because of the conditions of buy and sell.
It's only for educative purpose, not an advice to invest.
All my free scripts here : fr.tradingview.com
Leave a message and don't forget to follow me ;) !
Strategy

Intraday StrategyThis script helps you to determine entry for long trades and short trades.
Conditions checked:-
1. VWAP for long/short
2. 20 EMA for confirmation
3. STOCHASTIC RSI for momentum
How to enter:-
After the indicator plots the entry for long/short on chart, wait for the price to break nearest pivot point and close above it. Combine with price action for better results.
when long signal is plotted, wait for the nearest resistance to be broken, while entering make sure that the price has not been in a continues uptrend or downtrend.
Time Frame:-
5 & 15 minutes timeframe
When to exit:-
Exit the position after 1% raise of price. eg:- if stock price is 1000, exit after 10 points. you can trail SL if you see a long trend comming
Where to place SL :-
Place your SL 0.5%-1% from you entry or determine the nearest support.
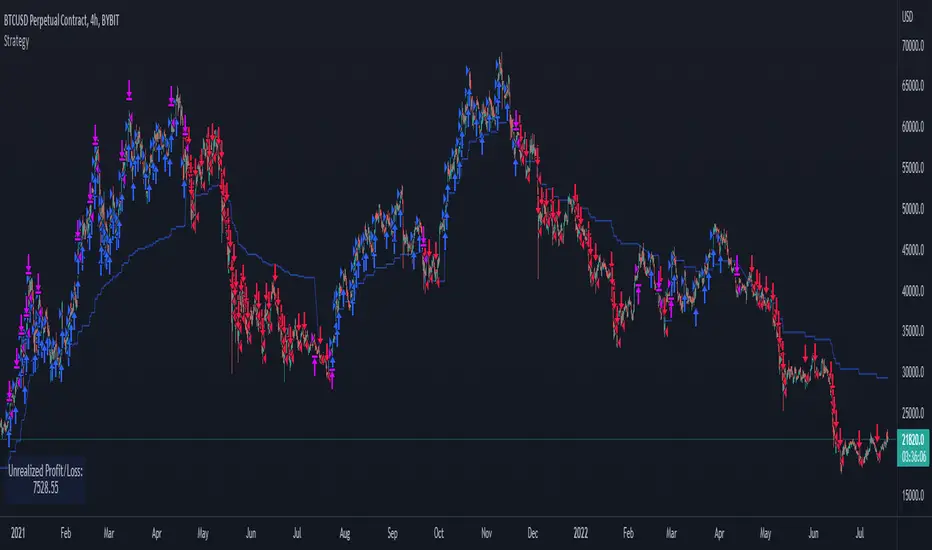
The MATRIX: Ultimate Crypto Position Strategy (Alert Version)Welcome back everyone,
It's been a while since our last post. In recent months we have worked on all kinds of projects, but more on that later. In the meantime, we also received a lot of positive feedback about our original 'The MATRIX: Ultimate Crypto Position Strategy' script.
One of the many requests was whether we could release an alert version.
However, since Pinescript does not provide the alert functionality in a strategy type script, it had to be converted to a study type script. Besides that, we have also added a stop-loss functionality. This release has the same internal algorithm as the original 'The MATRIX: Ultimate Crypto Position Strategy' script. But instead of showing back test results, this script provides the functionality to add alerts that can notify the user via email / pop-up / sms / app once a signal is given! You must manually add these alerts via TradingView. If you need help setting up these alerts, feel free to ask in the comment box or send us a dm.
***The script is invite-only, message us to get script access***
-------------------------------------------------------------------------------------------------
The MATRIX: Ultimate Crypto Position Strategy should be used as follows:
• The trading strategy was designed and optimized for trading cryptocurrencies only ; furthermore it works best on established high market cap cryptocurrencies that have a clear trend such as:
BTCUSD
ETHUSD
LTCUSD
XRMUSD
EOSUSD
ADAUSD
DASHUSD
ETCUSD
• The trading strategy is based on swing/position methodology. The script must therefore be used on daily timeframe candles only (1D).
• Use USD trading pairs only (e.g. use ETHUSD instead of the ETHBTC) since the individual trend is captured more effectively and therefore gives better results.
-------------------------------------------------------------------------------------------------
The MATRIX:Ultimate Crypto Position Strategy is based on the following indicators:
• Ichimoku Cloud ; acts as the leading indicator.
• Volume ; without strong volume , a market move is not valid.
• MACD and Vortex ; both being used as confirmation indicators.
• Choppiness index ; avoids trading in choppy markets.
• Bullish/ Bearish Regular Divergences in combination with RSI to spot tops and bottoms.
• Simple and Exponential Moving Averages ; prêvents trading against the trend.
The trading strategy is easy to use, trend based and without repainting, meaning once a signal has been made it is permanent and that no future data is used in the decision making. It detects the trend and filters out market noise based on more than 10 technical indicators. ONLY when all indicators align with each other the algorithm prints a BUY or SELL signal. The trading strategy provides high probability trading signals and minimizes risk! This script aims to capture the profit from longer term trending moves and by doing so filters out non-substantial trends and avoids the associated risks with these trades.
-------------------------------------------------------------------------------------------------
The MATRIX: Ultimate Crypto Position Strategy has the following features:
• ALERTS can be enabled which can notify the user through email/popup/app once a signal is given.
• Automatically generated Buy / Sell alerts in the form of a label.
• NO Repaint once candle is closed.
• SAFEGUARD ; custom built-in security prevẹnts trading when the price is out of equilibrium.
• Customizable Display for the Ichimoku cloud indicator display.
-------------------------------------------------------------------------------------------------
Reminder: Use this trading strategy at your own risk and trade responsibly. We are not responsible for any financial loss using this strategy.
***The script is invite-only, message us to get script access***

Lagged Donchian Channel + EMAThis strategy is based on a lagged 24 periods Donchian Channel and a 200 periods EMA .
The enter positions are calculated this way :
Bull entry
1. we wait for the close of a candle below the channel and it must be below the 200 EMA
2. the following candle must be a green one and close in the lagged channel
3. we put a long order at the close of the second candle, a stop loss at the low of last 3 candles and a x3 take profit
Bear entry
1. we wait for the close of a candle above the channel and it must be above the 200 EMA
2. the following candle must be a red one and close in the lagged channel
3. we put a short order at the close of the second candle, a stop loss at the high of last 3 candles and a x3 take profit
For both long or short positions :
If the order is not filled, it's cancelled if the price reach 50% of the TP or if the price reach the stop loss level
The position is closed if a new bear/bull condition appears in the other side of the position (if a bear appears when you're long and inversement)
Features :
Position calculator's included with leverage option
Labels of position can be plotted or not
Bull/Bear channels can be plotted with red and green filled
All parameters can be changed for backtesting
Better results have been got with defaults parameters on LTCUSDTPERP in H1 timeframe => profit factor of 2.84 with almost 100 positions.
Hope this strategy will be useful and it would be cool if I could get feedback, comments or better combinations of parameters !!
Don't hesitate to like and leave a comment ;)
@Mysteriown

Alert of Cryptooo fox HYPER trading(CRYPTOOO FOX ( BCH ) long & short no repaint strategy)
Hello traders
- The alert of strategy is using higher time frame but it never repaint .
- The alert of strategy is working only in ( 10 % of equity ) you can change it as you want .
- When you use this alert you will get this message alert ( THIS INDICATOR MAY BE REPAINT )
and this is normal so we use higher time frame but as i said it ( never repaint )
- The alert of strategy is working in ( BCH / USDTP ) and ( BTC / USDTP) IN BINANCE FUTURE MARKET .
- I recommanded too much using ( 15 min , 30 min ) charts .
- This script is working in standard charts no ( heikien ashi or range ) charts .
- ( TO ACCES THIS SCRIPT PLEASE USE THE LINKS BELOW ) .

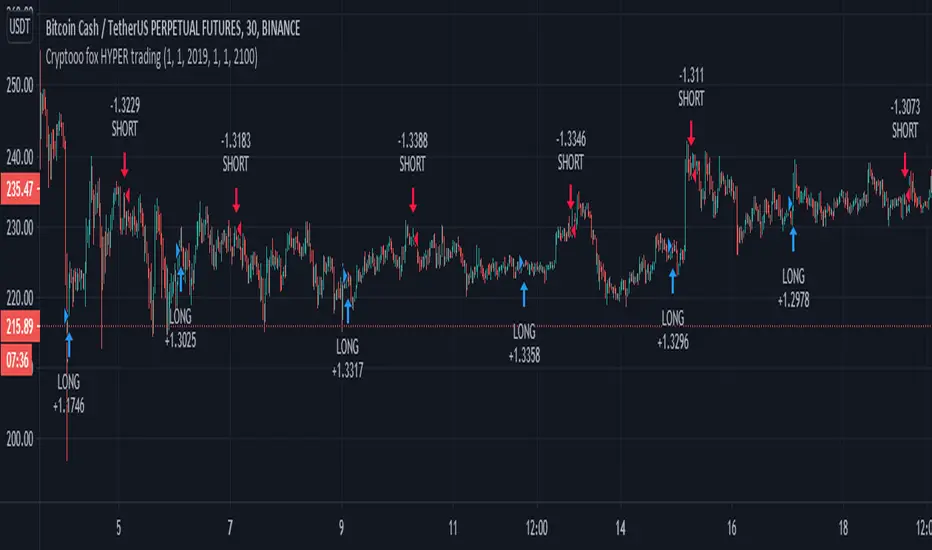
Cryptooo fox HYPER trading(CRYPTOOO FOX ( BCH ) long & short no repaint strategy)
Hello traders
- The strategy is using higher time frame but it never repaint .
- The strategy is working only in ( 10 % of equity ) you can change it as you want .
- I use 0.04 % as fees ( this future market in binance fees ) .
- I use 1000 dollar as capital ( you also can change it as your capital ) .
- The strategy is working in ( BCH / USDTP ) and ( BTC / USDTP) IN BINANCE FUTURE MARKET .
- I recommanded too much using ( 15 min , 30 min ) charts .
- This script is working in standard charts no ( heikien ashi or range ) charts .
- ( TO ACCES THIS SCRIPT PLEASE USE THE LINKS BELOW ) .
TC Chart Score StrategyThis is My Call Confidence Strategy
The Strategy is designed to help confirm a bullish reversal after a downtrend.
This uses custom weighted algorithm
The Algorithm combines directional movement, volume over average, and moving averages to formulate a score.
The score is then used in conjunction with a smoothed score of the same criteria to initiate a buy signal on a cross over.
The settings are designed to help you customize how you weight directional movement, and the moving averages to further finetune the algorithm to your timelines.
The default settings are designed to be used on a 1 hour time frame.
You can change the settings for other time frames to further increase effectiveness.
This script will be updated as needed if a better algorithm is designed.

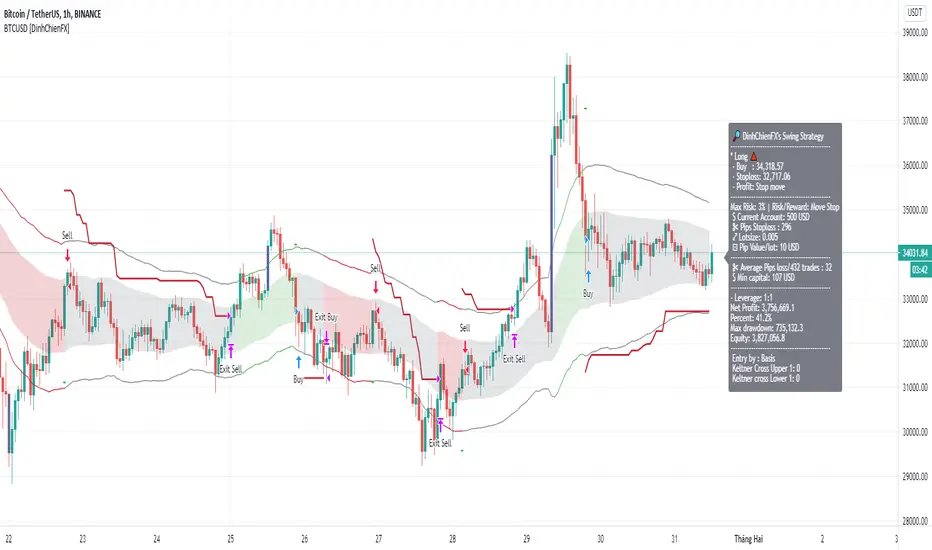
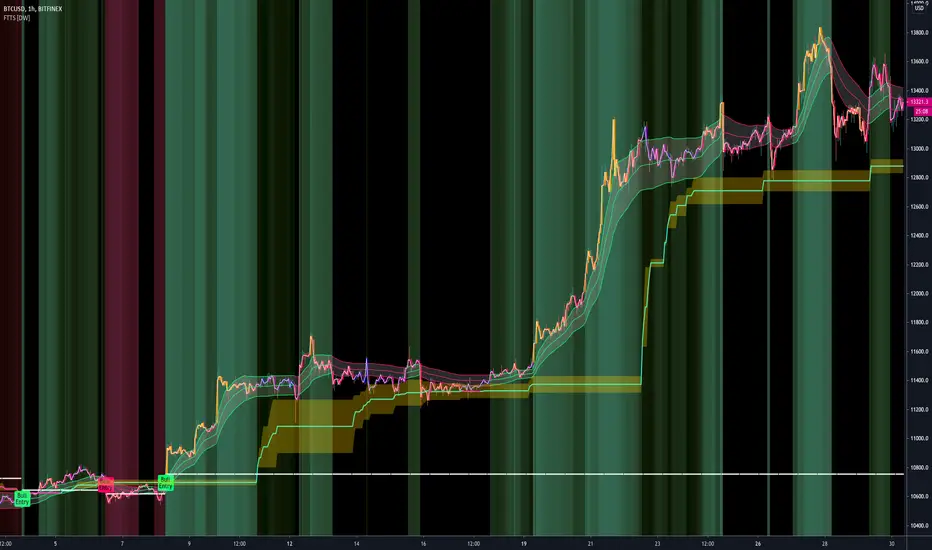
BTCUSD signal [DinhChienFX Corner] Ver 2.01. How to use Keltner Channel
a_ Length of Keltner's basis line is 50. It gives the best result in finding rule of BTCUSD.
b_ How to confirms a trend.
- Upper 2 is used to confirm Keltner channel at Uptrend.
- Lower 2 is used to confirm Keltner channel at Downtrend.
c. How to determine a swing Entry.
_ Upper 1 is used to buy when the market make a corrective.
_ Lower 1 is used to sell when the market make a corrective.
2. Long signal is confirmed when Closed of candle crossover the Upper 2.
3. Short signal is confirmed when Closed of candle crossunder the Lower 2.
4. Stoploss is calculated by the price closed candle +/- the value of Average true range (length=20 bars)
Stoploss = previous Close +/- atr(20)x2
-> To move the stoploss every 1 hour.
5. Filter the Candle is over 93% for Not Entry.
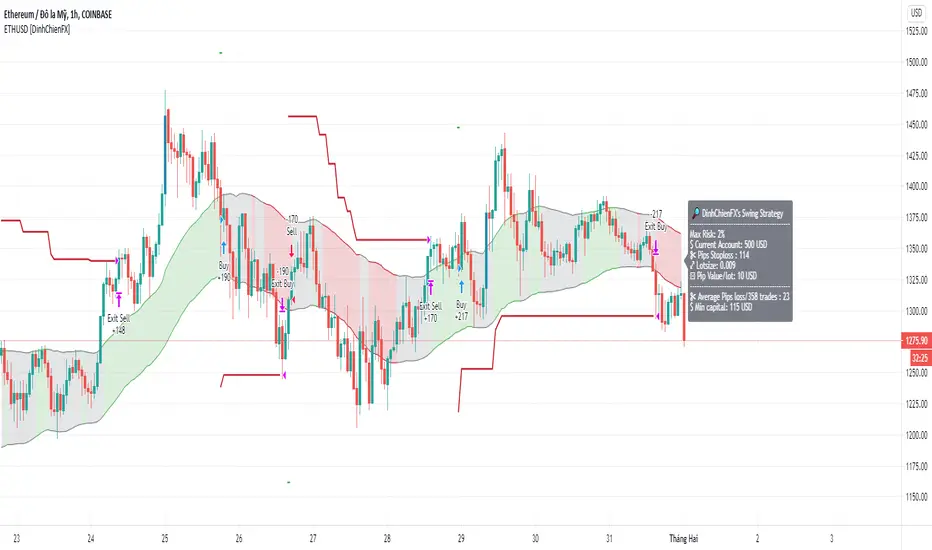
ETHUSD signal [DinhChienFX Corner] Ver 1.01. How to use Keltner Channel
a_ Length of Keltner's basis line is 50. It gives the best result in finding rule of ETHUSD.
b_ How to confirms a trend.
- Upper 1 is used to confirm Keltner channel at Uptrend to give Buy_1.
- Lower 1 is used to confirm Keltner channel at Downtrend to give Sell_1.
c. How to determine a swing Entry.
- Upper 1 is used to buy when the market make a corrective.
- Lower 1 is used to sell when the market make a corrective.
d. Color count calculate
- Color count = Green + Red
- If Color count > 0 is Uptrend to give Buy_2
- If Color count < 0 is Downtrend to give Sell_2
2. Long signal is confirmed when Closed of candle crossover the Upper 1 & Color count for Uptrend.
3. Short signal is confirmed when Closed of candle crossunder the Lower 1 & Color count for Downtrend.
4. Stoploss is calculated by the price closed candle +/- the value of Average true range (length=20 bars)
Stoploss = previous Close +/- atr(20)x2x0.9
-> To move the stoploss every 1 hour.
5. Filter the Candle is over 93% for Not Entry.
6. Report the result at Backtest:
a. Longterm result 2018-23/9/2020:
b. Midterm result (every year)
_ 2018-2019:
_ 2019-2020:
c. Shortterm 01/01/2020 to 09/23/2020
--------------
"Use the link below to obtain access to this indicator" or "PM us to obtain access"
Super Guppy StrategyCM Super Guppy with Long/Short signals, backtesting, and additional options. Updated for PineScript v4.
COINBASE:BTCUSD
Features 2 primary modes, depending on your risk profile. These options are available in the settings:
"Early Signals" ON (default):
Prints a "long" on grey to green transitions AND red to gray transitions.
Prints a "short" on green to grey transitions AND gray to red transitions.
Will not print back-to-back repeated positions (i.e. green → grey → red will only print the first green → gray "short" signal and not print "short" twice).
Rotates long and short positions with no delay.
"Early Signals" OFF
Will close trades, but never open new ones, when guppy transitions to from any color to gray.
Open long: guppy transitions gray to green.
Close long: guppy transitions green to gray.
Open short: guppy transitions gray to red.
Close short: guppy transitions red to gray.
Does not rotate long and short positions back to back.
Additionally:
Can toggle on/off the 200EMA. Default is off.
Can toggle on/off short positions. Default is on.
In development: alerts

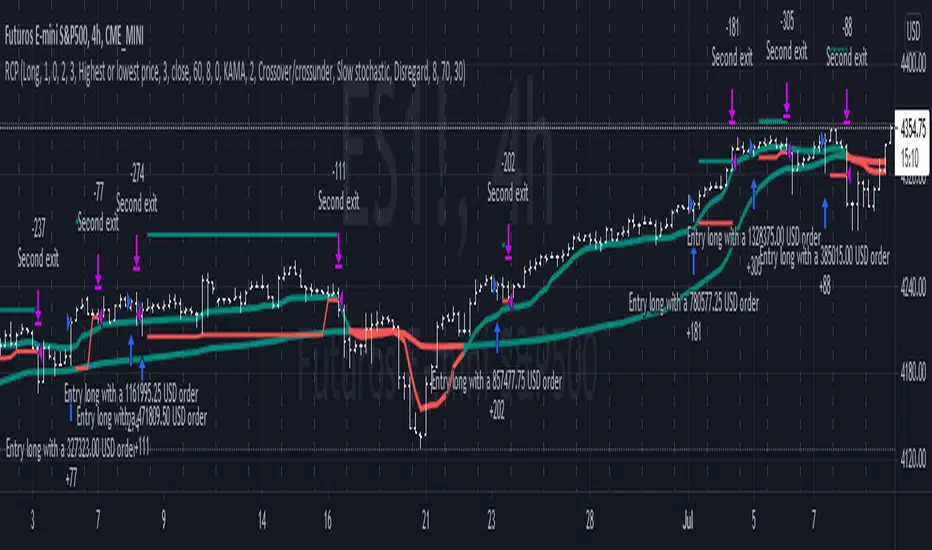
Reversal closing priceThe reversal closing price (RCP) is a candlestick pattern which follows two simples rules:
the low price of current candle needs to be lower than the low price of the last 2 candles
the closing price of current candle needes to be higher than the closing price of the last candle
This generates a signal for a long position. For a short position, the conditions are inverted:
the high price of current candle needs to be higher than the high price of the last 2 candles
the closing price of current candle needes to be lower than the closing price of the last candle
Since RCP is a trend follower indicator, the strategy is programmed in such a way that long positions are only placed if the short period EMA is above the long period EMA, and short positions are only placed if the short EMA is bellow the long EMA. Both periods are configurable, and should be ajusted for each asset.
This strategy uses a fixed stop loss and take profit, and the it's ratio is configurable. The stop price is one tick lower than the lowest price of X candles prior to the order execution for long positions, while in short positions it's one tick higher than the higher price. The amount of candles to lookback (X) is configurable. Both stop and take profit prices are displayed, the first as a red line, and the second as a green line.
This is the setting that I've found to work best with TVC:SPX , but you may find a better setting. While the RCP is universal, it's placement depends on the trend and it's strenght, something that is very heterogeneous among assets.
I really wish that I was able to place images, but I don't have PRO, so text will have to do.
This strategy was designed by Alexandre Wolwacz, a.k.a. Stormer.
The Strategy - Ichimoku Kinko Hyo and moreThe purpose of this strategy is to make the signals from my scripts available for verification by backtests. Different signal and filter combinations can be created and specific manual parameter optimization can be carried out.
In detail, this strategy includes:
23 entry signals
two entry filters with each 9 filters
two exit filters with each 9 filters
take profit and stop loss
time period for backtesting
Combo Strategy 123 Reversal & Fractal Chaos Bands This is combo strategies for get a cumulative signal.
First strategy
This System was created from the Book "How I Tripled My Money In The
Futures Market" by Ulf Jensen, Page 183. This is reverse type of strategies.
The strategy buys at market, if close price is higher than the previous close
during 2 days and the meaning of 9-days Stochastic Slow Oscillator is lower than 50.
The strategy sells at market, if close price is lower than the previous close price
during 2 days and the meaning of 9-days Stochastic Fast Oscillator is higher than 50.
Second strategy
Stock market moves in a highly chaotic way, but at a larger scale, the movements
follow a certain pattern that can be applied to shorter or longer periods of time
and we can use Fractal Chaos Bands Indicator to identify those patterns. Basically,
the Fractal Chaos Bands Indicator helps us to identify whether the stock market is
trending or not. When a market is trending, the bands will have a slope and if market
is not trending the bands will flatten out. As the slope of the bands decreases, it
signifies that the market is choppy, insecure and variable. As the graph becomes more
and more abrupt, be it going up or down, the significance is that the market becomes
trendy, or stable. Fractal Chaos Bands Indicator is used similarly to other bands-indicator
(Bollinger bands for instance), offering trading opportunities when price moves above or
under the fractal lines.
The FCB indicator looks back in time depending on the number of time periods trader selected
to plot the indicator. The upper fractal line is made by plotting stock price highs and the
lower fractal line is made by plotting stock price lows. Essentially, the Fractal Chaos Bands
show an overall panorama of the price movement, as they filter out the insignificant fluctuations
of the stock price.
WARNING:
- For purpose educate only
- This script to change bars colors.

STRATEGY TESTER ENGINE - ON CHART DISPLAY - PLUG & PLAYSo i had this idea while ago when @alexgrover published a script and dropped a nugget in between which replicates the result of strategy tester on chart as an indicator.
So it seemed fair to use one of his strategy to display the results.
This strategy tester can now be used in replay mode like an indicator and you can see what happen at a particular section of the chart which was is not possible in default strategy tester results of TV.
Please read how each result is calculated so you will know what you are using.
This engine shows most common results of strategy tester in a single screen, which are as follows:
1. Starting Capital
2. Current Profit Percentage
3. Max Profit Percentage
4. Gross Profit
5. Gross Loss
6. Total Closed Trades
7. Total Trades Won
8. Total Trades Lost
9. Percentage Profitable
10. Profit Factor
11. Current Drawdown
12. Max Drawdown
13. Liquidation
So elaborating on what is what:
1. Starting Capital - This stays 0, which signifies your starting balance as 0%. It is set to 0 so we can compare all other results without any change in variables. If set to 100, then all the results will be increased by 100. Some users might find it useful to set it to 100, then they can change code on line 41 from to and it should show starting balance as 100%.
2. Current Profit Percentage - This shows your current profit adjusted to current price of the candle, not like TV which shows after candle is close. There is a comment on the line 38 which can be removed and your can see unrealized profit as well in this section. Please note that this will affect Draw-down calculations later in this section.
3. Max Profit Percentage - This will show you your max profit achieved during your strategy run, which was not possible yet to see via strategy tester. So, now you can see how much profit was achieved by your strategy during the run and you can compare it with chart to see what happens during bull-run or bear-run, so you can further optimize your strategy to best suit your desired results.
4. Gross Profit - This is total percentage of profit your strategy achieved during entire run as if you never had any losses.
5. Gross Loss - This is total percentage of loss your strategy achieved during entire run as if you never had any profits.
6. Total Closed Trades - This is total number of trades that your strategy has executed so far.
7. Total Trades Won - This is the total number of trades that your strategy has executed that resulted in positive increase in equity.
8. Totals Trades Lost - This is the total number of trades that your strategy has executed that resulted in decrease in equity.
9. Percentage Profitable - This is the ratio between your current total winning trades divided by total closed trades, and finally multiplied by 100 to get percentage results.
10. Profit Factor - This is the ratio between Gross Profit and Gross Loss, so if profit factor is 2, then it indicates that you are set to gain 2 times per your risk per trade on average when total trades are executed.
11. Current Drawdown - This is important section and i want you to read this carefully. Here draw-down is calculated very differently than what TV shows. TV has access to candle data and calculates draw-down accordingly as per number of trades closed, but here DD is calculated as difference between max profit achieved and current profit. This way you can see how much percentage you are down from max peak of equity at current point in time. You can do back-test of the data and see when peak was achieved and how much your strategy did a draw-down candle by candle.
12. Max Drawdown - This is also calculated differently same as above, current draw-down. Here you can see how much max DD your strategy did from a peak profit of equity. This is not set as max profit percentage is set because you will see single number on display, while idea is to keep it custom. I will explain.
So lets say, your max DD on TV is 30%. Here this is of no use to see Max DD , as some people might want to see what was there max DD 1000 candles back or 10 candle back. So this will show you your max DD from the data you select. TV shows 25000 candle data in a chart if you go back, you can set the counter to 24999 and it will show you max DD as shown on TV, but if you want custom section to show max DD , it is now possible which was not possible before.
Also, now let's say you put DD as 24999 and open a chart of an asset that was listed 1 week ago, now on 1H chart max DD will never show up until you reach 24999 candle in data history, but with this you can now enter a manual number and see the data.
13. Liquidation - This is an interesting feature, so now when your equity balance is less than 0 and your draw-down goes to -100, it will show you where and at what point in time you got liquidated by adding a red background color in the entire section. This is the most fun part of this script, while you can only see max DD on TV.
------------------------------------------------------------------------------
How to Use -
1 word, plug and play. Yes. Actual codes start from line 33.
select overlay=false or remove it from the title in your strategy on first line,
Just copy the codes from line 33 to 103,
then go to end section of your strategy and paste the entire code from line 33 to line 103,
see if you have any duplicate variable, edit it,
Add to chart.
What you see above is very contracted view. Here is how it looks when zoomed in.
imgur.com
----------------------------------------------------------------------------------
Feel free to edit and share and use. If you use it in your scripts, drop me tag. Cheers.

Strategy Super Trend v0.4This strategy is written for trading cryptocurrencies using the super trend indicator. The main parameters of the strategies include the super trend indicator settings, as well as the testing period. An important advantage of strategies is the use of a martingale to close positions, which increases profitability!

Combo Strategy 123 Reversal & Floor Pivot Points This is combo strategies for get a cumulative signal.
First strategy
This System was created from the Book "How I Tripled My Money In The
Futures Market" by Ulf Jensen, Page 183. This is reverse type of strategies.
The strategy buys at market, if close price is higher than the previous close
during 2 days and the meaning of 9-days Stochastic Slow Oscillator is lower than 50.
The strategy sells at market, if close price is lower than the previous close price
during 2 days and the meaning of 9-days Stochastic Fast Oscillator is higher than 50.
Second strategy
The name ‘Floor-Trader Pivot,’ came from the fact that Pivot points can
be calculated quickly, on the fly using price data from the previous day
as an input. Although time-frames of less than a day can be used, Pivots are
commonly plotted on the Daily Chart; using price data from the previous day’s
trading activity.
WARNING:
- For purpose educate only
- This script to change bars colors.

Fractal Trend Trading System [DW]This is an advanced utility that uses fractal dimension and trend information to generate useful insights about price activity and potential trade signals.
In this script, my Advanced FDI algorithm is used to estimate the fractal dimension of the dataset over a user defined period.
Fractal dimension, unlike spatial or topological dimension, measures how complexity or detail in an "object" changes as its unit of measurement changes, rather than the number of axes it occupies.
Many forms of time series data (seismic data, ECG data, financial data, etc.) have been theoretically shown to have limited fractal properties.
Consequently, we can estimate the fractal dimension from this data to get an approximate measure of how rough or convoluted the data stream is.
Financial data's fractal dimension is limited to between 1 and 2, so it can also be used to roughly approximate the Hurst Exponent by the relationship H = 2 - D.
When D=1.5, data statistically behaves like a random walk. D above 1.5 can be considered more rough or "mean reverting" due to the increase in complexity of the series.
D below 1.5 can be considered more prone to trending due to the decrease in complexity of the series.
In this script, you are given the option to apply my Band Shelf EQ algorithm to the dataset before estimating dimension.
This enables you to transform your data and observe how its newly measured complexity changes the outputs.
Whether you want to give emphasis to some frequencies, isolate specific bands, or completely alter the shape of your waveform, EQ filtration makes for an interesting experience.
The default EQ preset in this script removes the low shelf, then attenuates low end and high end oscillations.
The dominant cyclical components (bands 3 - 5 on default settings) are passed at 100%, keeping emphasis on 8 to 64 sample per cycle oscillations.
The estimated dimension is then used to calculate the High Dimension Zone and the Error Bands.
Both of these components are great for analyzing trends and for estimating support and resistance values.
The High Dimension Zone is composed of a high line, low line, and midline that update their values when D is at or above the user defined zone activation threshold.
The zone is then averaged over a user defined amount of updates and zone width is multiplied by a user defined value.
The Error Bands are composed of a high, low, and middle band that are calculated using an error adjusted adaptive filter algorithm that utilizes dimension as the smoothing constant modulator.
The basis filter for the error bands has two calculation types built in:
-> MA - Calculates the filters as adaptive moving averages modulated by D.
-> WAP - Calculates the filters as adaptive weighted average prices modulated by D.
The WAP starting point can be based on the High Dimension Zone being moved or a user defined interval.
You can also define the WAP's minimum and maximum periods for additional control of the initial and decayed sensitivity states.
The alpha (smoothing constant) modulator can be fine tuned using the designated dimension thresholds.
When D is at or below the low dimension threshold, the filter is most responsive, and vice-versa for the high dimension threshold.
Alpha is then multiplied by a user defined amount for additional control of sensitivity.
Band width is then multiplied by a user defined value.
A Hull transformation can be optionally performed on the zone averaging and band filter algorithms as well, which will alter the frequency and phase responses at the cost of some overshoot.
This transformation is the same as a typical Hull equation, but with custom filters being used instead of WMA.
The calculated outputs are then used to gauge the trend for signal and color scheme calculations.
First, a dominant trend indication is selected from its designated dropdown tab.
The available built in indications to choose from are:
-> Band Trend (Outer) - Detects band breakouts and saves their direction to gauge trend.
-> Band Trend (Median) - Uses disparity between source and the band median to gauge trend.
-> Zone Trend (Expansion) - Detects when the high fractal zone expands and saves its direction to gauge trend.
-> Zone Trend (Outer Levels) - Detects zone breakouts and saves their direction to gauge trend.
-> Zone Trend (Median) - Uses disparity between source and the zone median to gauge trend.
Then the trend output is optionally filtered before triggering signals.
There are multiple trend filtration options built into this script that can be used individually or in unison:
-> Filter Trend With High Fractal Zone - Filters the trend using the specified zone level or combination of levels with either disparity or crossover conditions.
There is a set of options for bullish and bearish trends.
-> Filter Trend With Error Bands - Filters the trend using the specified band level or combination of levels with either disparity or crossover conditions.
There is a set of options for bullish and bearish trends.
-> Filter Trend With Band - Zone Disparity Condition - Filters the trend using the specified band level, zone level, and disparity direction.
There is a set of options for bullish and bearish trends.
-> Filter By Zone That Moves With The Trend - Filters the specified trend by detecting when the high fractal zone’s direction correlates.
-> Filter By Bands That Move With The Trend - Filters the specified trend by detecting when the error bands’ direction correlates.
-> Filter Using Wave Confirmation - Filters the specified trend by detecting when source is in a correlating wave with user defined length.
You can also choose separate lengths for bullish and bearish trends.
-> Filter By Bars With Decreasing Dimension - Filters the specified trend by detecting when fractal dimension is decreasing, suggesting source is approaching more linear movement.
The filtered trend output is then used to generate entry and exit signals.
There are multiple options included to fine tune how these signals behave.
For entries, you have the following options built in:
-> Limit Entry Dimension - Limits the range of dimensional values that are acceptable for entry with user defined thresholds.
This can be incredibly useful for filtering out entries taken when price is moving in a more complex pattern,
or when price is approaching a peak and you’re a little late to the party.
-> Enable Position Increase Signals - Enables more entry signals to fire up to a user defined number of times when a position is active.
This is helpful for those who incrementally increase their positions, or for those who want to see additional signals as reference.
-> Limit Number Of Consecutive Trades - Limits the number of consecutive trades that can be opened in a single direction to a user defined maximum.
This is especially useful for markets that only trend for brief durations.
By limiting the amount of trades you take in one direction, you have more control over your market exposure.
There is a set of these options for both bullish and bearish entries.
For exits, you have the following options built in:
-> Include Exit Signals From High Fractal Zone - Enables exit signals generated from either crossover or disparity conditions between price and a specified zone level.
-> Include Exit Signals From Error Bands - Enables exit signals generated from either crossover or disparity conditions between price and a specified zone level.
-> Include Inactive Trend Output For Exits - Triggers exit signals when the filtered trend output is an inactive value.
-> Dimension Target Exit Method - Triggers exit signals based on fractal dimension hitting a user defined threshold.
You can either choose for the exit to trigger instantly, or after dimension reverts from the target by a user specified amount.
-> Exit At Maximum Entry Dimension - Triggers exit signals when dimension exceeds the maximum entry limit.
-> Number Of Signals Required For 100% Exit - Controls the number of exit signals required to close the position.
You can also choose whether or not to include partial exits.
Enabling them will fire a partial signal when an exit occurs, but the position is not 100% closed.
Of course, there is a set of these options for bullish and bearish exits.
In my opinion, no system is complete without some sort of risk management protocol in place.
So in this script, bullish and bearish trades come equipped with optional protective SL and TP levels with signals.
The levels can be fixed or trailing, and are calculated with a user defined scale.
The available scales for SL and TP distances are ticks, pips, points, % of price, ATR, band range, zone range, or absolute numerical value.
Now what if you have some awesome signals of your own that you’d like to use in conjunction with this script?
Well good news. You can!
In addition to all of the customizable features built into the script, you can integrate your own signals into the system using the external data inputs and linking your script.
This adds a whole new layer of customization to the system.
With external signals, you can use your own custom dominant trend indication, filter the dominant trend, and trigger exits and protective stops using custom signals.
The signal input is an integer format. 1=Bull Signal, -1=Bear Signal, 2=Bull Exit, -2=Bear Exit, 3=Bull SL Hit, -3=Bear SL Hit, 4=Bull TP Hit, -4=Bear TP Hit.
You can also use the external input as a custom source value for either dimension or global sources to further tailor the system to your liking.
The color scheme in this script utilizes two custom gradients that can be chosen for bar and background colors:
-> Trend (Dominant or Filtered) - A polarized gradient that shows green scaled values for bullish trend and red scaled values for bearish trend.
The colors are brighter and more vibrant as perceived trend strength increases.
-> Dimension - A thermal gradient that shows cooler colors when dimension is higher, and hotter colors when dimension is lower.
Both color schemes are dependent on the designated dimension thresholds.
The script comes equipped with alerts for entries, additional entries, exits, partial exits, and protective stops so you can automate more and stare at your charts less.
And lastly, the script comes equipped with additional external outputs to further your analysis:
-> Entry And Exit Signals - Outputs in the same format as the external signal input with these additions: 5=Bull Increase, -5=Bear Increase, 6=Bull Reduce, -6=Bear Reduce.
You can use these to send to other scripts, including strategy types so you can backtest your performance on TV’s engine.
-> Dominant Trend - Outputs 1 for bullish and -1 for bearish. Can be used to send trend signals to another script.
I designed this tool with individuality in mind.
Every trader has a different situation. We trade on different schedules, markets, perspectives, etc.
Analytical systems of basically any type are very seldom (if ever) “one size fits all” and usually require a fair amount of modification to achieve desirable results.
That’s why this system is so freely customizable.
Your system should be flexible enough to be tailored to your analytical style, not the other way around.
When a system is limited in what you can control, it limits your experience, analytical potential, and possibly even profitability.
This is not your typical pre-set system. If you're looking for just another "buy, sell" script that requires minimal thought, look elsewhere.
If you’re ready to dive into a powerful technical system that allows you to tailor the experience to your style, welcome!
-----------------------------------------------------------------------------------------------------------------------------------------------------------------
This is a premium script, and access is granted on an invite-only basis.
To gain access, get a copy of the system overview, or for additional inquiries, send me a direct message.
I look forward to hearing from you!
-----------------------------------------------------------------------------------------------------------------------------------------------------------------
General Disclaimer:
Trading stocks, futures, Forex, options, ETFs, cryptocurrencies or any other financial instrument has large potential rewards, but also large potential risk.
You must be aware of the risks and be willing to accept them in order to invest in stocks, futures, Forex, options, ETFs or cryptocurrencies.
Don’t trade with money you can’t afford to lose.
This is neither a solicitation nor an offer to Buy/Sell stocks, futures, Forex, options, ETFs, cryptocurrencies or any other financial instrument.
No representation is being made that any account will or is likely to achieve profits or losses of any kind.
The past performance of any trading system or methodology is not necessarily indicative of future results.
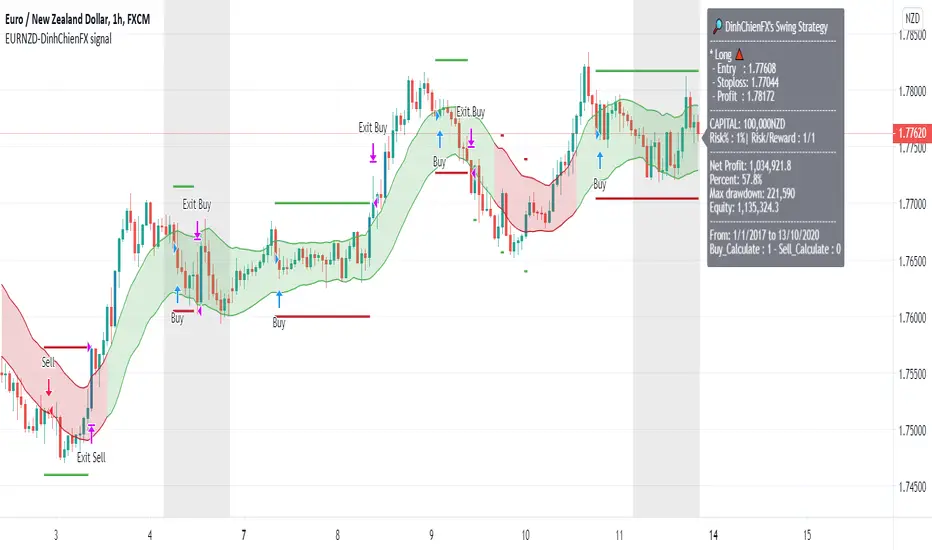
EURNZD signal [DinhChienFX Corner] V1.0The right screen is never predicting before. Just a the best result at the history for confident to using for Trade.
------------------------
Risk: 1%.
1. The Long signal is calculate by the RSI indicator crossover 70, wait to Buy when the price corrects and crossunders the Upper Keltner Channel.
2. The Short signal is calculate by the RSI indicator crossunder 30, wait to Sell when the price corrects and crossovers the Lower Keltner Channel.
3. Stoploss and Take Profit is calculated by Plus or Minus the Average True Range indicator from the Price Entry.
4. Report the result at Backtest:
a. The Long-term result: 1/1/2017 - 13 Sep 2020
b. The Mid-tern result (every year):
- From 1/1/2017 to 1/1/2018:
- From 1/1/2018 to 1/1/2019:
- From 1/1/2019 to 1/1/2020:
c. The Short-term result:
- From 1/1/2020 - 13 Sep 2020
---------------------------------------
The right screen is never predicting before. Just a the best result at the history for confident to using for Trade.
---------------------------------------
"Use the link below to obtain access to this indicator" or "PM us to obtain access"
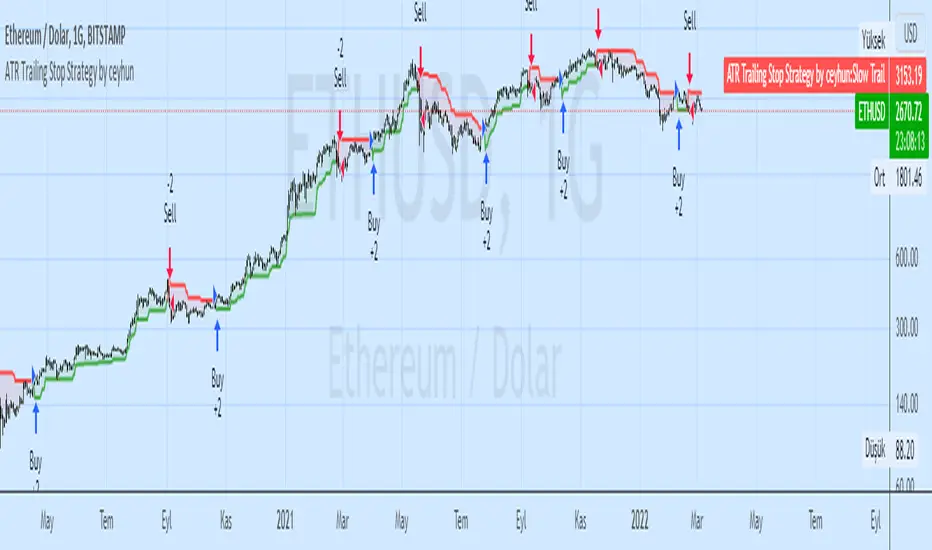
ATR Trailing Stop Strategy by ceyhunSame coding only coloring and strategy version added
//Barcolor
Green = Trail1 > Trail2 and close > Trail2 and low > Trail2
Blue = Trail1 > Trail2 and close > Trail2 and low < Trail2
Red = Trail2 > Trail1 and close < Trail2 and high < Trail2
Yellow = Trail2 > Trail1 and close < Trail2 and high > Trail2
//It gives White color where there is deterioration.
Let's not use InfoPanel in strategy, it would be wrong as it signals the next day.
ATR Trailing Stoploss StrategyI am sharing the strategy version of the indicator used before. It is very simple to use.
These are the settings I use, you can change, test and use as you wish.
Atr Period 5
Highest High Period 10
Multiplier 2.5
It can generate more signals in shorter time frames.
The success rate will be higher in longer time frames.

HV/IV Options Indicator - Muthu SThis HV/IV indicator helps you to select an opt Option Strategy. It creates 5 areas & each area defines the present status of the option premium, which varies from Very Low to Very High. From the bottom, (Option Premium is)
Area 1. Very Low
Area 2. Low
Area 3. Fair
Area 4. High
Area 5. Very High
Find which area, current Implied Volatility (User Input) belongs in & choose the option strategy accordingly. Implied Volatility is marked in Black colour circles.
Kindly note, Prior knowledge of Options, Volatility (Historical & Implied) is mandatory to use this indicator. This is shared for education purpose only.

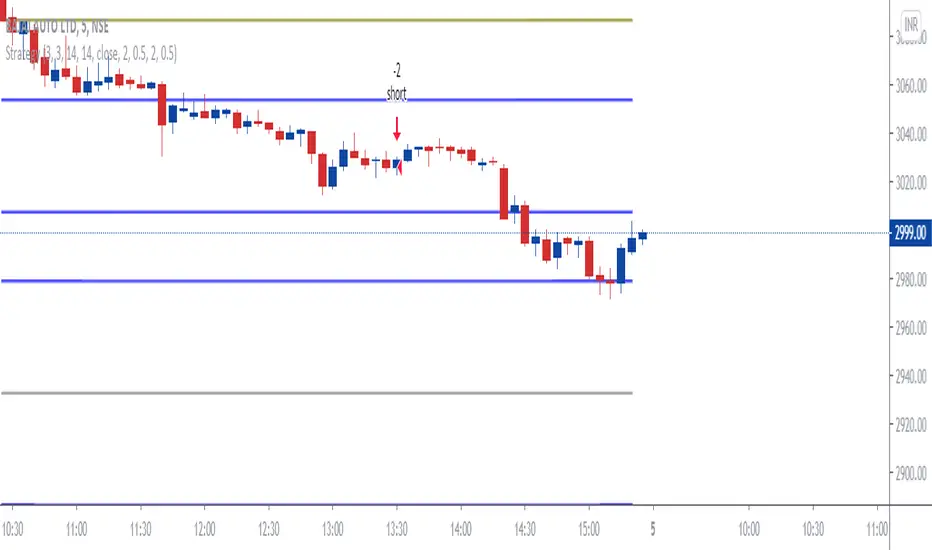
NZDJPY signal [DinhChienFX Corner] Ver 1.0The right screen is never predicting before. Just a the best result at the history for confident to using for Trade.
------------------------
Risk: 1%.
1. The Long signal is calculate by the Close of candle crossing up The Keltner Channel Upper.
2. The Short {Sell] signal is calculate by the Close of candle crossing down The Keltner Channel Lower.
3. Reset the Up/Down confirm at Entry.
4. Don''t entry when occurs the Reversal Candle (over 80% the Heigh of Keltner Channel).
a. Not filter the Candel is over 80%.
b. Filter the Candel is over 80% for Not Entry.
5. Stoploss and Take Profit is calculated by Plus or Minus from the Price Entry.
6. Report the result at Backtest:
a. The Long-term result:
b. The Mid-tern result (every year):
- From 1/1/2017 to 1/1/2018:
- From 1/1/2018 to 1/1/2019:
- From 1/1/2019 to 1/1/2020:
c. The Short-term result:
- From 1/1/2020 to 5 Sep 2020
---------------------------------------
The right screen is never predicting before. Just a the best result at the history for confident to using for Trade.
Thanks for watching .

The Lazy Trader - Index (ETF) Trend Following Robot50/150 moving average, index (ETF) trend following robot. Coded for people who cannot psychologically handle dollar-cost-averaging through bear markets and extreme drawdowns (although DCA can produce better results eventually), this robot helps you to avoid bear markets. Be a fair-weathered friend of Mr Market, and only take up his offer when the sun is shining! Designed for the lazy trader who really doesn't care...
Recommended Chart Settings:
Asset Class: ETF
Time Frame: Daily
Necessary ETF Macro Conditions:
a) Country must have healthy demographics, good ratio of young > old
b) Country population must be increasing
c) Country must be experiencing price-inflation
Default Robot Settings:
Slow Moving Average: 50 (integer) //adjust to suit your underlying index
Fast Moving Average: 150 (integer) //adjust to suit your underlying index
Bullish Slope Angle: 5 (degrees) //up angle of moving averages
Bearish Slope Angle: -5 (degrees) //down angle of moving averages
Average True Range: 14 (integer) //input for slope-angle formula
Risk: 100 (%) //100% risk means using all equity per trade
ETF Test Results (Default Settings):
SPY (1993 to 2020, 27 years), 332% profit, 20 trades, 6.4 profit factor, 7% drawdown
EWG (1996 to 2020, 24 years), 310% profit, 18 trades, 3.7 profit factor, 10% drawdown
EWH (1996 to 2020, 24 years), 4% loss, 26 trades, 0.9 profit factor, 36% drawdown
QQQ (1999 to 2020, 21 years), 232% profit, 17 trades, 3.6 profit factor, 2% drawdown
EEM (2003 to 2020, 17 years), 73% profit, 17 trades, 1.1 profit factor, 3% drawdown
GXC (2007 to 2020, 13 years), 18% profit, 14 trades, 1.3 profit factor, 26% drawdown
BKF (2009 to 2020, 11 years), 11% profit, 13 trades, 1.2 profit factor, 33% drawdown
A longer time in the markets is better, with the exception of EWH. 6 out of 7 tested ETFs were profitable, feel free to test on your favourite ETF (default settings) and comment below.
Risk Warning:
Not tested on commodities nor other financial products like currencies (code will not work), feel free to leave comments below.
Moving Average Slope Angle Formula:
Reproduced and modified from source:
