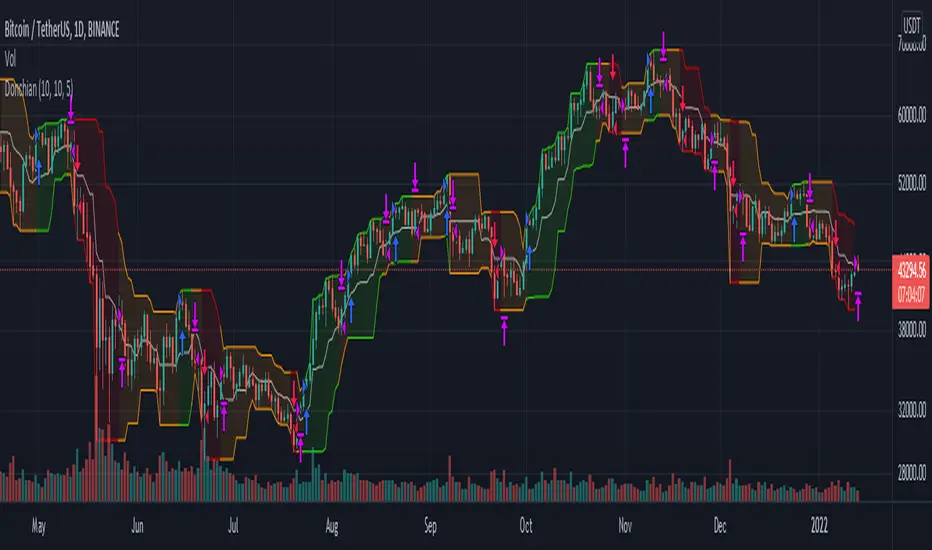
Triple ThreatThis indicator provides buy and sell signals for Bitcoin based on confluence from well-known momentum, volatility, and trend indicators. It has successfully captured the major directional trends on Bitcoin's daily chart since 2018, and the settings are currently optimized for this chart in particular. This indicator implements RSI to gauge momentum, BBWP to gauge volatility, and an EMA to gauge trend. Maximum confluence signals are represented by horizontal bars in the indicator's pane, where the tallest green bar is a confirmed buy signal, and the tallest red bar is a confirmed sell signal. The shortest bar represents a momentum-only signal, and the second-shortest bar represents a volatility signal in confluence with the previously given momentum signal.
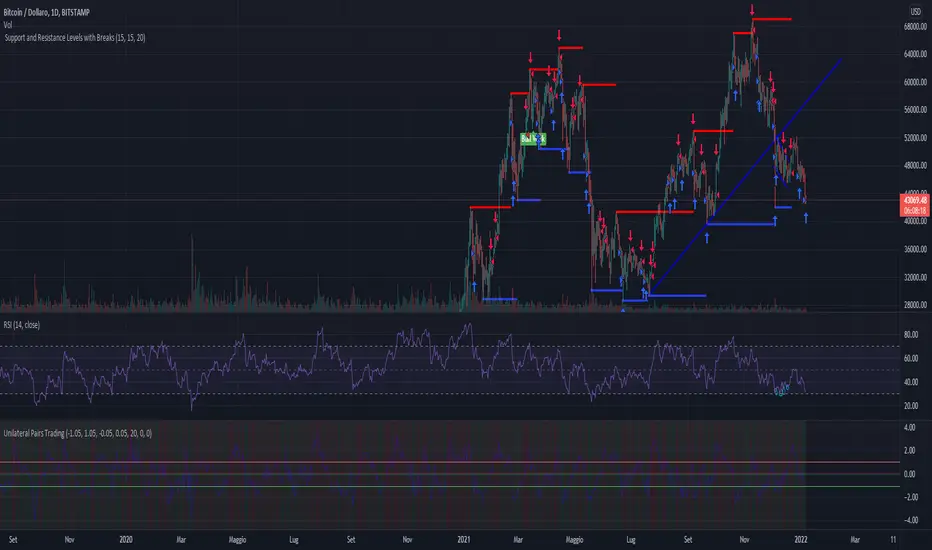
To track momentum, the RSI is plotted to the indicator plane against a moving average of the RSI. A momentum signal is generated when the RSI crosses over its moving average, retests/approaches the moving average, and then continues in the crossover direction (i.e., it fails to cross the moving average to the opposite side, creating a successful retest). The settings that affect this trigger are the "Crossover Threshold," which specifies how much the RSI should exceed the moving average to be considered a crossover, and the "Retest threshold," which specifies how closely the RSI should approach the moving average to be considered a retest. A momentum signal is ALSO generated if the RSI or its moving average exceed their counterpart by a certain threshold. For example, if the threshold was set at 10, a BUY signal would be generated when the RSI exceeds the moving average by 10, or a SELL signal would be generated when the moving average exceeds the RSI by 10. This threshold can be set using the "Instant Signal Threshold" setting. Either type of momentum signal will be plotted on the pane as the shortest horizontal bar, with its color indicating the signal's direction.
Volatility is primarily measured using the Bollinger Band Width Percentile (BBWP) indicator, which was created by The_Caretaker. BBWP plots the volatility of the asset's price, given by Bollinger Band width, relative to past volatility by assigning the volatility readings into percentiles. The indicator also includes a moving average of the BBWP itself, where a crossover to the upside represents expanding volatility and a crossover to the downside represents contracting volatility. This indicator is used to confirm a signal given by the momentum indicators - a momentum signal that is given during a period of expanding volatility has a greater likelihood of success. Therefore, when the BBWP crosses above its moving average by a given threshold, a previously triggered momentum signal is considered to be "confirmed." The threshold for this crossover can be set using the "BBWP Confirmation Threshold" setting. However, it is also relevant that periods of extreme volatility often accompany an extremity in price action (a "top" or "bottom"), in which case the BBWP is likely to contract after price reaches such an extremity. This phenomenon is captured by also using "extreme reads" on the momentum indicator to signal that there has already been enough volatility to confirm a momentum signal. If the RSI gives an "extreme read" before triggering a signal, the momentum signal is also considered to be confirmed. For example, if the RSI is above 80, breaks below 80, and then gives a SELL signal, this sell signal is considered to be confirmed without requiring the BBWP to crossover its moving average to the upside. The threshold that would confirm a SELL signal can be set with the "Overbought" setting, and the threshold that would confirm a BUY signal can be set with the "Oversold" setting. Whenever a volatility signal confirms a momentum signal, a medium-sized horizontal bar will be plotted on the pane in the same directional color as the momentum signal. Note that a momentum signal may trigger at the exact same time as the volatility signal which confirms it; in this case, only the medium-sized bar will be visible on the pane, but its direction can still be identified by its color.
Lastly, to reduce the likelihood of "false signals," a trend indicator is used to confirm the direction of the signal. This is typically an exponential moving average. If a confirmed volatility SELL signal is given, and the closing price is below the moving average, then the SELL signal is also confirmed by the trend. Likewise, if a confirmed volatility BUY signal is given, and the closing price is above the moving average, then the BUY signal is confirmed by the trend. The type and length of the moving average used to verify the trend can be set using the "Moving Average Type" and "Moving Average Length" settings found below the momentum/volatility settings. A trend signal is plotted on the pane as a tall horizontal bar, and is more deeply colored than the momentum and volatility signals.
For maximum confluence, it is recommended that the trend signal, given by the tallest bar, is the one that forms the basis of trades executed while using the Triple Threat indicator. It is possible to enter more aggressive trades with better entries by using only the volatility signal, given by the medium-sized bar, however this entails greater risk and should only be done in confluence with an additional trading strategy of your own discretion. Backtesting has shown that using the volatility signal alone underperforms using the volatility signal in confluence with the trend signal.
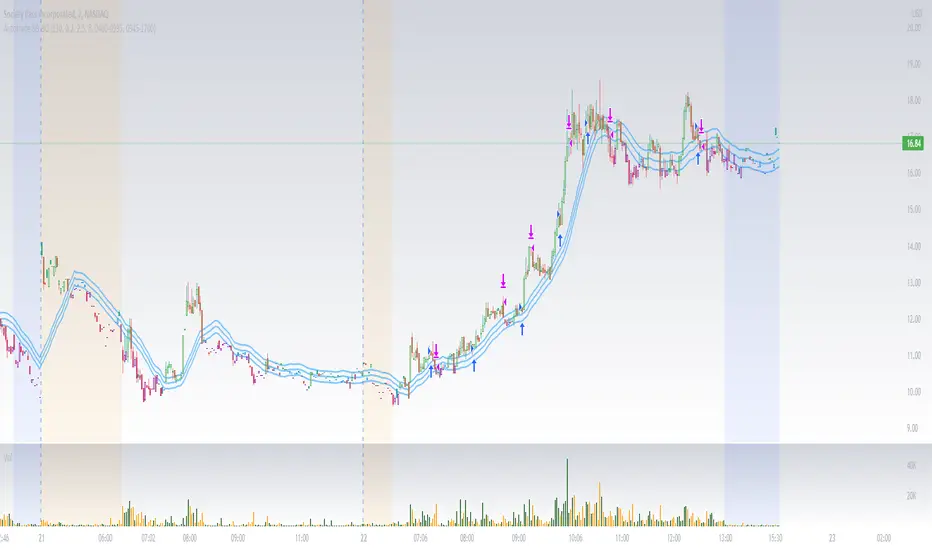
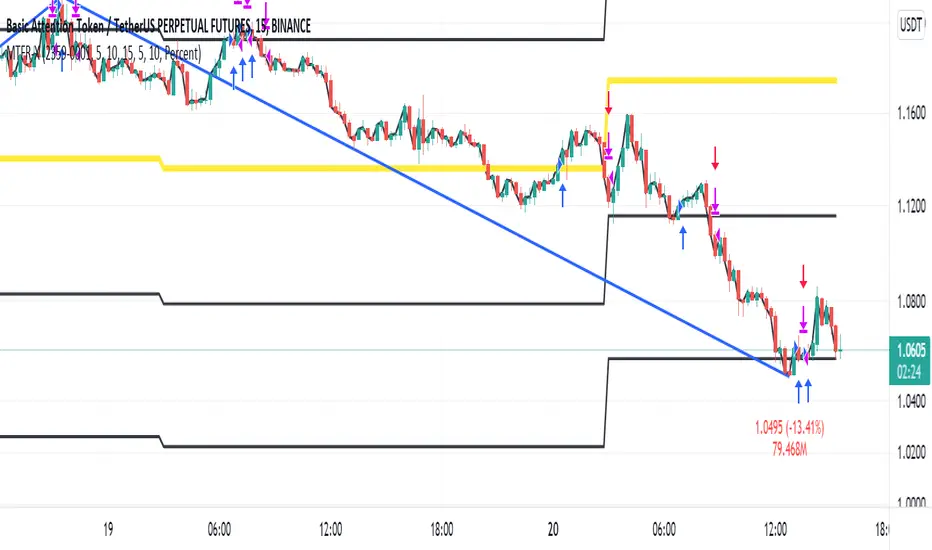
Please also be advised that the default setting are optimized for Bitcoin's daily chart only. The indicator is still applicable to other timeframes and asset classes, but the settings may need to be modified. I have a list of settings for other Bitcoin timeframes, and I would be happy to share them upon request.
I hope you can find this indicator to be of some use to your trading strategies. I'd be happy to hear any feedback from the community, so please don't hesitate to reach out. Stay safe, and happy trading.
Strategi Pine Script®