Time-Specific Volume AverageA volume indicator based on historic volume.
Checks for the average volume in the past few days at the same time of day. This helps you determine when there is truly volume in the markets.
We will see often see sustained volume above the average during a clear trend. If you see spikes in volume without it being sustained above the average, it is very likely that the trend will die off quickly.
This is very helpful in determining whether to trade based on a trend following system, or a range based system.
Settings are below:
Days to average: Number of days to look back(tradingview has limits depending on your plan)
SMA Length: Number of "volume averages" to look at. Keep this at 1 if you want the average volume at the exact moment in the day. If you increase it, will also average in the past few candles of "volume averages".
SMA Multiplier: Multiplies the SMA by this amount(helps to get higher quality trends)
Ketidakstabilan

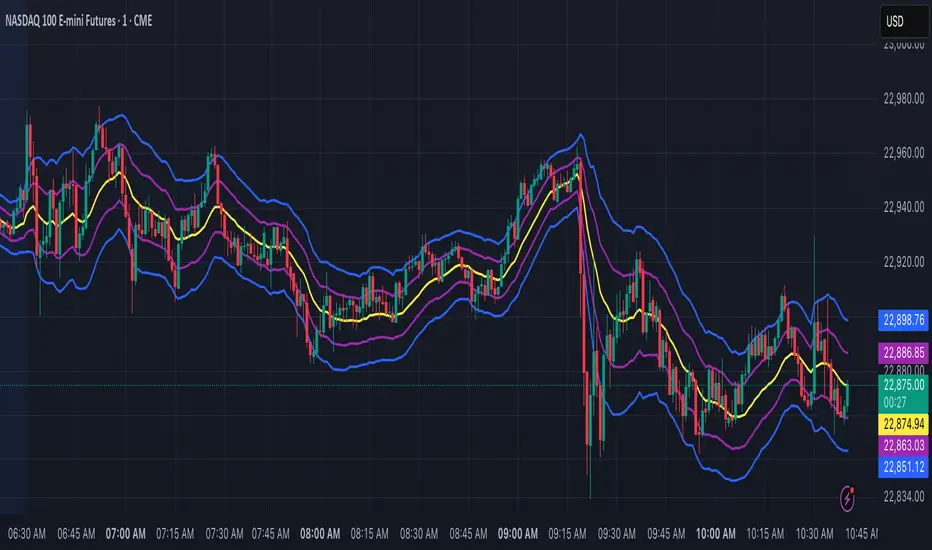
Dynamic Ray BandsAbout Dynamic Ray Bands
Dynamic Ray Bands is a volatility-adaptive envelope indicator that adjusts in real time to evolving market conditions. It uses a Double Exponential Moving Average (DEMA) as its central trend reference, with upper and lower bands scaled according to current volatility measured by the Average True Range (ATR).
This creates a dynamic structure that visually frames price action, helping traders identify areas of potential trend continuation, overextension, or mean reversion.
How It Works
🟡 Centerline (DEMA)
The central yellow line is a Double Exponential Moving Average, which offers a smoother, less laggy trend signal than traditional moving averages. It represents the market’s short- to medium-term “equilibrium.”
🔵 Outer Bands
Plotted at:
Upper Band = DEMA + (ATR × outerMultiplier)
Lower Band = DEMA - (ATR × outerMultiplier)
These bands define the extreme bounds of current volatility. When price breaks above or below them, it can signal strong directional momentum or overbought/oversold conditions, depending on context. They're often used as trend breakout zones or to time exits after extended runs.
🟣 Inner Bands
Plotted closer to the DEMA:
Inner Upper = DEMA + (ATR × innerMultiplier)
Inner Lower = DEMA - (ATR × innerMultiplier)
These are preliminary volatility thresholds, offering early cues for potential expansion or reversal. They may be used for scalping, tight stop zones, or pre-breakout positioning.
🔁 Dynamic Width (Bands are Dynamically Adjusted Per Tick)
The width of both inner and outer bands is based on ATR (Average True Range), which is recalculated in real time. This means:
During high volatility, the bands expand, allowing for wider price fluctuations.
During low volatility, the bands contract, tightening range expectations.
Unlike fixed-width channels or standard Bollinger Bands (which use standard deviation), this per-tick adjustment via ATR enables Dynamic Ray Bands to reduce false signals in choppy markets and remain more reactive during trending conditions.
⚙️ Inputs
DMA Length — Period for the central DEMA.
ATR Length — Lookback used for ATR volatility calculations.
Outer Band Multiplier — Controls sensitivity of extreme bands.
Inner Band Multiplier — Controls proximity of inner bands.
Show Inner Bands — Toggle for plotting the inner zone.
🔔 Alerts
Alert conditions are included for:
Price closing above/below the outer bands (trend momentum or overextension)
Price closing above/below the inner bands (early signs of strength/weakness)
🧭 Use Cases
Breakout detection — Catch price continuation beyond the outer bands.
Volatility filtering — Adjust trade logic based on band width.
Mean reversion — Monitor for snapbacks toward the DEMA after price stretches too far.
Trend guidance — Use band slope and price position to confirm direction.
⚠️ Disclaimer
This script is intended for educational and informational purposes only. It does not constitute financial advice or a recommendation to trade any specific market or security. Always test indicators thoroughly before using them in live trading.
Volatility Zones (STDEV %)This indicator calculates and visualizes the relative price volatility of any asset, expressed as a percentage of standard deviation over a rolling window.
🧠 How it works:
- Calculates rolling standard deviation of price (close) as a percentage of the current price.
- Classifies market into three volatility regimes :
• Low Volatility (≤2%) → Blue zone
• Medium Volatility (2–4%) → Orange zone
• High Volatility (>4%) → Red zone
📊 Why it matters:
Volatility structure reflects the underlying regime of the market — ranging, expanding, or trending. This tool helps traders:
- Spot optimal low-risk entry conditions
- Avoid chop zones or highly erratic moves
- Time breakouts or trend initiations
🛠 Usage:
- Works on any timeframe and instrument
- Adjustable lookback period
- Best used alongside trend filters or entry signals (e.g., SuperTrend, EMAs, etc.)

Convergence [by Oberlunar]
The Convergence Indicator by Oberlunar is a multi-timeframe analysis tool that identifies and visualizes trend convergence across up to 10 configurable timeframes using advanced customizable moving averages, including Hull, OberX (a Hull mod), THMA, EMA, and SMA, with an optional pseudo-Hilbert Transform.
It provides a clear visual overlay through gradual fill areas that highlight bullish and bearish trends while offering a fully configurable dynamic table to monitor live trend states across all selected timeframes with user-defined colors and positioning.
This tool is designed for traders who seek to pinpoint multi-timeframe convergence points to enhance their decision-making process in trend-following and breakout strategies.
Oberlunar 👁️⭐

Adaptive Causal Wavelet Trend FilterThe Adaptive Causal Wavelet Trend Filter is a technical indicator implementing causal approximations of wavelet transform properties for better trend detection with adaptive volatility response.
The Adaptive Causal Wavelet Trend Filter (ACWTF) applies mathematical principles derived from wavelet analysis to financial time series, providing robust trend identification with minimal lag. Unlike conventional moving averages, it preserves significant price movements while filtering market noise through signal processing that i describe below.
I was inspired to build this indicator after reading " Wavelet-Based Trend Identification in Financial Time Series " by In, F., & Kim, S. 2013 and reading about Mexican Hat wavelet filters.
The ACWTF maintains optimal performance across varying market regimes without requiring parameter adjustments by adapting filter characteristics to current volatility conditions.
Mathematical Foundation
Inspired by the Mexican Hat wavelet (Ricker wavelet), this indicator implements causal approximations of wavelet filters optimized for real-time financial analysis. The multi-resolution approach identifies features at different scales and the adaptive component dynamically adjusts filtering characteristics based on local volatility measurements.
Key mathematical properties include:
Non-linear frequency response adaptation
Edge-preserving signal extraction
Scale-space analysis through dual filter implementation
Volatility-dependent coefficient adjustment, which I love
Filter Methods
Adaptive: Implements a volatility-weighted combination of multiple filter types to optimize the time-frequency resolution trade-off
Hull: Provides a causal approximation of wavelet edge detection properties with forward-projection characteristics
VWMA: Incorporates volume information into the filtering process for enhanced signal detection
EMA Cascade: Creates a multi-pole filter structure that approximates certain wavelet scaling properties
Suggestion: try all as they will provide slightly different signals. Try also different time-frames.
Practical Applications
Trend Direction Identification: Clear visual trend direction with reduced noise and lag
Regime Change Detection: Early identification of significant trend reversals
Market Condition Analysis: Integrated volatility metrics provide context for current market behavior
Multi-timeframe Confirmation: Alignment between primary and secondary filters offers additional confirmation
Entry/Exit Timing: Filter crossovers and trend changes provide potential trading signals
The comprehensive information panel provides:
Current filter method and trend state
Trend alignment between timeframes
Real-time volatility assessment
Price position relative to filter
Overall trading bias based on multiple factors
Implementation Notes
Log returns option provides improved statistical properties for financial time series
Primary and secondary filter lengths can be adjusted to optimize for specific instruments and timeframes
The indicator performs particularly well during trend transitions and regime changes
The indicator reduces the need for using additional indicators to check trend reversion

RSI- RSI 8 Level Indicator
- Finally, The Bullish and Bearish 8 Level Power Zone indicator with alerts on each level!
Customize the colors however you like and remember if you need to set alerts you can also do that in the alerts section of the indicator. Just make sure what level the alert is for, and always look out for regular divergence, hidden divergence, and exaggerated divergence using this indicator that goes along with the power zones. :)
- RSI Strategy
Trading Bullish & Bearish Power Zones using regular divergence, hidden divergence, and exaggerated divergence.
P.s.
90, 80, 50, 40 Bullish Power Zones in green
65, 55, 30, 20 Bearish Power Zones in red

Capital Risk OptimizerCapital Risk Optimizer 🛡️
The Capital Risk Optimizer is an educational tool designed to help traders study capital efficiency, risk management, and scaling strategies when using leverage.
This script calculates and visualizes essential metrics for managing leveraged positions, including:
Entry Price – The current market price.
Stop Loss Level – Automatically derived using the 30-bar lowest low minus 1 ATR (default: 14-period ATR), an approach designed to create a dynamic, volatility-adjusted stop loss.
Stop Loss Distance (%) – The percentage distance between entry and stop.
Maximum Safe Leverage – The highest leverage allowable without risking liquidation before your stop is reached.
Margin Required – The amount of collateral necessary to support the desired position size at the calculated leverage.
Position Size – The configurable notional value of your trade.
These outputs are presented in a clean, customizable table overlay so you can quickly understand how position sizing, volatility, and leverage interact.
By default, the script uses a 14-period ATR combined with the lowest low of the past 30 bars, providing an optimal balance between sensitivity and noise for defining stop placement. This methodology helps traders account for market volatility in a systematic way.
The Capital Risk Optimizer is particularly useful as a portfolio management tool, supporting traders who want to study how to scale into positions using risk-adjusted sizing and capital efficiency principles. It pairs best with backtested strategies, and does not directly produce signals of any kind.
How to Use:
Set your desired position size.
Adjust the ATR and lookback settings to fine-tune stop loss placement.
Study the resulting leverage and margin requirements in real time.
Use this information to simulate and visualize potential trade scenarios and capital allocation models.
Disclaimer:
This script is provided for educational and informational purposes only. It does not constitute financial advice and should not be relied upon for live trading decisions. Always do your own research and consult with a qualified professional before making any trading or investment decisions.

PRO Investing - ATR Quant.algo by proinvesting.coATR Quant.algo by PROInvesting.co
A powerful and visually intuitive trend-following system designed to capture high-momentum moves and avoid market chop.
Quant.algo combines a dynamic trend-following EMA with multi-level ATR volatility zones to provide a complete trading framework with clear entry signals, stop-loss levels, and take-profit targets.
Key Features:
Dynamic Trend EMA: A thick baseline that turns Green for uptrends and Red for downtrends. Only trade in the direction of the trend.
Multi-Level ATR Zones: Automatically adapting channels that define ideal zones for entries, stops, and profit-taking.
Volatility Filter: A smart filter that tints the background when volatility is expanding, helping you avoid sideways markets and only trade when the market is ready to move.
Pullback Entry Signals: Clear BUY and SELL arrows appear after a pullback to the EMA, providing high-probability entry points.
Simple Trading Rules:
Go LONG: When the baseline is Green, wait for a Green BUY arrow, and aim for the upper TP Zone. Place your stop below the orange Stop Zone line.
Go SHORT: When the baseline is Red, wait for a Red SELL arrow, and aim for the lower TP Zone. Place your stop above the orange Stop Zone line.
Best For:
Traders: Swing Traders & Position Traders.
Timeframes: 4-Hour (H4) and Daily (D1).
Assets: Trending markets (Indices, Forex, Crypto).

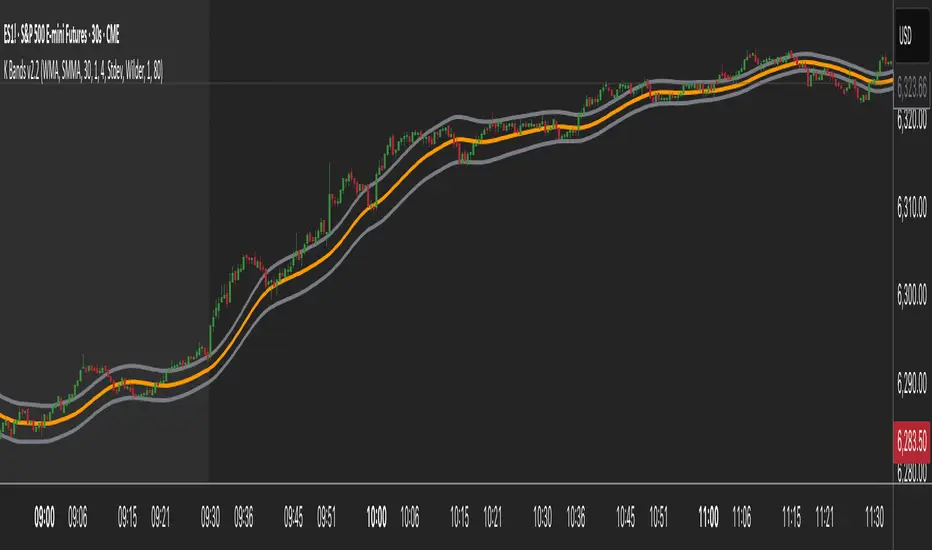
K Bands v2.2K Bands v2 - Settings Breakdown (Timeframe Agnostic)
K Bands v2 is an adaptive volatility envelope tool designed for flexibility across different trading
styles and timeframes.
The settings below allow complete control over how the bands are constructed, smoothed, and how
they respond to market volatility.
1. Upstream MA Type
Controls the core smoothing applied to price before calculating the bands.
Options:
- EMA: Fast, responsive, reacts quickly to price changes.
- SMA: Classic moving average, slower but provides stability.
- Hull: Ultra smooth, reduces noise significantly but may react differently to choppy conditions.
- GeoMean: Geometric mean smoothing, creates a unique, slightly smoother line.
- SMMA: Wilder-style smoothing, balances noise reduction and responsiveness.
- WMA: Weighted Moving Average, emphasizes recent price action for sharper responsiveness.
2. Smoothing Length
Lookback period for the upstream moving average.
- Lower values: Faster reaction, captures short-term shifts.
- Higher values: Smoother trend depiction, filters out noise.
3. Multiplier
Determines the width of the bands relative to calculated volatility.
- Lower multiplier: Tighter bands, more signals, but increased false breakouts.
- Higher multiplier: Wider bands, fewer false signals, more conservative.
4. Downstream MA Type
Applies final smoothing to the band plots after initial calculation.
Same options as Upstream MA.
5. Downstream Smoothing Length
Lookback period for downstream smoothing.
- Lower: More responsive bands.
- Higher: Smoother, visually cleaner bands.
6. Band Width Source
Selects the method used to calculate band width based on market volatility.
Options:
- ATR (Average True Range): Smooth, stable bands based on price range expansion.
- Stdev (Standard Deviation): More reactive bands highlighting short-term volatility spikes.
7. ATR Smoothing Type
Controls how the ATR or Stdev value is smoothed before applying to band width.
Options:
- Wilder: Classic, stable smoothing.
- SMA: Simple moving average smoothing.
- EMA: Faster, more reactive smoothing.
- Hull: Ultra-smooth, noise-reducing smoothing.
- GeoMean: Geometric mean smoothing.
8. ATR Length
Lookback period for smoothing the volatility measurement (ATR or Stdev).
- Lower: More reactive bands, captures quick shifts.
- Higher: Smoother, more stable bands.
9. Dynamic Multiplier Based on Volatility
Allows the band multiplier to adapt automatically to changes in market volatility.
- ON: Bands expand during high volatility and contract during low volatility.
- OFF: Bands remain fixed based on the set multiplier.
10. Dynamic Multiplier Sensitivity
Controls how aggressively the dynamic multiplier responds to volatility changes.
- Lower values: Subtle adjustments.
- Higher values: More aggressive band expansion/contraction.
K Bands v2 is designed to be adaptable across any market or timeframe, helping visualize price
structure, trend, and volatility behavior.
Supertrend AT v1.0📌 Supertrend AT v1.0 — Strategy Overview
Overview
Supertrend AT v1.0 is a fully automated trading strategy based on the Supertrend indicator.
It identifies trend reversals and places long or short entries accordingly, with built-in position sizing, stop-loss/take-profit management, and commission-aware calculations.
🚀 Key Features
✅ Entry Signals Based on Trend Reversals
Long entry when Supertrend changes from downtrend to uptrend
Short entry when Supertrend changes from uptrend to downtrend
✅ Risk-Based Position Sizing
Calculates position size so that a stop-loss only risks a fixed percentage (RPT) of total capital
✅ Reward/Risk Ratio-Based Target Price Calculation
Take-profit price is computed not by price difference, but by actual loss and desired reward-to-risk (RR) ratio
✅ Fully Commission-Aware
Commission is factored into entry, stop-loss, and take-profit price calculations
Ensure commission settings match in both the input panel and the strategy properties tab
✅ Dual Language Support
Switch between English and Korean interface
✅ Visual Trade Levels & Info Display
Entry, stop, and target prices plotted on the chart
Real-time open PnL and equity shown in an on-screen table
⚙️ How to Use
Apply Strategy to Chart
Load the strategy and configure the following parameters in both the Input tab and the Properties tab:
Commission rate (e.g., 0.05%)
Market decimal precision (e.g., 4 for 0.0001)
Adjust Entry Parameters
RPT: Risk per trade as a percentage of your total equity (e.g., 2%)
RR: Reward-to-risk ratio (e.g., 3 = target profit is 3× the potential loss)
Choose whether to allow Long or Short trades
For Auto-Trading Integration
Make sure the minimum order size is valid for your exchange
If the calculated quantity is below the exchange's minimum unit, it may result in errors
⚠️ Important Notes
❗ Non-Repainting — Supertrend is based on confirmed candles and does not repaint
❗ Backtest-Only — The strategy is for signal generation only and does not execute real trades without external automation
❗ Margin-Based Calculations — Default settings assume margin trading; adjust accordingly
📄 License & Disclaimer
This strategy is licensed under the Mozilla Public License 2.0.
This script is not financial advice. Use at your own risk.
Always test thoroughly with backtesting and paper trading before using in live markets.

Kelly Optimal Leverage IndicatorThe Kelly Optimal Leverage Indicator mathematically applies Kelly Criterion to determine optimal position sizing based on market conditions.
This indicator helps traders answer the critical question: "How much capital should I allocate to this trade?"
Note that "optimal position sizing" does not equal the position sizing that you should have. The Optima position sizing given by the indicator is based on historical data and cannot predict a crash, in which case, high leverage could be devastating.
Originally developed for gambling scenarios with known probabilities, the Kelly formula has been adapted here for financial markets to dynamically calculate the optimal leverage ratio that maximizes long-term capital growth while managing risk.
Key Features
Kelly Position Sizing: Uses historical returns and volatility to calculate mathematically optimal position sizes
Multiple Risk Profiles: Displays Full Kelly (aggressive), 3/4 Kelly (moderate), 1/2 Kelly (conservative), and 1/4 Kelly (very conservative) leverage levels
Volatility Adjustment: Automatically recommends appropriate Kelly fraction based on current market volatility
Return Smoothing: Option to use log returns and smoothed calculations for more stable signals
Comprehensive Table: Displays key metrics including annualized return, volatility, and recommended exposure levels
How to Use
Interpret the Lines: Each colored line represents a different Kelly fraction (risk tolerance level). When above zero, positive exposure is suggested; when below zero, reduce exposure. Note that this is based on historical returns. I personally like to increase my exposure during market downturns, but this is hard to illustrate in the indicator.
Monitor the Table: The information panel provides precise leverage recommendations and exposure guidance based on current market conditions.
Follow Recommended Position: Use the "Recommended Position" guidance in the table to determine appropriate exposure level.
Select Your Risk Profile: Conservative traders should follow the Half Kelly or Quarter Kelly lines, while more aggressive traders might consider the Three-Quarter or Full Kelly lines.
Adjust with Volatility: During high volatility periods, consider using more conservative Kelly fractions as recommended by the indicator.
Mathematical Foundation
The indicator calculates the optimal leverage (f*) using the formula:
f* = μ/σ²
Where:
μ is the annualized expected return
σ² is the annualized variance of returns
This approach balances potential gains against risk of ruin, offering a scientific framework for position sizing that maximizes long-term growth rate.
Notes
The Full Kelly is theoretically optimal for maximizing long-term growth but can experience significant drawdowns. You should almost never use full kelly.
Most practitioners use fractional Kelly strategies (1/2 or 1/4 Kelly) to reduce volatility while capturing most of the growth benefits
This indicator works best on daily timeframes but can be applied to any timeframe
Negative Kelly values suggest reducing or eliminating market exposure
The indicator should be used as part of a complete trading system, not in isolation
Enjoy the indicator! :)
P.S. If you are really geeky about the Kelly Criterion, I recommend the book The Kelly Capital Growth Investment Criterion by Edward O. Thorp and others.


EVaR Indicator and Position SizingThe Problem:
Financial markets consistently show "fat-tailed" distributions where extreme events occur with higher frequency than predicted by normal distributions (Gaussian or even log-normal). These fat tails manifest in sudden price crashes, volatility spikes, and black swan events that traditional risk measures like volatility can underestimate. Standard deviation and conventional VaR calculations assume normally distributed returns, leaving traders vulnerable to severe drawdowns during market stress.
Cryptocurrencies and volatile instruments display particularly pronounced fat-tailed behavior, with extreme moves occurring 5-10 times more frequently than normal distribution models would predict. This reality demands a more sophisticated approach to risk measurement and position sizing.
The Solution: Entropic Value at Risk (EVAR)
EVaR addresses these limitations by incorporating principles from statistical mechanics and information theory through Tsallis entropy. This advanced approach captures the non-linear dependencies and power-law distributions characteristic of real financial markets.
Entropy is more adaptive than standard deviations and volatility measures.
I was inspired to create this indicator after reading the paper " The End of Mean-Variance? Tsallis Entropy Revolutionises Portfolio Optimisation in Cryptocurrencies " by by Sana Gaied Chortane and Kamel Naoui.
Key advantages of EVAR over traditional risk measures:
Superior tail risk capture: More accurately quantifies the probability of extreme market moves
Adaptability to market regimes: Self-calibrates to changing volatility environments
Non-parametric flexibility: Makes less assumptions about the underlying return distribution
Forward-looking risk assessment: Better anticipates potential market changes (just look at the charts :)
Mathematically, EVAR is defined as:
EVAR_α(X) = inf_{z>0} {z * log(1/α * M_X(1/z))}
Where the moment-generating function is calculated using q-exponentials rather than conventional exponentials, allowing precise modeling of fat-tailed behavior.
Technical Implementation
This indicator implements EVAR through a q-exponential approach from Tsallis statistics:
Returns Calculation: Price returns are calculated over the lookback period
Moment Generating Function: Approximated using q-exponentials to account for fat tails
EVAR Computation: Derived from the MGF and confidence parameter
Normalization: Scaled to for intuitive visualization
Position Sizing: Inversely modulated based on normalized EVAR
The q-parameter controls tail sensitivity—higher values (1.5-2.0) increase the weighting of extreme events in the calculation, making the model more conservative during potentially turbulent conditions.
Indicator Components
1. EVAR Risk Visualization
Dynamic EVAR Plot: Color-coded from red to green normalized risk measurement (0-1)
Risk Thresholds: Reference lines at 0.3, 0.5, and 0.7 delineating risk zones
2. Position Sizing Matrix
Risk Assessment: Current risk level and raw EVAR value
Position Recommendations: Percentage allocation, dollar value, and quantity
Stop Parameters: Mathematically derived stop price with percentage distance
Drawdown Projection: Maximum theoretical loss if stop is triggered
Interpretation and Application
The normalized EVAR reading provides a probabilistic risk assessment:
< 0.3: Low risk environment with minimal tail concerns
0.3-0.5: Moderate risk with standard tail behavior
0.5-0.7: Elevated risk with increased probability of significant moves
> 0.7: High risk environment with substantial tail risk present
Position sizing is automatically calculated using an inverse relationship to EVAR, contracting during high-risk periods and expanding during low-risk conditions. This is a counter-cyclical approach that ensures consistent risk exposure across varying market regimes, especially when the market is hyped or overheated.
Parameter Optimization
For optimal risk assessment across market conditions:
Lookback Period: Determines the historical window for risk calculation
Q Parameter: Controls tail sensitivity (higher values increase conservatism)
Confidence Level: Sets the statistical threshold for risk assessment
For cryptocurrencies and highly volatile instruments, a q-parameter between 1.5-2.0 typically provides the most accurate risk assessment because it helps capturing the fat-tailed behavior characteristic of these markets. You can also increase the q-parameter for more conservative approaches.
Practical Applications
Adaptive Risk Management: Quantify and respond to changing tail risk conditions
Volatility-Normalized Positioning: Maintain consistent exposure across market regimes
Black Swan Detection: Early identification of potential extreme market conditions
Portfolio Construction: Apply consistent risk-based sizing across diverse instruments
This indicator is my own approach to entropy-based risk measures as an alterative to volatility and standard deviations and it helps with fat-tailed markets.
Enjoy!

VDN1 - T3 Tilson + IFT + ATRThis strategy combines three powerful indicators to create a high-quality and low-noise trading system:
🔹 T3 Tilson: Serves as the main trend indicator. It reacts smoothly to market direction changes while reducing noise.
🔹 Inverse Fisher Transform of RSI: A momentum filter that sharpens the signal precision. Only trades in the direction of positive or negative momentum.
🔹 ATR Filter: Avoids entries during low volatility (sideways) periods. Ensures the market is active enough before executing trades.
Core Logic:
* Long Entry: T3 Tilson rising + IFT(RSI) > 0 + ATR > threshold
* Short Entry: T3 Tilson falling + IFT(RSI) < 0 + ATR > threshold
* All trades use a fixed size of 1 unit for consistent risk evaluation.
Performance Notes:
* Works exceptionally well on index futures (e.g., NAS100, US30, GER40)
* Shows low drawdown and high profit factor (PF > 3) on those assets
* Also performs decently on XAUUSD, even with only \~32% win rate — thanks to favorable risk/reward
* BTC and ETH may require modified versions due to higher volatility and whipsaws
This is a master version — clean, unoptimized, and stable.
Use this as a core engine to build and test enhanced versions (e.g., with TP/SL, dynamic filters, etc.)
Happy testing and trading!

H BollingerBollinger Bands are a widely used technical analysis indicator that helps spot relative price highs and lows. The tool comprises three lines: a central band representing the 20-period simple moving average (SMA), and upper and lower bands usually placed two standard deviations above and below the SMA. These bands adjust with market volatility, offering insights into price fluctuations and trading conditions.
How this indicator works
Bollinger Bands helps traders assess price volatility and potential price reversals. They consist of three bands: the middle band, the upper band, and the lower band. Here's how Bollinger Bands work:
Middle band: This is typically a simple moving average (SMA) of the asset's price over a specified period. The most common period used is 20 days.
Upper band: This is calculated by adding a specified number of standard deviations to the middle band. The standard deviation measures the asset's price volatility. Commonly, two standard deviations are added to the middle band.
Lower band: Similar to the upper band, it is calculated by subtracting a specified number of standard deviations from the middle band.
What do Bollinger Bands tell you?
Bollinger bands primarily indicate the level of market volatility and trading opportunities. Narrow bands indicate low market volatility, while wide bands suggest high market volatility. Bollinger bands indicators can be used by traders to assess potential buy or sell signals. For instance, a sell signal may be interpreted or generated if the asset’s price moves closer or crosses the upper band, as it may indicate that the asset is overbought. Alternatively, a buy signal may be interpreted or generated if the price moves closer to the lower band, as it may signify that the asset is oversold.
However, traders should be cautious when using Bollinger Bands as standalone indicators when making trading decisions. Experienced traders refrain from confirming signals based on one indicator. Instead, they generally combine various technical indicators and fundamental analysis methods to make informed trading decisions. Basing trading decisions on only one indicator can result in misinterpretation of signals and heavy losses.
Bollinger Bands assist in identifying whether prices are relatively high or low. They are applied as a pair—upper and lower bands—alongside a moving average. However, these bands are not designed to be used in isolation. Instead, they should be used to validate signals generated by other technical indicators.
Calculation of Bollinger Band

Fear and Greed Index [DunesIsland]The Fear and Greed Index is a sentiment indicator designed to measure the emotions driving the stock market, specifically investor fear and greed. Fear represents pessimism and caution, while greed reflects optimism and risk-taking. This indicator aggregates multiple market metrics to provide a comprehensive view of market sentiment, helping traders and investors gauge whether the market is overly fearful or excessively greedy.How It WorksThe Fear and Greed Index is calculated using four key market indicators, each capturing a different aspect of market sentiment:
Market Momentum (30% weight)
Measures how the S&P 500 (SPX) is performing relative to its 125-day simple moving average (SMA).
A higher value indicates that the market is trading well above its moving average, signaling greed.
Stock Price Strength (20% weight)
Calculates the net number of stocks hitting 52-week highs minus those hitting 52-week lows on the NYSE.
A greater number of net highs suggests strong market breadth and greed.
Put/Call Options (30% weight)
Uses the 5-day average of the put/call ratio.
A lower ratio (more call options being bought) indicates greed, as investors are betting on rising prices.
Market Volatility (20% weight)
Utilizes the VIX index, which measures market volatility.
Lower volatility is associated with greed, as investors are less fearful of large market swings.
Each component is normalized using a z-score over a 252-day lookback period (approximately one trading year) and scaled to a range of 0 to 100. The final Fear and Greed Index is a weighted average of these four components, with the weights specified above.Key FeaturesIndex Range: The index value ranges from 0 to 100:
0–25: Extreme Fear (red)
25–50: Fear (orange)
50–75: Neutral (yellow)
75–100: Greed (green)
Dynamic Plot Color: The plot line changes color based on the index value, visually indicating the current sentiment zone.
Reference Lines: Horizontal lines are plotted at 0, 25, 50, 75, and 100 to represent the different sentiment levels: Extreme Fear, Fear, Neutral, Greed, and Extreme Greed.
How to Interpret
Low Values (0–25): Indicate extreme fear, which may suggest that the market is oversold and could be due for a rebound.
High Values (75–100): Indicate greed, which may signal that the market is overbought and could be at risk of a correction.
Neutral Range (25–75): Suggests a balanced market sentiment, neither overly fearful nor greedy.
This indicator is a valuable tool for contrarian investors, as extreme readings often precede market reversals. However, it should be used in conjunction with other technical and fundamental analysis tools for a well-rounded view of the market.

Institutional Momentum Scanner [IMS]Institutional Momentum Scanner - Professional Momentum Detection System
Hunt explosive price movements like the professionals. IMS identifies maximum momentum displacement within 10-bar windows, revealing where institutional money commits to directional moves.
KEY FEATURES:
▪ Scans for strongest momentum in rolling 10-bar windows (institutional accumulation period)
▪ Adaptive filtering reduces false signals using efficiency ratio technology
▪ Three clear states: LONG (green), SHORT (red), WAIT (gray)
▪ Dynamic volatility-adjusted thresholds (8% ATR-scaled)
▪ Visual momentum flow with glow effects for signal strength
BASED ON:
- Pocket Pivot concept (O'Neil/Morales) applied to price momentum
- Adaptive Moving Average principles (Kaufman KAMA)
- Market Wizards momentum philosophy
- Institutional order flow patterns (5-day verification window)
HOW IT WORKS:
The scanner finds the maximum price displacement in each 10-bar window - where the market showed its hand. An adaptive filter (5-bar regression) separates real moves from noise. When momentum exceeds the volatility-adjusted threshold, states change.
IDEAL FOR:
- Momentum traders seeking explosive moves
- Swing traders (especially 4H timeframe)
- Position traders wanting institutional footprints
- Anyone tired of false breakout signals
Default parameters (10,5) optimized for 4H charts but adaptable to any timeframe. Remember: The market rewards patience and punishes heroes. Wait for clear signals.
"The market is honest. Are you?"

Forex Monday RangeForex Monday Range. Refers to the price range (high to low) established during Monday's trading session, typically measured from midnight Sunday to midnight Monday (New York time).

NASDAQ Smart Momentum Strategy v4.1 BoostedTry to trade Nasdaq with it in 15 min time frame just build today. GL

Adiyogi Trend🟢🔴 “Adiyogi” Trend — Market Alignment Visualizer
“Adiyogi” Trend is a powerful, non-intrusive trend detection system built for traders who seek clarity, discipline, and alignment with true market flow. Inspired by the meditative stillness of Adiyogi and the need for mindful, high-probability decisions, this tool offers a clean and intuitive visual guide to trending environments — without cluttering the chart or pushing forced trades.
This is not a buy/sell signal generator. Instead, it is designed as a background confirmation engine that helps you stay on the right side of the market by identifying moments of true directional strength.
🧠 Core Logic
The “Adiyogi” Trend indicator highlights the background of your chart in green or red when multiple layers of strength and structure align — including momentum, market positioning, and relative force. Only when these internal components agree does the system activate a directional state.
It’s built on three foundational energies of trend confirmation:
Strength of movement
Structure in price action
Conviction in momentum
By combining these into one visual background, the indicator filters out indecision and helps you stay focused during real trend phases — whether you're day trading, swing trading, or holding longer-term positions.
📌 Core Concepts Behind the Tool
The indicator integrates three essential market filters—each confirming a different dimension of trend strength:
ADX (Average Directional Index) – Measures trend momentum.
You’ve chosen a very responsive setting (ADX Length = 2), which helps catch the earliest possible signs of momentum emergence.
The threshold is ADX ≥ 22, ensuring that weak or sideways markets are filtered out.
SuperTrend (10,1) – Captures short-term trend direction.
This setup follows price closely and reacts quickly to reversals, making it ideal for fast-moving assets or intraday strategies.
SuperTrend acts as the structural confirmation of directional bias.
RSI (Relative Strength Index) – Measures strength based on recent price closes.
You’ve configured RSI > 50 for bullish zones and < 50 for bearish—a neutral midpoint standard often used by professional traders.
This ensures that only trades in sync with momentum and recent strength are highlighted.
🌈 How It Visually Works
Background turns GREEN when:
ADX ≥ 22, indicating strong momentum
Price is above the 20 EMA and above SuperTrend (10,1)
RSI > 50, confirming recent strength
Background turns RED when:
ADX ≥ 22, indicating strong momentum
Price is below the 20 EMA and below SuperTrend (10,1)
RSI < 50, confirming recent weakness
The background remains neutral (transparent) when trend conditions are not clearly aligned—this is the tool's way of keeping you out of indecisive markets.
A label (BULL / BEAR) appears only when the bias flips from the previous one. This helps avoid repeated or redundant alerts, focusing your attention only when something changes.
📊 Practical Uses & Benefits
✅ Stay with the trend: Perfectly filters out choppy or sideways markets by only activating when conditions align across momentum, structure, and strength.
✅ Pre-trade confirmation: Use this tool to confirm trade setups from other indicators or price action patterns.
✅ Avoid noise: Prevent overtrading by focusing only on high-quality trend conditions.
✅ Visual clarity: Unlike arrows or plots that clutter the chart, this tool subtly highlights trend conditions in the background, preserving your price action view.
📍 Important Notes
This is not a buy/sell signal generator. It is a trend-confirmation system.
Use it in conjunction with your existing entry setups—such as breakouts, order blocks, retests, or candlestick patterns.
The tool helps you stay in sync with the dominant direction, especially when combining multiple timeframes.
Can be used on any market (stocks, forex, crypto, indices) and on any timeframe.

Faytterro Bands Breakout📌 Faytterro Bands Breakout 📌
This indicator was created as a strategy showcase for another script: Faytterro Bands
It’s meant to demonstrate a simple breakout strategy based on Faytterro Bands logic and includes performance tracking.
❓ What Is It?
This script is a visual breakout strategy based on a custom moving average and dynamic deviation bands, similar in concept to Bollinger Bands but with unique smoothing (centered regression) and performance features.
🔍 What Does It Do?
Detects breakouts above or below the Faytterro Band.
Plots visual trade entries and exits.
Labels each trade with percentage return.
Draws profit/loss lines for every trade.
Shows cumulative performance (compounded return).
Displays key metrics in the top-right corner:
Total Return
Win Rate
Total Trades
Number of Wins / Losses
🛠 How Does It Work?
Bullish Breakout: When price crosses above the upper band and stays above the midline.
Bearish Breakout: When price crosses below the lower band and stays below the midline.
Each trade is held until breakout invalidation, not a fixed TP/SL.
Trades are compounded, i.e., profits stack up realistically over time.
📈 Best Use Cases:
For traders who want to experiment with breakout strategies.
For visual learners who want to study past breakouts with performance metrics.
As a template to develop your own logic on top of Faytterro Bands.
⚠ Notes:
This is a strategy-like visual indicator, not an automated backtest.
It doesn't use strategy.* commands, so you can still use alerts and visuals.
You can tweak the logic to create your own backtest-ready strategy.
Unlike the original Faytterro Bands, this script does not repaint and is fully stable on closed candles.

Frahm Factor Position Size CalculatorThe Frahm Factor Position Size Calculator is a powerful evolution of the original Frahm Factor script, leveraging its volatility analysis to dynamically adjust trading risk. This Pine Script for TradingView uses the Frahm Factor’s volatility score (1-10) to set risk percentages (1.75% to 5%) for both Margin-Based and Equity-Based position sizing. A compact table on the main chart displays Risk per Trade, Frahm Factor, and Average Candle Size, making it an essential tool for traders aligning risk with market conditions.
Calculates a volatility score (1-10) using true range percentile rank over a customizable look-back window (default 24 hours).
Dynamically sets risk percentage based on volatility:
Low volatility (score ≤ 3): 5% risk for bolder trades.
High volatility (score ≥ 8): 1.75% risk for caution.
Medium volatility (score 4-7): Smoothly interpolated (e.g., 4 → 4.3%, 5 → 3.6%).
Adjustable sensitivity via Frahm Scale Multiplier (default 9) for tailored volatility response.
Position Sizing:
Margin-Based: Risk as a percentage of total margin (e.g., $175 for 1.75% of $10,000 at high volatility).
Equity-Based: Risk as a percentage of (equity - minimum balance) (e.g., $175 for 1.75% of ($15,000 - $5,000)).
Compact 1-3 row table shows:
Risk per Trade with Frahm score (e.g., “$175.00 (Frahm: 8)”).
Frahm Factor (e.g., “Frahm Factor: 8”).
Average Candle Size (e.g., “Avg Candle: 50 t”).
Toggles to show/hide Frahm Factor and Average Candle Size rows, with no empty backgrounds.
Four sizes: XL (18x7, large text), L (13x6, normal), M (9x5, small, default), S (8x4, tiny).
Repositionable (9 positions, default: top-right).
Customizable cell color, text color, and transparency.
Set Frahm Factor:
Frahm Window (hrs): Pick how far back to measure volatility (e.g., 24 hours). Shorter for fast markets, longer for chill ones.
Frahm Scale Multiplier: Set sensitivity (1-10, default 9). Higher makes the score jumpier; lower smooths it out.
Set Margin-Based:
Total Margin: Enter your account balance (e.g., $10,000). Risk auto-adjusts via Frahm Factor.
Set Equity-Based:
Total Equity: Enter your total account balance (e.g., $15,000).
Minimum Balance: Set to the lowest your account can go before liquidation (e.g., $5,000). Risk is based on the difference, auto-adjusted by Frahm Factor.
Customize Display:
Calculation Method: Pick Margin-Based or Equity-Based.
Table Position: Choose where the table sits (e.g., top_right).
Table Size: Select XL, L, M, or S (default M, small text).
Table Cell Color: Set background color (default blue).
Table Text Color: Set text color (default white).
Table Cell Transparency: Adjust transparency (0 = solid, 100 = invisible, default 80).
Show Frahm Factor & Show Avg Candle Size: Check to show these rows, uncheck to hide (default on).

Machine Learning Key Levels [AlgoAlpha]🟠 OVERVIEW
This script plots Machine Learning Key Levels on your chart by detecting historical pivot points and grouping them using agglomerative clustering to highlight price levels with the most past reactions. It combines a pivot detection, hierarchical clustering logic, and an optional silhouette method to automatically select the optimal number of key levels, giving you an adaptive way to visualize price zones where activity concentrated over time.
🟠 CONCEPTS
Agglomerative clustering is a bottom-up method that starts by treating each pivot as its own cluster, then repeatedly merges the two closest clusters based on the average distance between their members until only the desired number of clusters remain. This process creates a hierarchy of groupings that can flexibly describe patterns in how price reacts around certain levels. This offers an advantage over K-means clustering, since the number of clusters does not need to be predefined. In this script, it uses an average linkage approach, where distance between clusters is computed as the average pairwise distance of all contained points.
The script finds pivot highs and lows over a set lookback period and saves them in a buffer controlled by the Pivot Memory setting. When there are at least two pivots, it groups them using agglomerative clustering: it starts with each pivot as its own group and keeps merging the closest pairs based on their average distance until the desired number of clusters is left. This number can be fixed or chosen automatically with the silhouette method, which checks how well each point fits in its cluster compared to others (higher scores mean cleaner separation). Once clustering finishes, the script takes the average price of each cluster to create key levels, sorts them, and draws horizontal lines with labels and colors showing their strength. A metrics table can also display details about the clusters to help you understand how the levels were calculated.
🟠 FEATURES
Agglomerative clustering engine with average linkage to merge pivots into level groups.
Dynamic lines showing each cluster’s price level for clarity.
Labels indicating level strength either as percent of all pivots or raw counts.
A metrics table displaying pivot count, cluster count, silhouette score, and cluster size data.
Optional silhouette-based auto-selection of cluster count to adaptively find the best fit.
🟠 USAGE
Add the indicator to any chart. Choose how far back to detect pivots using Pivot Length and set Pivot Memory to control how many are kept for clustering (more pivots give smoother levels but can slow performance). If you want the script to pick the number of levels automatically, enable Auto No. Levels ; otherwise, set Number of Levels . The colored horizontal lines represent the calculated key levels, and circles show where pivots occurred colored by which cluster they belong to. The labels beside each level indicate its strength, so you can see which levels are supported by more pivots. If Show Metrics Table is enabled, you will see statistics about the clustering in the corner you selected. Use this tool to spot areas where price often reacts and to plan entries or exits around levels that have been significant over time. Adjust settings to better match volatility and history depth of your instrument.
