VWMA Trend FilterHere's a simple tool for determining long term trend direction using two Volume Weighted Moving Averages (VWMA). The VWMA's emphasis on volume often makes it a better measurement for trend direction than the more popular Exponential Moving Average (EMA).
Trend direction is determined by comparing a fast and slow VWMA. The default length for the fast VWMA is 50 periods, while the slow uses a default length of 200. Both of these lengths can be modified in the input options menu. The default source for the VWMA's is HLC3((high + low + close) / 3).
If the fast VWMA is greater than the slow VWMA, then the trend is bullish and the background color is green. If the fast VWMA is less than the slow VWMA, then it is bearish and the background color is red.
We included an option to change the candle color based on whether the VWMA's indicate a bullish or bearish trend as well.
Overall, this is one of those utility tools that we like to use as an overlay over the main price chart and in conjunction with other signal generating indicators. Its purpose isn't to generate buy and sell signals, but it works well as a visual confirmation tool to help traders gauge trend direction.
Volume Weighted Moving Average (VWMA)

Sinyal GhoibLeading Signal!!!
Long entry while long signal appears.
Short entry while short signal appears.
This signal only effective on BitMex | 5m | XBTUSD.
Take profit: 0,6% from entry price
Stop loss: 0,6% from entry price
Leverage: 10x - 50x
For donation
BTC: 3E7rUPX7upS8iTj42JdLt7keJVbJLfvMoH
ETH: 0x094ed88e4c5a9b225e936586cbc2d61f4a027f68
BitMex Referral: P81ZCO
Thank you & happy trading!


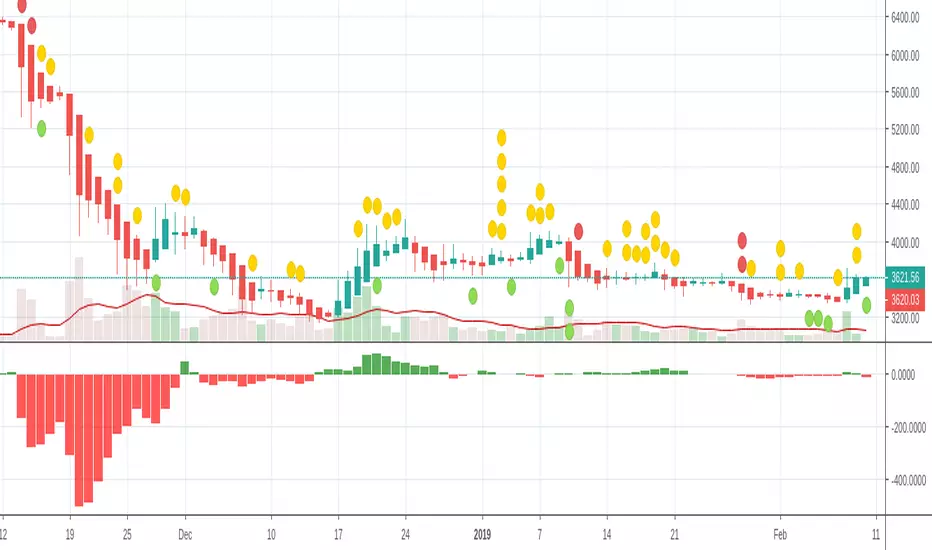
The WaveRunner Multiple Moving AveragesThe WaveRunner consists of a Triple Exponential Moving Average (or TEMA). This study first calculates the exponential moving average(EMA) of the security. It then finds the EMA of that first EMA and then finally calculates a third EMA based on the second EMA. Then, we added in a volume weighted moving average, allowing us to place greater emphasis on periods with higher volume.
Due to its minimal lag, the triple exponential moving average is a good tool for trend identification and volatility measurement. Adding in a VWMA further improves its accuracy as it provides another way to check the strength of a trend.
The first EMA is shown as the green line of circles. The EMA of that line is then plotted as the middle yellow line. Finally, the third EMA is the red line of circles. When the first EMA is greater than the third, it indicates a sustained positive trend and the area between the two lines is filled green. On the other hand, when the third EMA is greater than the first EMA, it indicates a negative trend and the area between the two lines is filled red. Finally, the VWMA is shown as the darker green and red areas both below and above the first EMA.
This indicator is best used for trend identification and confirmation, filtering out volatility. Reduced lag allows traders to interpret sharp price fluctuations.

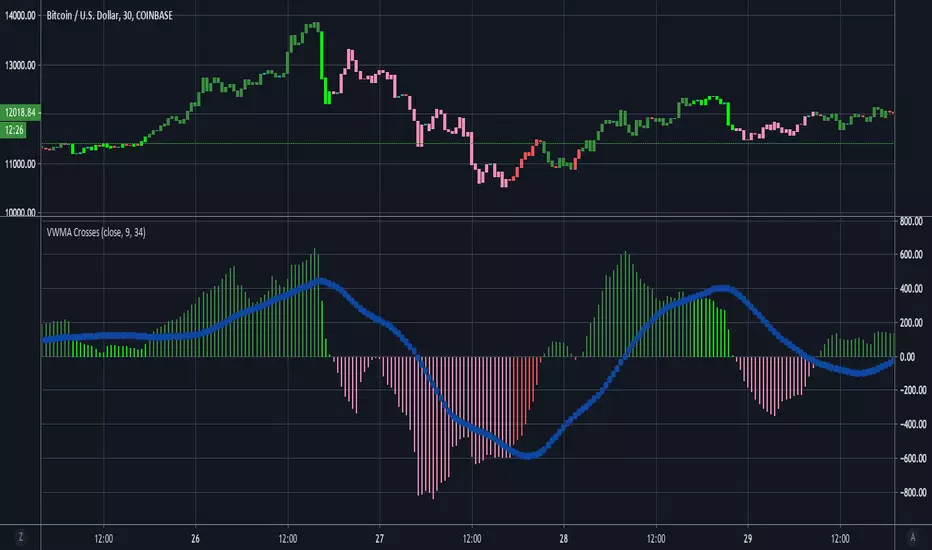
VWMA CrossesThis is a simple tool that gives traders a simple visual representation of Volume-Weighted Moving Average ( VWMA ) crossovers that is pretty similar to the MACD . We don't typically trade solely based on the VWMA , but it is definitely one of our go-to tools when combining multiple indicators.
When trading with VWMA's, it is common to enter a position when the fast VWMA crosses over the slow VWMA . In other words, the fast VWMA was previously less than the slow VWMA and is now greater in value than the slow VWMA . Conversely, traders often exit their positions when the fast VWMA crosses under the slow VWMA .
This tool plots the absolute value of the difference between the fast and slow VWMA's as a histogram. When the difference between the fast and slow VWMA's is greater than zero (meaning fast > slow), then the bars are green. The bars then turn red when the fast VWMA is less than the slow VWMA . The blue circle-line is a Simple Moving Average of the difference between the two lines.
Here's a quick guide to interpreting the chart:
if (fast VWMA > slow VWMA ) and (difference < sma of differences)
then color = lime green
if (fast VWMA > slow VWMA ) and (difference > sma of differences)
then color = dark green
if (fast VWMA < slow VWMA ) and (difference < sma of differences)
then color = light red
if (fast VWMA < slow VWMA ) and (difference > sma of differences)
then color = dark red
~Happy Trading~
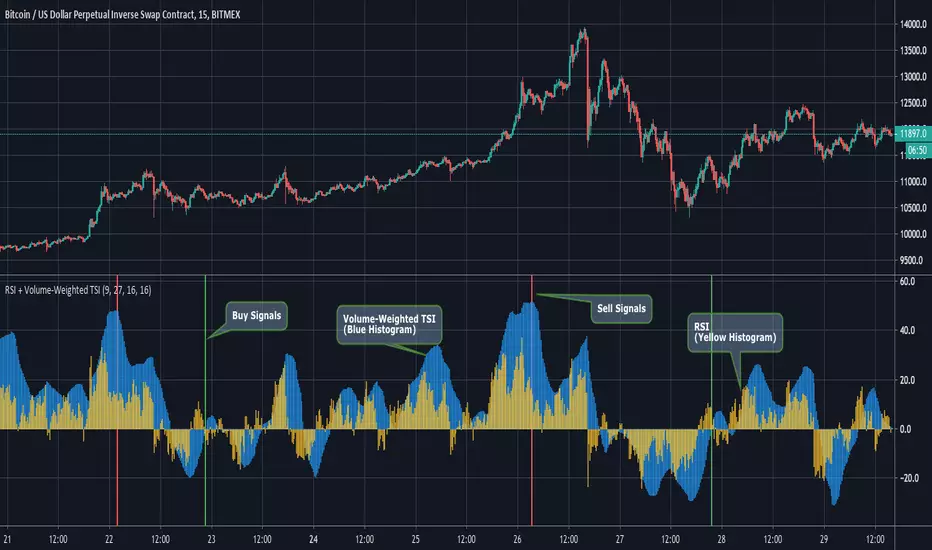
RSI + Volume-Weighted TSIThis indicator combines a standard RSI with a modified TSI.
Although a double smoothing process is already used in calculating the normal TSI, we decided to apply a volume weighted moving average of length (length_of_slow_TSI_EMA // 2) to it. This resulted in a smoother TSI that picked up on large-scale swings very nicely.
Entry Signals are generated when the Volume-Weighted TSI crosses above zero from negative into positive territory. Exit signals are generated when the TSI is above 40 and then begins its downward fall, along with a declining RSI value.
The Graph:
The Volume-Weighted TSI is plotted as the blue histogram, wile the RSI is plotted as the yellow histogram. We definitely wanted to go the simplicity route on this one's graphics, since the RSI and TSI are both classic and reliable indicators.
The green background highlights indicate an entry signal and red highlights signify an exit signal.
Input Options:
-length of Slow EMA for TSI
-length of Fast EMA for TSI
-Length of Volume Weighted MA of TSI.
-Length of RSI.
~Happy Trading~
Double KAMA + VWMAThis study combines a fast and slow Kaufman Adaptive Moving Averages (KAMA) with a fast and slow Volume-Weighted Moving Average(VWMA).
The KAMA is definitely one of our favorite moving averages because it takes into account volatility and filters out false signals during periods of insignificant or horizontal price movement. This results in more patient, less impulsive trading. At its most basic, the KAMA's value remains relatively close in value to the price when volatility is low then lags slightly behind it during highly volatile movements and larger trends.
We've plotted two Kaufman's Adaptive Moving Averages:
-The first KAMA is the slow KAMA, which we use as a trend filter. It is shown on the graph as the thicker solid line that alternates between green and red. When the trend filter KAMA is bullish, the line turns green. It then turns red when bearish. Users can adjust the lengths of the fast and slow EMA for the KAMA's calculation in the input option menu, but it is important to remember that the number of periods should remain high in comparison to the fast KAMA as this allows it to track long-term price movements and trends.
-We then include a fast KAMA which has shorter EMA Lengths to focus in on movements within a smaller timeframe.
NOTE: The fast KAMA is only plotted when the trend filter KAMA is generating bullish signals. It is shown as the alternating pink and teal line above the main green line. When the fast KAMA is increasing, its line and the area between it and the slow KAMA are filled teal. When the fast KAMA is falling, its line and the area between the fast and slow KAMA lines are colored pink. This helps with timing exits.
Lastly, we've included a fast and slow VWMA to time long entries. These are only plotted when the Trend Filter KAMA is bearish. The fast VWMA is the teal solid line under the trend filter KAMA and the slow VWMA is the pink line. Optimal entries will occur when the fast VWMA crosses above the slow VWMA. When the slow VWMA is greater than the fast VWMA, the area between the two lines is filled red, while the same area is filled teal when the fast VWMA is greater than the slow.
I've included entry signals (shown on the screenshot as the lime green background highlights), but this is the basic version of the indicator. If you're interested in taking a look at the full version with alerts and entry + exit signals, feel free to send us a message!

VWMA/SMA Breakout and Divergence DetectorThis indicator compares four different values :
-Fast Simple Moving Average(SMA)
-Fast Volume Weighted Moving Average(VWMA)
-Slow SMA
-Slow VWMA
Comparing SMA's and VWMA's of the same length is a common trading tactic. Since volume is not taken into consideration when calculating Simple Moving Averages, we can gain valuable insights from the difference between the two lines.
Since volume should be increasing along with an upwards price movement, the VWMA should be greater than the SMA during a volume-supported uptrend. Thus, we can confirm an uptrend if the VWMA remains greater than the SMA. If the VWMA falls under the SMA in the midst of an upwards price movement, however, that indicates bearish divergence. The opposite is true for downtrends. If price is decreasing and volume is decreasing at the same time (as it should), then we can confirm the downtrend.
Interpreting the Graph:
If the slow SMA is greater than the slow VWMA, then the area representing the difference between the two lines is filled in red. If the slow VWMA is greater than the slow SMA, however, the area between the two is filled green.
If the fast SMA is greater than the fast VWMA, then the area between the two dotted lines is filled in red. On the other hand, the area will be filled green if the fast VWMA is greater than the slow SMA.
In addition to spotting divergences and confirming trends, the four lines can be used to spot breakouts. Typically, a VWMA crossover will precede the SMA crossover. When the fast VWMA crosses over the slow VWMA and then a SMA crossover follows shortly after, then it is a hint that a bullish trend is beginning to form.

Flunki Multi timeframe MTF VWAPsMultiple Timeframe VWAP plots.
Seven of them.
With colour flips and plot horizontal options.
Possibly more VWAP than you need... but you have an on / off option for each.
Enjoy.
Add me on Twitter @flunkimoku or find me in the OneX discord..

[feeble] TrenderEver wondered which way the price is trending??!
feeble Trender BETA™ shows the trend based on middle crossings in different timeframes, volume weighting and volatility(std Deviations)
--The indicator displays the same on any timeframe
--Select a FROM and TO period
--Use DuPLiCaToR to make 12 copies - use values between 0.8-1.2
--Coloured bands go purple when price is below the volume-weighted mIdBaNd!

[feeble] TrenderEver wondered which way the price is trending?!
feeble Trender™ **BETA** shows the trend based on middle crossings in different timeframes, volume weighting and volatility (std Deviations)
--The indicator displays the same on any timeframe.
--Select a FROM and TO period
--Use DuPLiCaToR to make 12 copies - use values between 0.8-1.2
--Coloured bands go purple when price is below the volume-weighted mIdBaNd!
--Shows the trend on a few different scales!!

Volume Weighted MACD OscillatorThis oscillator plots volume weighted convergence/divergence from the 20, 50 and 200 tick MA's. I wanted to build another way to look at the data I saw being generated in my first script.


Fibo Guppy Multi MA RevisedThis is Guppy MA i customized for myself based on two scripts of GMMA from JustUncleL and NeoButane.
Its features are:
1. Besides standard EMA you can chose all kinds of exotic moving average types ike ALMA (my favorite), HullMA, ZeroLag EMA, VWMA, KAMA etc...
2. Two types of coloring scheme - depends on volatility try one that's best fit.
3. Multiple sets of predefined lengths: standard Guppy 3-60, Fibonacci based lengths 3-610, Fibo 5-987 and Custom (user defined lengths)

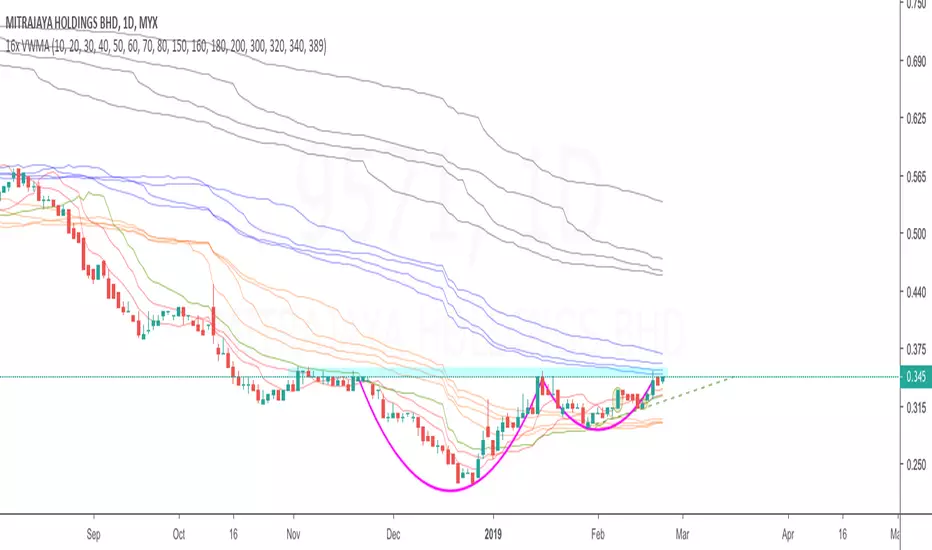
16x VWMACombination of 16 VWMAs to find out where the market makers are.
vwma 10/20/30 - red
vwma 40 - green
vwma 50/60/70/80 - orange
vwma 150/160/180/200 - blue
vwma 300/320/340/389 - black
Evma exponential smoothing weighted average weighted average V3Evma exponential smoothing weighted average weighted average V3
A byproduct of Evwma V2 development. Originally it was planned for death, but it seems to be convenient for replacing with EMA as a result of research.
So, recently, the author seems to like EVMA.
Evma 指数平滑出来高加重平均 V3
Evwma V2開発時の副産物。本来は没の予定でしたが、研究の結果EMAと差し替えるのに都合がよいようです。
というわけで、最近、作者ははEVMAを気に入っているらしい。

VWMA - SMAVWMA - SMA is very strong indication of trend direction and strength
See here for a description of this trading strategy: www.tradingsetupsreview.com
Multiple customizable MA own timeresolution own MA-typeMultiple (8) customizable MA
Features:
Set MA-Type/Smoothing: "RMA", "SMA", "EMA", "WMA", "VWMA"
Set Timeframe/Resolution: "60", "240", "1D", "1W", "1M", "Chart"
To use the native chart time resolution select "Chart" as TimeFrame

ATR+VWAP Alert//These signals mostly consist of crossovers between a 13 VWMA and a 62 VWMA. I've found these two moving averages to be quite special in their ability to
//recognize a quick trend using volume data. The VWAP is used in the alert system as well, to give some perspective on which direction we are looking to take. We
//are also using ATR. We only take trades when the ATR is on the move, meaning we have a chance to catch a volatile move! Finally, we use RSI to help weed out bad
//trades. We only take 'longs' with bullish readings from RSI, and we only take 'shorts' with bearish readings from RSI. These alerts are fantastic for catching quick intraday
//trades in either direction. I recommend using a small 'take profit' target rather than using an exit indicator. These trades can move 20-30 pips and reverse just as quickly. Good luck!
//How To Use:
//When the alert system is added to the chart, you will notice up/down symbols appear at various locations. For bullish alerts, right click an 'Up' symbol and choose 'Add Alert on VWap & ATR..'
//There are two condition options. 'Long/short', and right below that 'Buy-Signal/Sell-Signal'. Choose 'long' and 'Buy-Signal'. At options, choose 'Once Per Bar Close'. Design your alert, and you're good to go.
//For bearish signals, find a 'down' signal on the chart. Right click and follow the same process, except choosing 'short/Sell-Signal' conditions.
Tips:
Use VWAP as a stop-loss. If a candle closes below/above the VWAP in the direction against you.. get out of the trade. The losses will be minimal and few compared to the wins. Use discretion and trade carefully. This works great with crypto. Invent your own exit. If you come up with a clever exit, please share!
You can contact me at my Discord!
discord.gg

CS Basic Script: Customizable Volume Based Trading (Strategy)Customizable Volume Based Strategy Script that includes the Following Inputs:
- Custom Backtesting Date Range
- Optional Trailing Stop Loss
- Select the Volume Strategy Types (Crossing EMA, SMA, WMA, & Lookback)
- Adjust the MA Volume Range
- Automate with the Autoview Trading Bot
Strategy script may be tested by favoriting and adding to any chart.
Study script is available for automated trading at www.cryptoscores.org

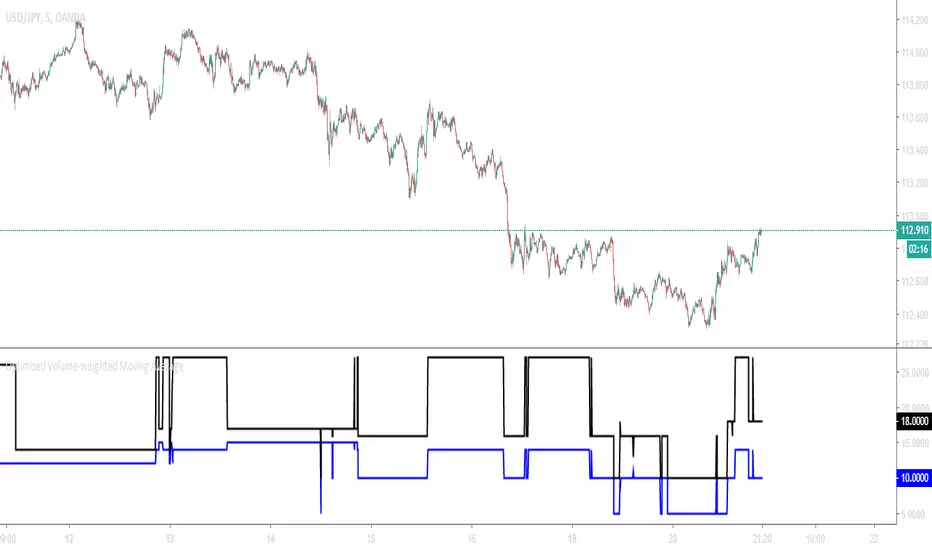
Optimised Volume-weighted Moving AverageAbout
This tool measures the profitability of every volume-weighted moving average length combination for the entire history of the instrument that it is applied,
and only displays the most profitable combination in real-time which means that this indicator is fully functional for trading.
The Optimised Volume-weighted Moving Average can be tested using a Volume-weighted Moving Average Strategy and the Strategy Tester panel on any instrument or time-stamp. It will always display the lengths of the most profitable exponential moving average lengths at the current moment in time.
This can be used on its own, or paired with the Intelligent Volume-weighted Moving Average (AI) for a better understanding of the indicators movements.
The Intelligent Volume-weighted Moving Average (AI) uses this tool as a predictive method for machine learning.
Intelligent Volume-weighted Moving Average (AI)Introduction
This indicator uses machine learning (Artificial Intelligence) to solve a real human problem.
The volume-weighted moving average (VWMA) is one of the most used indicators on the planet, yet no one really knows what pair of volume-weighted moving average lengths works best in combination with each other. A reason for this is because no two VWMA lengths are always going to be the best on every instrument, time-frame, and at any given point in time.
The "Intelligent Volume-weighted Moving Average" solves the moving average problem by adapting the period length to match the most profitable combination of volume-weighted moving averages in real time.
How does the Intelligent Volume-weighted Moving Average work?
The artificial intelligence that operates these moving average lengths was created by an algorithm that tests every single combination across the entire chart history of an instrument for maximum profitability in real-time.
No matter what happens, the combination of these volume-weighted moving averages will be the most profitable.
Can we learn from the Intelligent Volume-weighted Moving Average?
There are many lessons to be learned from the Intelligent VWMA. Most will come with time as it is still a new concept. Adopting the usefulness of this AI will change how we perceive moving averages to work.
Limitations
This indicator does not change what has already been plotted and does not repaint in any way shape or form which means it is excellent for trading in real-time!
Ultimately, there are no limiting factors within the range of combinations that has been programmed. The volume-weighted moving averages will operate normally, but may change lengths in unexpected ways - maybe it knows something we don't?
Thresholds
The range of VWMA lengths is between 5 to 40.
The black crosses can be turned off in the settings panel.
Test this indicator!
I am also publishing tools that can be used to back-test this indicator and understand what period length is currently being used.
There will be many more updates to come so stay tuned!
Updated documentation and access to this indicator can be found at www.kenzing.com

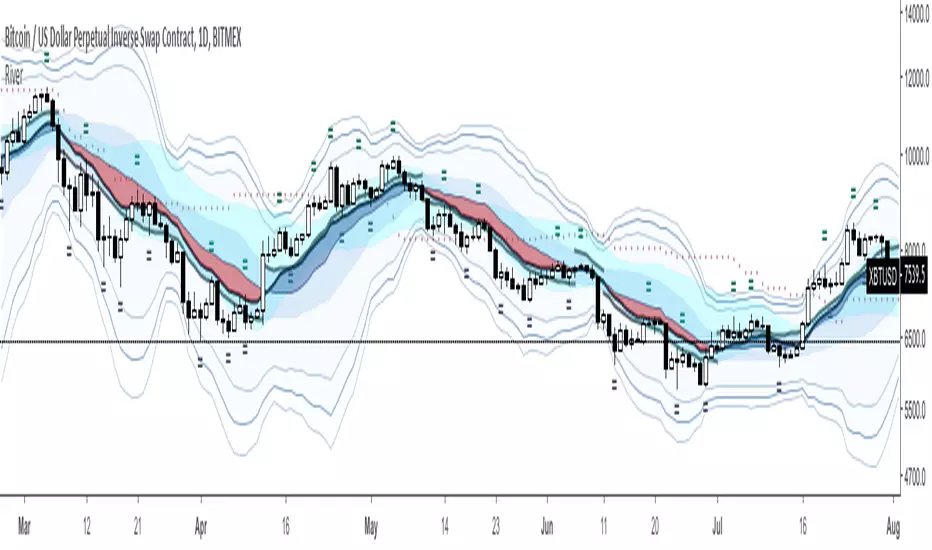
River Scalping (Fibonacci, Pivots, VWMA, BB, EMA)Pictured as a Scalping Indicator, it shines best on the H4 and specially on the D1.
A combination of too many Fibonacci progressions, Pivots, VWMA , EMA's, BB, Stochastic RSI, the Kijun (Doubled Ichimoku Cloud ), William's Fractals ('=') and too many Standard Deviations.
Simple Strategy :
Center Blue: Long
Center Red: Short
The river can unveil the market's momentum and its strength.
Don't only use the simple strategy, there is much more if you decide to fall down the rabbit hole.
Suggestions are, as always, more than welcomed,
Have fun out there and stay safe.
Please be advised, this indicator will only be free for a limited time.