Carta sesi profil volum dijelaskan
Di Carta Super , anda boleh mengakses carta session volume profile. Ia boleh menunjukkan anda pasaran daripada perspektif berbeza. Dengan memvisualkan setiap sesi dagangan sebagai profil volum menegak, ia akan memudahkan anda untuk melihat di mana kawasan aktiviti dagangan yang tertinggi. Carta-carta ini menyerlahkan cara volum diagihkan merentasi tingkatan harga berbeza pada sesi tertentu.
KANDUNGAN:
Apakah carta SVP
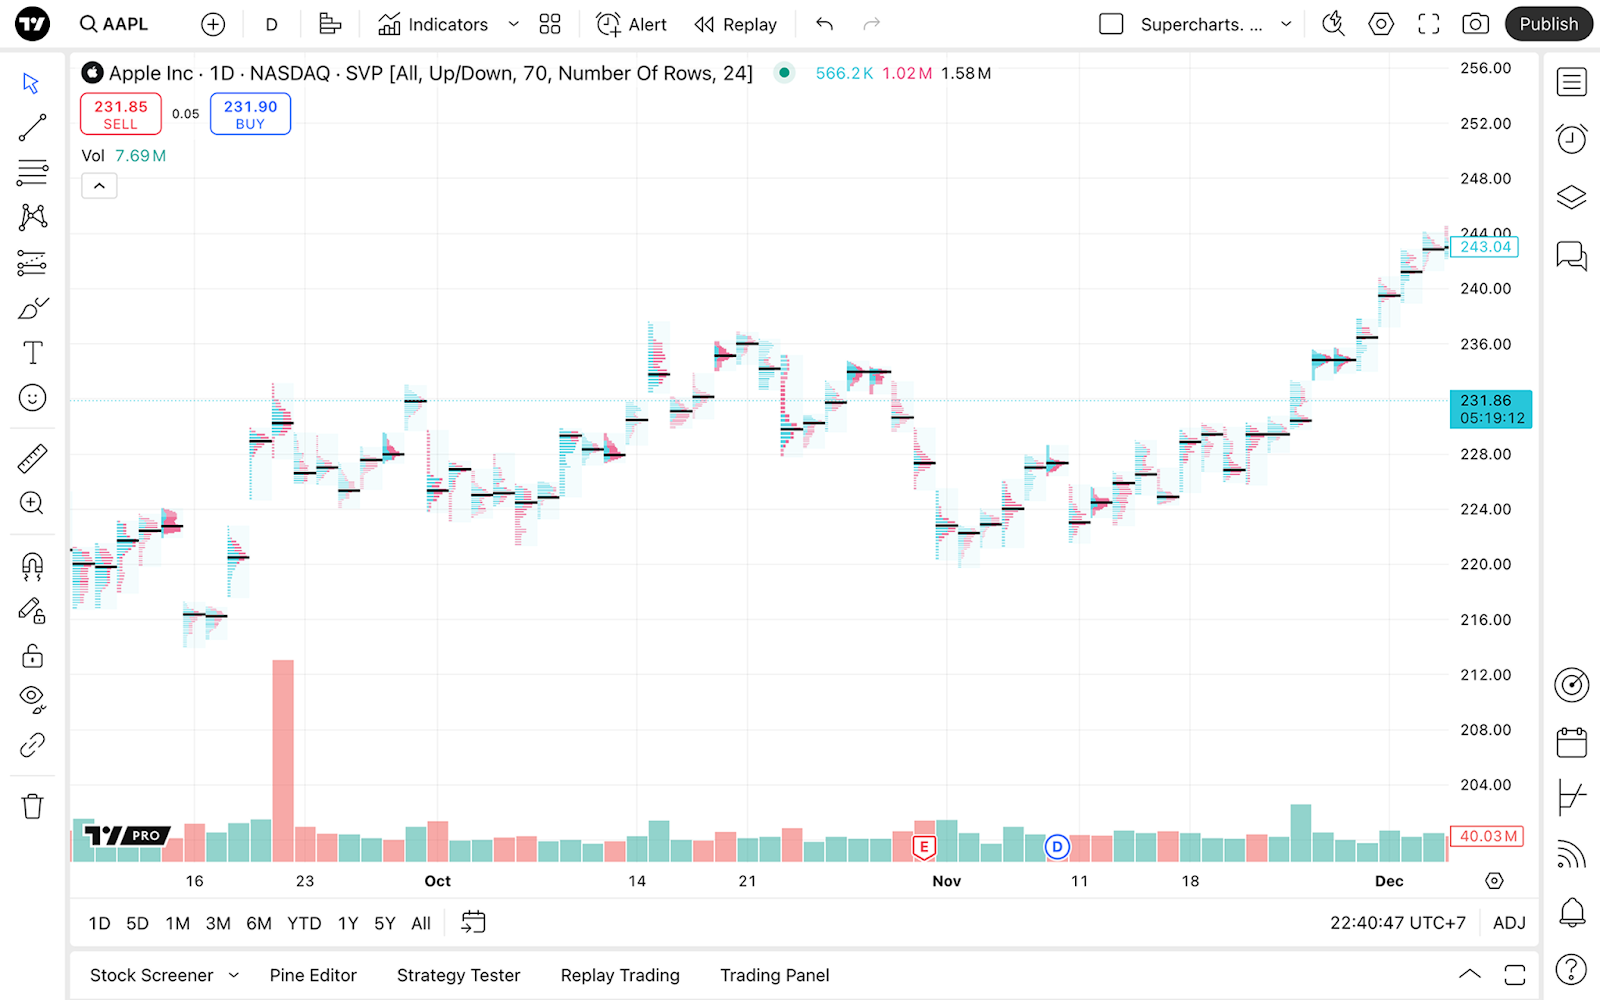
Carta session volume profile (SVP) menunjukkan volum histogram untuk sesi tertentu, sub sesi atau selang masa ditetapkan dalam tetapan. Ia mengira data volum, membenarkan pedagang menganalisa aktiviti volum intrahari untuk satu bahagian tertentu dalam sesi.
Mengapa carta SVP
Tidak seperti lilin atau bar tradisional, jenis carta Session volume profile menunjukkan pasaran dari perspektif berbeza: ia memvisualkan setiap sesi dagangan sebagai profil volum menegak, yang menjadikannya mudah untuk melihat di mana kawasan aktiviti dagangan yang tertinggi. Dengan cara ini, carta menyerlahkan bagaimana volum ditaburkan merentasi tingkatan harga berbeza semasa sesi tertentu.
Ramai pedagang memilih jenis carta ini kerana ia boleh memudahkan analisis dengan membuang sisa-sisa visual. Daripada menggunakan berbilang penunjuk pada lilin, anda boleh memfokuskan di mana pasaran menjadi seimbang dan tidak seimbang. Ia sangat berguna kepada pedagang yang menggunakan strategi dipacukan volum, kerana ia membenarkan mereka menjejak bagaimana nilai berubah dari masa ke semasa dan bagaimana sentimen pasaran berubah dari sesi ke sesi.
Selain daripada idea biasa, jenis carta SVP boleh memberikan cadangan pada dinamik volum mengikut bentuknya. Sebagai contoh, profil berbentuk D boleh mencadangkan sesi yang seimbang, manakala bentuk P atau B mungkin menunjukkan pembangunan trend.
Mengaktifkan jenis carta
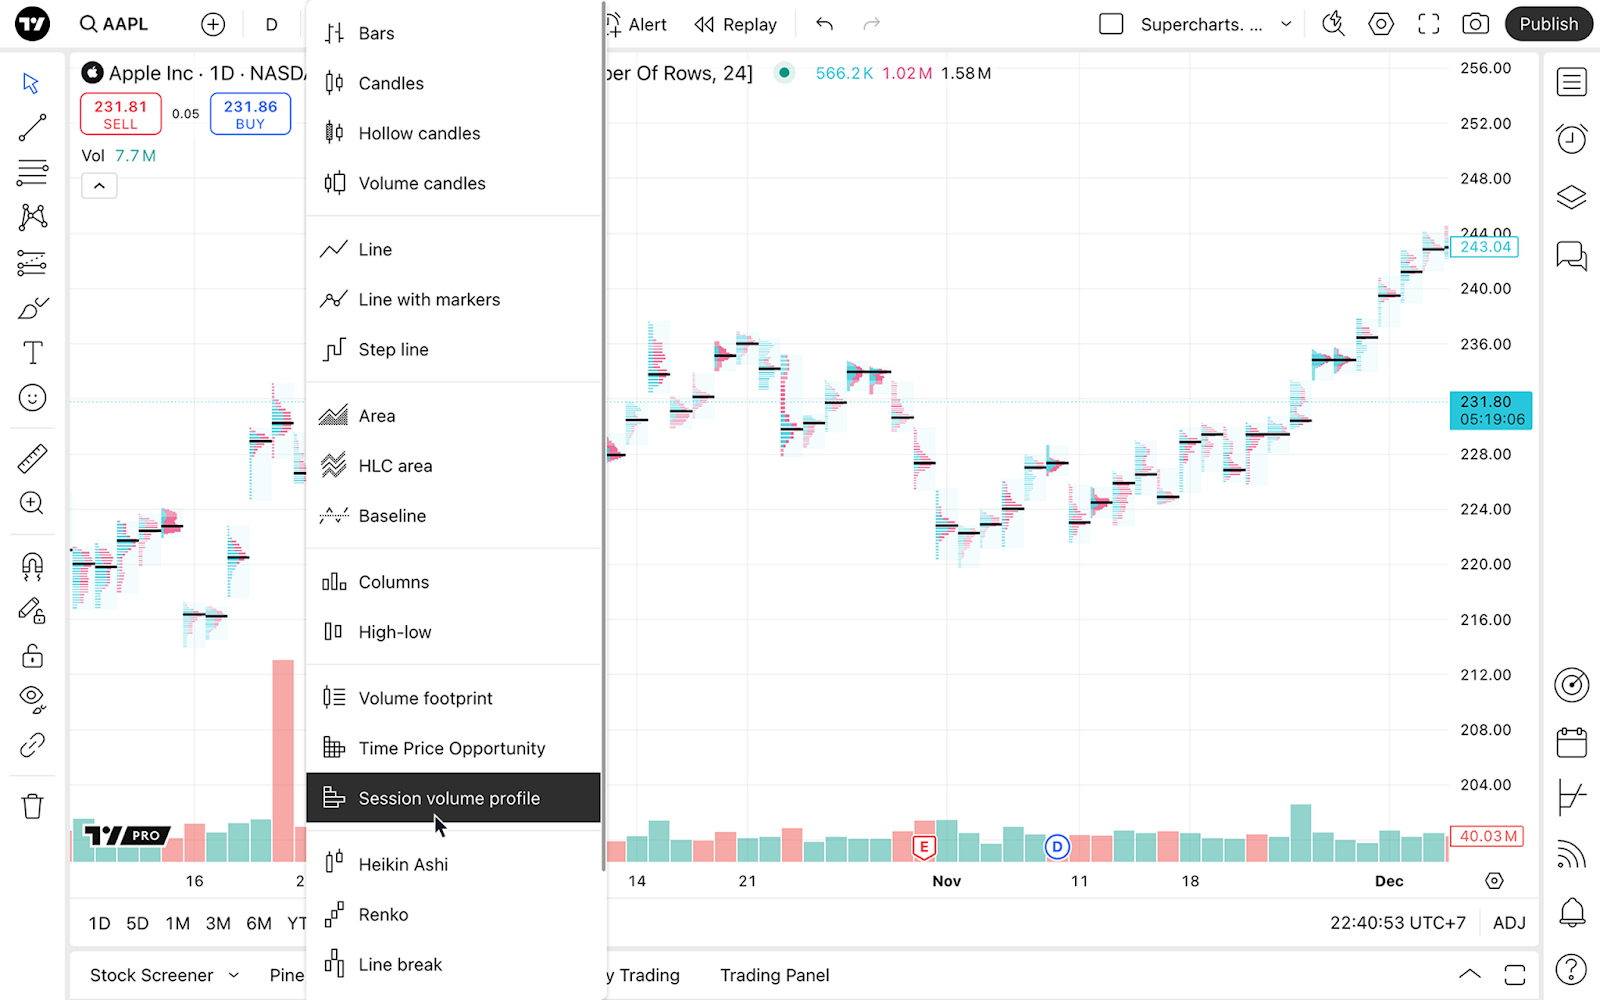
Apabila anda berada pada Carta Super, buka menu jenis carta pada bar alat atas dan pilih Sesi profil volum.
Tetapan
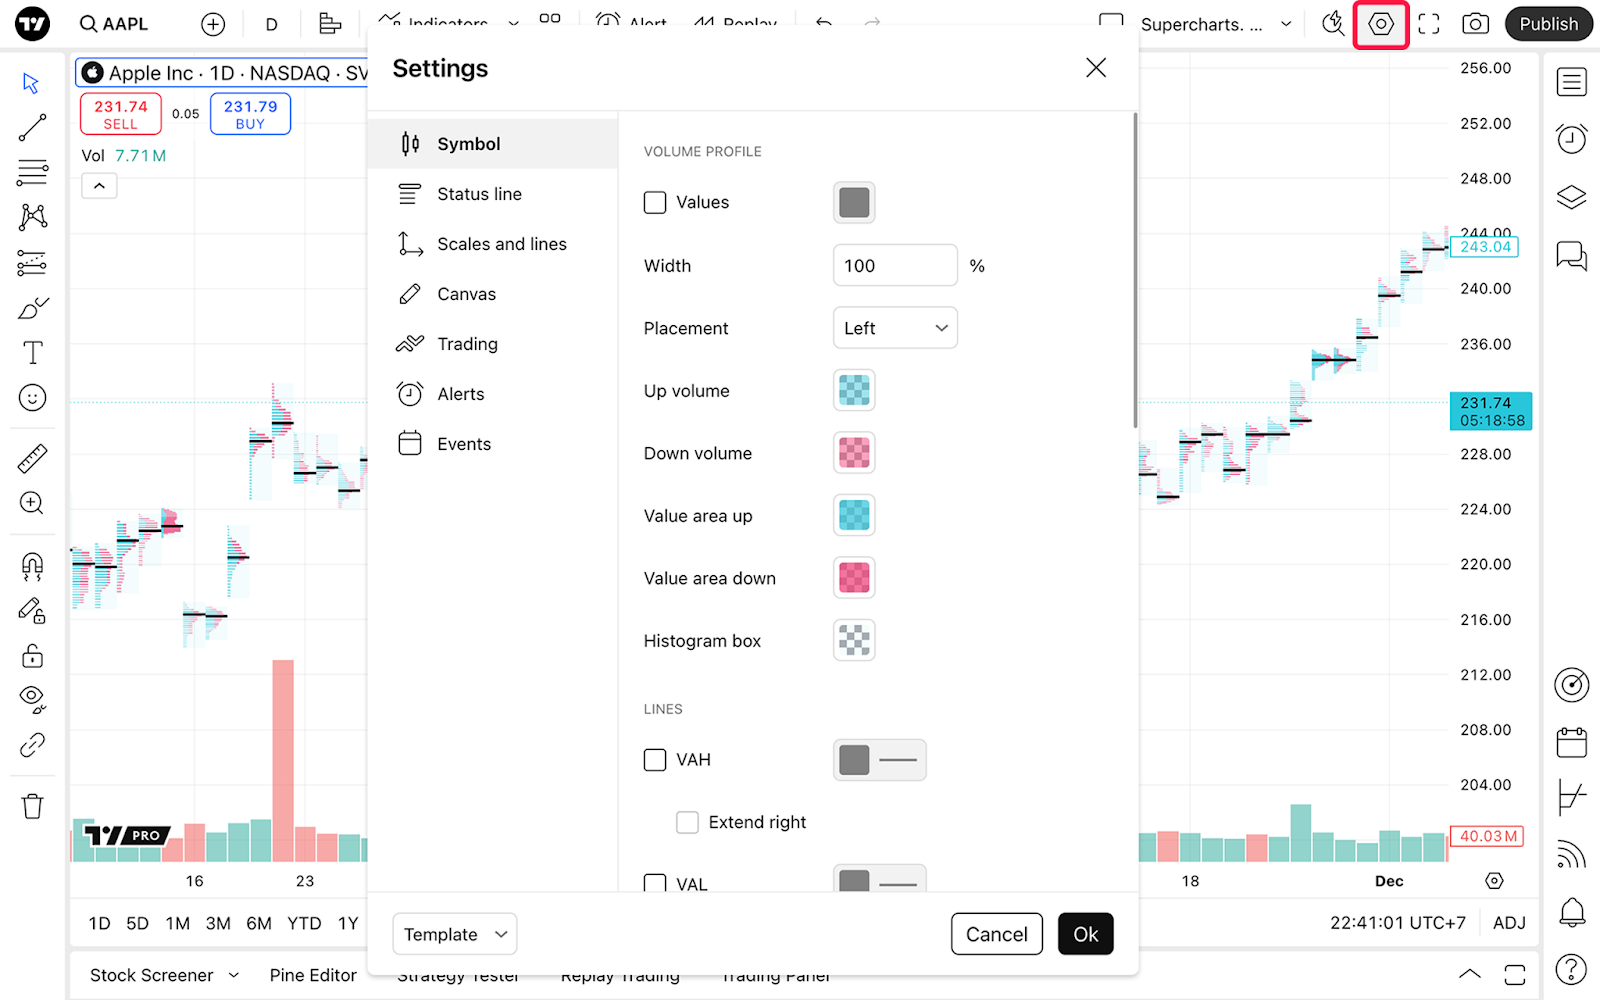
Untuk melaraskan carta session volume profile anda, pilih "Tetapan" pada bar alat atas dan pergi ke tab "Simbol".
Profil Volum
Dalam bahagian "Profil volum", anda boleh mengaktifkan paparan nilai pada lajur histogram, melaraskan lebar lajur dan warna histogram.
- Nilai: Togol kebolehlihatan dan tetapkan warna untuk nilai yang terpapar pada bahagian kiri carta
- Lebar: Menukar lebar lajur dalam histogram
- Penempatan: Ubah bar ke kiri atau kanan untuk kawasan sesi dagangan
- Volum naik: Menentukan warna dan juga kelegapan untuk Volum Naik (Beli)
- Volum turun: Menentukan warna dan juga kelegapan untuk Volum Turun (Jual)
- Kawasan nilai atas: Menentukan warna dan juga kelegapan untuk Kawasan Nilai Atas
- Kawasan nilai bawah: Menentukan warna dan juga kelegapan untuk Kawasan Nilai Bawah
- Kotak histogram: Menentukan warna latar belakang dan juga kelegapan untuk kawasan Profil Volum
Garis
Dalam bahagian "Garisan", anda boleh mengaktifkan garisan seperti POC (Point of Control), VAH (Value Area High), VAL (Value Area Low), POC sedang berkembang dan VA sedang berkembang.
- VAH: Togol kebolehlihatan
- Panjangkan VAH ke kanan: Panjangkan garis sehingga ia merentasi mana-mana bar
- VAL: Togol kebolehlihatan
- Panjangkan VAL ke kanan: Panjangkan garis sehingga ia merentasi mana-mana bar
- POC: Togol kebolehlihatan
- Panjangkan POC ke kanan: Panjangkan garis sehingga ia merentasi mana-mana bar
- POC sedang berkembang: Togol kebolehlihatan, menunjukkan kepada anda bagaimana POC sedang berubah apabila pasaran sedang berjalan
- VA sedang berkembang: Togol kebolehlihatan, menunjukkan kepada anda bagaimana VA sedang berubah apabila pasaran sedang berjalan
Input
Anda boleh menetapkan satu sesi dalam bahagian Input di mana volum, peletakan garis dan saiz tingkatan akan dipaparkan.
- Sesi: Menentukan bagaimana carta session volume profile dibina
- Semua: Penunjuk akan mengambil kira pra pasaran, sesi dagangan utama dan pasca pasaran sebagai satu sesi. Satu profil akan dibina untuk setiap hari dagangan dan ia akan mengandungi volum untuk semua transaksi, bermula dari lilin pra pasaran pertama dan berakhir dengan lilin pasca pasaran terakhir
- Setiap satu: Membina profil volum berasingan untuk setiap bahagian sesi hari dagangan, mengambil kira hanya transaksi yang dilakukan pada tempoh masa itu. Jika simbol mempunyai jam lanjutan dengan pra pasaran, pasaran utama dan pasca pasaran, carta akan membina tiga profil berasingan untuk setiap hari dagangan
- Pra pasaran sahaja, pasaran sahaja, pasca pasaran sahaja: Dengan pilihan ini, carta akan hanya membina satu profil volum untuk setiap hari dagangan, berdasarkan kepada dagangan untuk tempoh masa sesi yang ditentukan
- Tersuai: Mengkonfigurasikan permulaan dan pengakhiran tempoh masa yang mana profil akan dibina. Anda juga boleh memilih zon masa
- Volum: Togol antara menunjukkan jumlah volum untuk setiap baris (jumlah), membahagikan setiap baris kepada atas/bawah atau menunjukkan perbezaan mereka (delta)
- Volum kawasan nilai: Menentukan peratusan semua volum untuk sesi dagangan yang sepatutnya diserlahkan oleh kawasan nilai
- Susun atur baris / saiz Baris: Menentukan cara carta mengira jumlah baris untuk setiap histogram
Anda boleh mengetahui lebih lanjut bagaimana nilai dikira dalam artikel kami untuk penunjuk Session Volume Profile.
Rumusan SVP
Session volume profile memaparkan histogram volum untuk sesi dagangan khusus, menunjukkan di mana aktiviti dagangan paling banyak terjadi pada tingkatan harga berbeza. Carta menunjukkan di mana harga menarik paling banyak minat belian dan jualan sepanjang sesi menggunakan bar mendatar.
SVP menyerlahkan tingkatan kritikal seperti point of control (POC) — harga volum tertinggi — dan sempadan kawasan nilai tinggi/rendah (VAH/VAL). Anda boleh menganalisa keseluruhan hari dagangan atau sesi berasingan (pra pasaran, pasaran, pasca pasaran) untuk mengenal pasti zon sokongan/rintangan dan kawasan diterima pasaran (market acceptance area) berdasarkan kepada pengagihan volum sebenar.
Juga baca: