PROTECTED SOURCE SCRIPT
VLB Dynamic Market Structure Tool
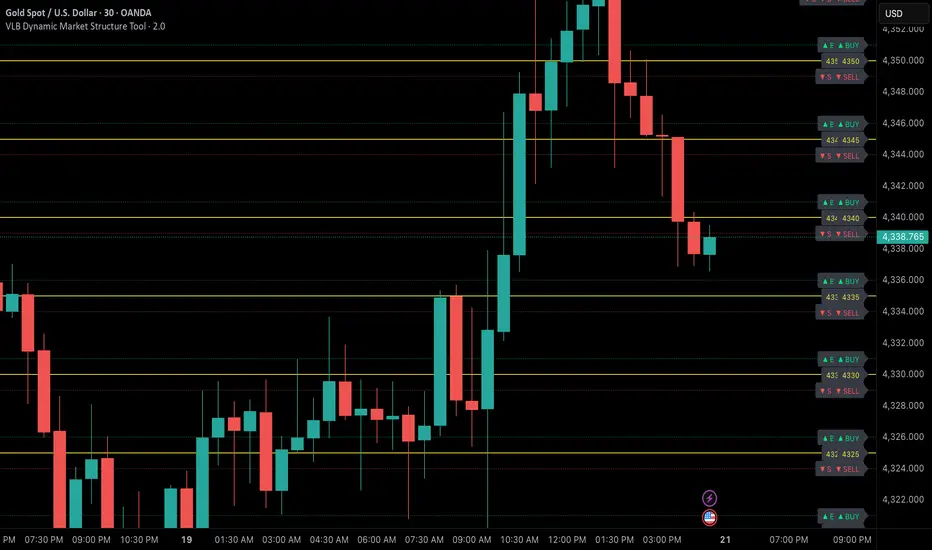
Adaptive Structural Continuation Framework for XAUUSD
The VLB Dynamic Market Structure Tool is a proprietary, rules-driven market structure framework designed specifically to analyze price continuation behavior in XAUUSD under live market conditions.
This tool does not plot static support and resistance.
Instead, it provides a continuously adapting structural model that reorganizes itself around current price, allowing traders to observe acceptance, rejection, and expansion behavior between key structural zones.
Core Conceptual Foundation
The framework is built on three integrated components that work together as a single methodology:
1. Dynamic Price-Anchored Structural Range
Unlike traditional indicators that rely on fixed historical levels, this tool anchors its entire structural range to live market price.
As price migrates:
Levels that are no longer relevant are automatically removed
New forward-relevant levels are introduced
The framework re-centers itself around active price action
This ensures that the trader is always viewing current, actionable structure, without manual redrawing or chart repositioning.
2. Evenly Spaced Structural Reference Levels
Within the dynamically anchored range, price is organized into consistent structural intervals that frequently act as transition points in XAUUSD price behavior.
These levels serve as objective reference boundaries, allowing traders to:
Compare reactions across identical structural distances
Observe recurring price behavior in a normalized framework
Maintain consistency across different sessions and market conditions
The levels are contextual, not predictive.
3. Post-Break Acceptance & Expansion Zones
The framework distinguishes between:
Initial structural breaks that fail or retrace
Confirmed acceptance beyond a defined offset from the level
Expansion phases as price transitions toward the next structural interval
By visualizing this sequence, the tool allows traders to study continuation behavior only after confirmation, rather than reacting to first-touch or initial breakouts.
Adaptive Behavior (Why This Is Not Static S&R)
A defining feature of the VLB Dynamic Levels Tool is its continuous recalculation and real-time adaptation:
The visible structure evolves with price
The framework moves up or down as market conditions change
Historical clutter is intentionally removed to preserve clarity
The trader’s focus remains on the active trading environment
This adaptive behavior is integral to the methodology and cannot be replicated through manual drawing or static indicators.
Intended Use
This tool is designed for discretionary traders who:
Study market structure, acceptance, and momentum
Prefer confirmation-based continuation frameworks
Value rule-based consistency over subjective interpretation
Combine structural context with their own execution, fundamentals, and risk management
The indicator does not generate automated buy or sell signals and does not execute trades.
Important Disclosures
No performance or outcome is guaranteed
No predictive claims are made
All trading decisions remain the responsibility of the user
Summary
The VLB Dynamic Levels Tool provides a self-adjusting, structurally consistent framework for observing how XAUUSD price transitions between key zones in real time.
Its proprietary value lies in the integration of dynamic price anchoring, structural normalization, and post-break acceptance visualization, offering a methodical way to study continuation behavior in changing market conditions.
Skrip dilindungi
Skrip ini diterbitkan sebagai sumber tertutup. Akan tetapi, anda boleh menggunakannya secara bebas dan tanpa apa-apa had – ketahui lebih di sini.
Created by VLB Systems.
Penafian
Maklumat dan penerbitan adalah tidak bertujuan, dan tidak membentuk, nasihat atau cadangan kewangan, pelaburan, dagangan atau jenis lain yang diberikan atau disahkan oleh TradingView. Baca lebih dalam Terma Penggunaan.