OPEN-SOURCE SCRIPT
Telah dikemas kini Envelope Momentum Cloud
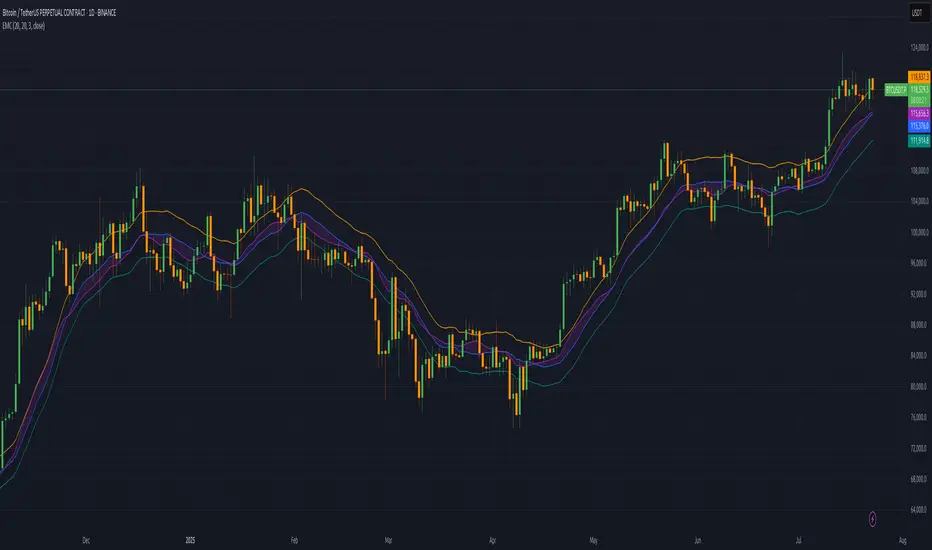
Envelope Momentum Cloud (EMC) is a momentum visualization tool using moving averages and fixed-percentage envelopes. It compares an EMA (fast) to an SMA (slow), with static envelopes around the SMA to create momentum thresholds.
SMA anchors the trend baseline.
EMA highlights momentum shifts relative to the SMA.
Envelopes are placed at a user-defined % above and below the SMA.
Momentum Cloud visually fills the gap between EMA and SMA to show directional pressure.
Crosses beyond the envelope boundaries can indicate overextended moves or possible trend shifts.
Nota Keluaran
Envelope Momentum Cloud (EMC) is a trading indicator designed to help visualize momentum using averages. This script compares two main types of averages: the Simple Moving Average (SMA) and the Exponential Moving Average (EMA). Here's a breakdown of each component and its function:Simple Moving Average (SMA): The SMA calculates the average closing price over a defined number of days. It serves as the baseline for the envelopes and helps in establishing the context for comparing the EMA.
Exponential Moving Average (EMA): The EMA prioritizes more recent prices by applying greater weight to them. This responsiveness makes it an excellent tool for tracking price momentum. In this indicator, the EMA’s relationship with the SMA indicates potential momentum shifts.
Envelopes (Upper and Lower Bounds): The upper and lower envelopes are set around the SMA by a user-defined percentage. These envelopes create a threshold for assessing the EMA’s momentum. If the EMA crosses one of these thresholds it suggests a potential momentum shift.
Momentum Cloud: The area between the EMA and SMA is shaded to represent the 'Momentum Cloud.' If the EMA is above the SMA, or on of it's derivatives it may indicate upward momentum and vice versa depending on the context of the situation.
Skrip sumber terbuka
Dalam semangat sebenar TradingView, pencipta skrip ini telah menjadikannya sumber terbuka supaya pedagang dapat menilai dan mengesahkan kefungsiannya. Terima kasih kepada penulis! Walaupun anda boleh menggunakannya secara percuma, ingat bahawa menerbitkan semula kod ini adalah tertakluk kepada Peraturan Dalaman kami.
Penafian
Maklumat dan penerbitan adalah tidak dimaksudkan untuk menjadi, dan tidak membentuk, nasihat untuk kewangan, pelaburan, perdagangan dan jenis-jenis lain atau cadangan yang dibekalkan atau disahkan oleh TradingView. Baca dengan lebih lanjut di Terma Penggunaan.