Open Close Profit - [Alerts]This script comes with the following indicators and features:
Moving Average trend filter (Hull, ZLEMA, McGinley)
Pin Bar Filter
MACD indicator
Pump and Dump filter
Entry, Take Profit, and Stop Loss Alerts
And a few more indicators in the back-end to increase accuracy, optimize entries and filter out sideways PA
This script works really well as a scalper on lower Time Frames as well as on higher Time Frames. Besides that you can also use it on pretty much any coin or asset.
This script is not repainting. We advise to use alerts on “Once Per Bar Close”.
If you’d like to automate this script you can do that by using AutoView, ProfitView, ProfitTrailer, CryptoHopper etc.
Leave a message if you’d like to try it out.
1-BTCUSD

Bitcoin Stock To Flow Rainbow IndicatorHello everyone,
I have finished to create the Bitcoin stock to flow indicator, rainbow version.
It's a Bitcoin price prediction model.
What is Stock To Flow ?
Stock is the size of the existing stockpiles or reserves and flow is the yearly production.
The formula is : Stock divided by flow ( Stock_to_flow = STOCK / FLOW )
The supply of bitcoins is fixed in the source code.
What we know :
Blocks are created every 10 minutes ( average )
In 2009, 50 Bitcoins was created every 10 minutes , so 300 Bitcoins per hour, 7200 per day, 2628000 per year
The Halving happened each 210000 blocks , the average time between halving is around 1300-1400 days.
The mathematical formula that I used for the rainbow line is : exp(-1,84) * (Stock_to_flow ^ 3,36)
And the mathematical formula that I used for the " top price line " is : 1.2 * (Stock_to_flow ^ 3)
The rainbow line IS the prediction model .
We can observe that :
The price follow the rainbow line
After each halving, the price grow and touch few month after the rainbow line
When the price is between the rainbow line and the " top price line ", habitually, it's followed by a drop of the price below the rainbow line.
Special thanks to PlanB.

PpSIgnal Double Murrey's Math StrategyMurrey Math es un conjunto complejo de niveles de soporte y resistencia que actúan más o menos de la misma manera que los puntos de pivote, pero también proporcionan algunas ideas sobre si la tendencia actual debe continuar o revertirse. El concepto matemático de Murrey fue desarrollado por T. Henning Murrey en 1995 y se describió con gran detalle en su libro "El sistema de comercio matemático de Murrey para todos los mercados negociados".
compre cuando ambos sociladores este verdes y venda cuando ambos esten en rojo
Murrey Math is a complex set of support and resistance levels that act more or less the same as pivot points but also they provide some insights on whether the current trend should continue or it should reverse. The Murrey math concept has been developed by T. Henning Murrey in 1995 and has been described in great detail in his book “The Murrey Math Trading System For All Traded Markets.”
buy when both murray oscillators are green and sell when they are red

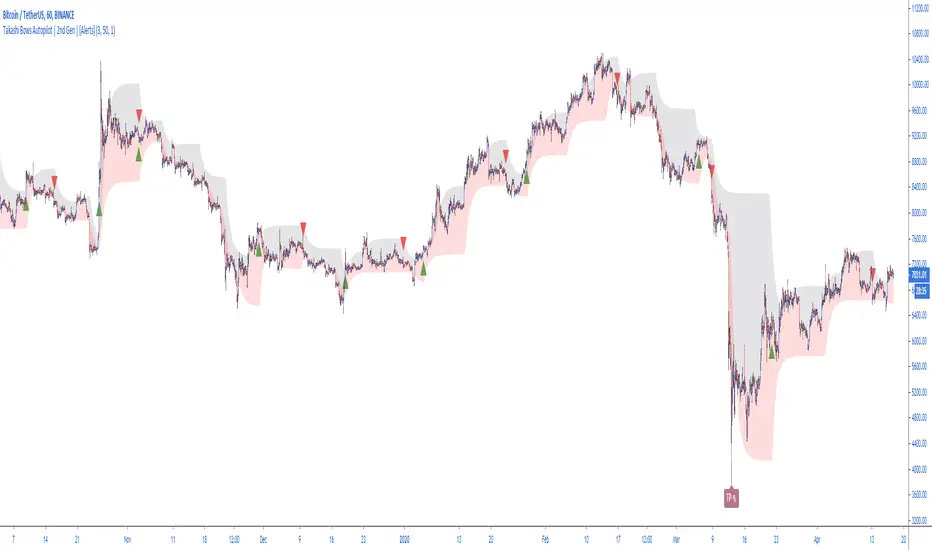
Takashi Bows Autopilot | 2nd Gen | [Strategy]This is a strategy tester for Takashi Bows Autopilot indicator. Please check for more details and instructions at our website.
Takashi Bows Autopilot is the ultimate trading tool. Effortless, its signals put traders inside strong trends, locking big profits that cover all loss generated during sideways trends.
An upgrade version of Takashi Bows v1, this script is the result of some operations developed by us, it can easily adapt to different markets and time frames. Now ranging from level 1 to 20, traders can select the amount of signals to be displayed on the chart. Based on price movement, it signals entries after strong movement up or down.
Take Profit included. If a position is opened in one direction, it should be closed at take profit levels or when a position in the opposite direction is opened.
Inputs
Level
Integer input. Sets a level for signals generated up and down. The higher the level, more signals on chart, and vice-versa.
Take Profit %
Float input. Sets a percent of take profit for exiting previous open position.
Rule
Float input. Sets a ruler for more accuracy on less volatile markets. Standard value 1 for high volatile markets, higher values for low volatile markets.
Disclaimer:
Back-tests do not guarantee performance on the future. Even if a trading setup is profitable in historical data. it could be unprofitable in the future.
To get access to this and other scripts check links below.

Takashi Bows Autopilot | 2nd Gen | [Alerts]Our state-of-the-art trend confirmation indicator is now combined with automatic threshold selection.
Takashi Bows Autopilot is the ultimate trading tool. Effortless, its signals put traders inside strong trends, locking big profits that cover all loss generated during sideways trends.
An upgrade version of Takashi Bows v1, this script is the result of some operations developed by us, it can easily adapt to different markets and time frames. Now ranging from level 1 to 20, traders can select the amount of signals to be displayed on the chart. Based on price movement, it signals entries after strong movement up or down.
Take Profit included. If a position is opened in one direction, it should be closed at take profit levels or when a position in the opposite direction is opened.
Inputs
Level
Integer input. Sets a level for signals generated up and down. The higher the level, more signals on chart, and vice-versa.
Take Profit %
Float input. Sets a percent of take profit for exiting previous open position.
Rule
Float input. Sets a ruler for more accuracy on less volatile markets. Standard value 1 for high volatile markets, higher values for low volatile markets.
See Bows
Bool input. If true, Bows lines can be seen on chart.
To get access to this and other scripts check links below.
Takashi Trend | 2nd Gen |Discover trends instantly thanks to our new indicator.
A popular trading expression says: "the trend is your friend until it ends." This indicator makes it easier for any trader to see the market's major trend and trade accordingly.
Calculations are based on Average True Range.
This indicator does not provide signals or alerts. It is best used as a confirmation tool.
To get access to this and other scripts check links below.

Swingtrade strategy for volatile assets on the hourly chartThe strategy of this script is based on a setup that I used in 2016 for swingtrade on PETR4 and other IBOV actions. The intention of this script was to carry out a study to validate the effectiveness of the strategy precisely.
- This strategy works only to operate bought on the 1h (one hour) chart;
- The strategy is based on the strength of the market, which is measured according to moving averages;
- The setup uses targets of 3% above the input signal price and 11.5% stoploss for all operations;
- The stoploss is bigger than the target, this causes the hit rate to be high, but when there is a loss, the damage can be large;
- The setup performed well in some shares of the Brazilian stock market and cryptocurrencies of the dollar pair;

Gekko DEMA StrategyThis script is based upon the Gekko trading strategy.
This strategy uses Exponential Moving Average crossovers to determine the current trend the market is in. Using this information it will suggest to ride the trend. Note that this is not MACD because it just checks whether the longEMA and shortEMA are % removed from each other.
* short is the short EMA that moves closer to the real market (including noise)
* long is the long EMA that lags behind the market more but is also more resistant to noise.
* the down threshold and the up threshold tell Gekko how big the difference in the lines needs to be for it to be considered a trend. If you set these to 0 each line cross would trigger new advice.
The base strategy has had money management logic added and has been tested for best results. Once you have access, you can modify these settings to find what works best for you.
Access to this strategy is FREE! Message me for more information on how to get access.

Crypto Tipster Pro+ (Optimized for BTCUSD)===========
Crypto Tipster Pro+ Optimized for BTCUSD
===========
This script is a carbon-copy of our Crypto Tipster Pro Strategy , but also includes our Custom & Fully Optimized Settings for turbo-charging your Bitcoin (BTCUSD) trading over the last 12 months.
-----------
We keep all our Crypto Tipster Pro+ (Optimized) strategies regularly updated and maintained. The purpose of these Add-On's to our Crypto Tipster Pro Strategy is to keep each trading plan relevant, up-to-date and most of all profitable within ever-changing markets.
We will always keep our main Crypto Tipster Strategy active, as the default settings are the best "all-rounder" set-up and work with many crypto pairs over many different time frames. This Set-Up for Bitcoin enables you to hone in on one certain trading pair on the D chart and maximize your overall net profit.
-----------
Visit the link below for Full & Immediate Access!
Good Luck and Happy Trading!

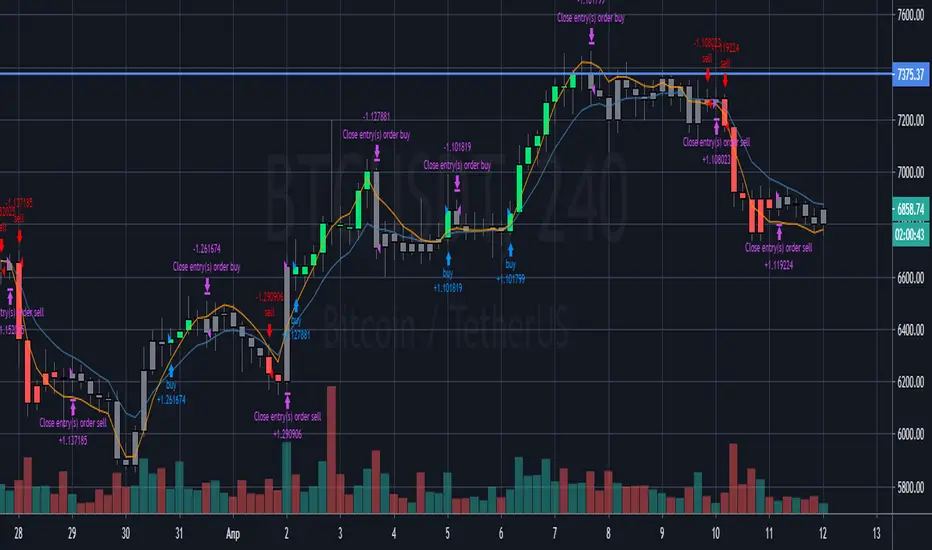
GoldMode On (Triple compromise strategy) TF 60-240BINANCE:BTCUSDT
Greetings.
I am publishing this script in order to get feedback for further work on it.
The script combines a compromise between several classic strategies, and each of them uses modifications of classic indicators on specially selected averaging sliding indicators.
1. The script uses an ATR-based filter (it's off by default, as it's better on BTCUSD , but you can enable it in the settings if you want to use it on EURUSD , for example, or on other symbols).
2. A strategy based on crossing the moving.
3. A strategy based on determining the direction of movement of the modified slow and fast RSI .
4. A strategy based on the modified ADX +DI -DI .
The essence of the strategy in finding a compromise decision on the signals coming from each of these three strategies.
=====
Приветствую.
Данный скрипт публикую с целью получить обратную связь для дальнейшей работы над ним.
Скрипт сочетает в себе компромисс между несколькими классическими стратегиями, причём каждая из них использует модификации классических индикаторов на специальным образом подобранные усредняющие скользящие.
1. В скрипте используется фильтр на основе ATR (по умолчанию выключен, т.к. на BTCUSD так лучше, но можно включить в настройках, если хотите использовать его на EURUSD , например, или на других инструментах).
2. Стратегия основанная на пересечении скользящих.
3. Стратегия основанная на определении направления движения модифицированных медленной и быстрой RSI .
4. Стратегия основанная на модифицированном ADX +DI -DI .
Суть стратегии в поиске компромиссного принятия решения по сигналам поступающим от каждой из этих трёх стратегий.
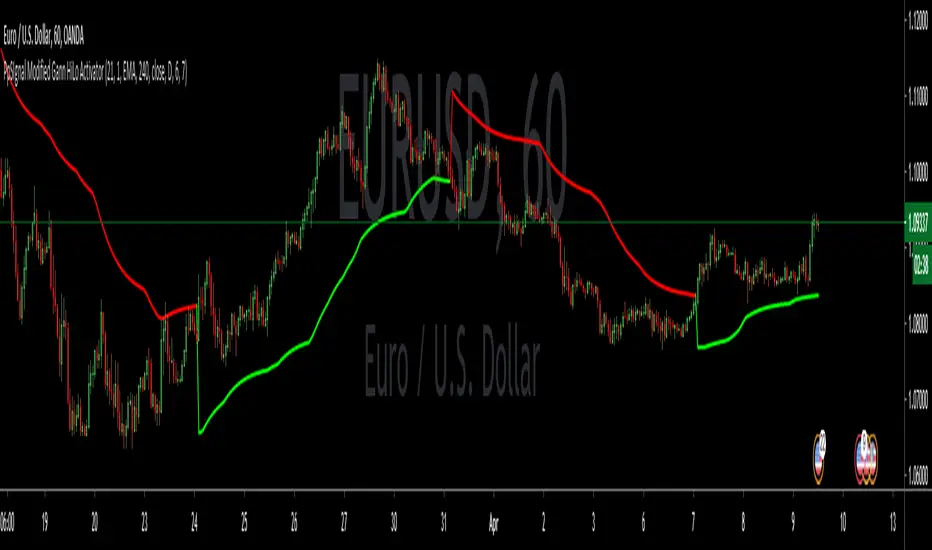
PpSIgnal Modified Gann HiLo ActivatorGann Hi Lo Activator Indicator fue desarrollado inicialmente por Robert Krausz.
El gann Hilo Original es simplemente un promedio móvil de los tres períodos anteriores, bajo o alto.
Yo lo he cambiado por precio de apertura y precio de cierre para evitar repintes .
Este indicador de seguimiento de tendencia, se utiliza para determinar la tendencia del mercado y también para identificar las señales de negociación.
Pero cuando el mercado está lateralizado, le resulta difícil generar señales comerciales precisas. Puede interpretar el indicador leyéndolo de la siguiente manera. En un mercado de tendencia alcista, el indicador pe [pintara de verde en tendecia bajista de rojo.
también le hemos agregado un media movil Tilson para hacer scaplin dentro de una tendencia definida.
Gann Hi Lo Activator Indicator was originally developed by Robert Krausz.
The Original Gann is simply a moving average of the previous three periods, low or high.
I have changed it for the opening price and the closing price to avoid repainting.
This trend monitoring indicator is used to determine the market trend and also to identify trading signals.
But when the market is lateralized, it is difficult for you to generate accurate trading signals. You can interpret the indicator by reading it as follows. In an uptrend market, the indicator pe [will paint green in a downtrend red.
We have also added a Tilson moving average to scaplin within a defined trend.
QUICK BITCOIN VALUATION ~ FILBFILBThis indicator uses On chain Transactions and Total Bitcoins to arrive at an under/over valuation.
>1 Overvalued
<1 Undervalued
>2 - Severe Overvaluation
<0.5 Severe Undervaluation
You need to change the scale to Log, i couldn't work out how to do it, if you can tell me i will update the script.
** Review previous day's candles to avoid transactional lag. **

Blockchain Data ~ FILBFILBOne Indicator with Blockchain info.
Total Circulating BTC
Number Of Transactions
Miners Revenue
Estimated Transaction Volume USD
Estimated Transaction Volume BTC
Bitcoin Market Cap
Difficulty

BITCOIN-BTCUSD Trading Strategy-1This Trading Strategy is for BTCUSD which is traded on BITSTAMP exchange. The aim of this strategy is to ride the market with its ebbs and flows.
The strategy works best on 1 Hour timeframe. The results may very different depending upon time-frame and date range of your choice and different exchanges.
Parameters details:
1. Trade Trigger - You can adjust it depending upon your risk management. Default value is 20.
2. Partial Profit Points – Part profit booking points. Default value is 350.
3. Lookback Period 1 – Default is 11.
4. Lookback Period 2 – Default is 5.
The default trading quantity is 2. I have added functionality for part profit booking which increase profit and always keeps you in trade. Book 1 lot for certain points (350 points gives better results) and continue other with 1 lot till the position reversed.
I have tested this indicator on 1 Hour time-frame on BITSTAMP exchange and the time period is maximum available on Tradingview.
Period : 02/01/2019 to 30/03/2020.
Points = $ 17720.56
No. of trades = 129
% Profitable = 44.96%
Profit Factor = 2.464
Sharpe Ratio = 0.674
For free trial, send me a private message in order to access this script.
Thanks © allanster for Date Range functionality and ©LonesomeTheBlue for non-repaint concepts.
Disclaimer: This script/strategy is for educational and information purpose only. The author of this script/strategy will not accept any liability for loss or damage as a result of reliance on the information contained in the charts and buy/sell signals. Please be fully informed regarding the risks and costs associated with trading the financial markets.

inwCoin Stochastic RSI + MACD Filter StrategyinwCoin Stochastic RSI Strategy with MACD as trend filter.
Parameters Setup
===============
* everything are self-explanatory.
Entry Logic
===========
Long/Cover Short Signal :
- If SmoothK > Bottom Line and SmoothD is crossing up Bottom Line = BUY SIGNAL
- In human word : Both lines cross up bottom line from below.
- If "Use MACD as trend filter" checked, long signal will trigger if MACD > 0
Short/Close Long Signal :
- If Smooth K < Top Line and SmoothD is crossing down Top Line = SELL SIGNAL
- In human word : Both lines cross down top line from top.
- If "Use MACD as trend filter" checked, short signal will trigger if MACD < 0
How to use in real trade
===============
1) Just add to the chart and see the backtest result. Make sure to adjust commission and slippage properly.
2) Recommended to using in Daily Timeframe.
Extra
=====
Short Entry Example ( 2018-2020 )

XBT % ContangoSimilar to my other indicators, but measures XBTUSD Contango in terms of percent.
Also, built it so you could change the values that give the red and green signals. Default values are 0% or less (backwardation) indicates green. However, i found that a 0.5% setting worked will finding local bottoms for current contract of XBTH20 (March 2020). The upper value default is at 5%, and signals red when the next contract reaches over 5%.
My assumption is as BTC increases in value over time, measuring contango in terms of percent will be a better measure of the XBT futures curve.

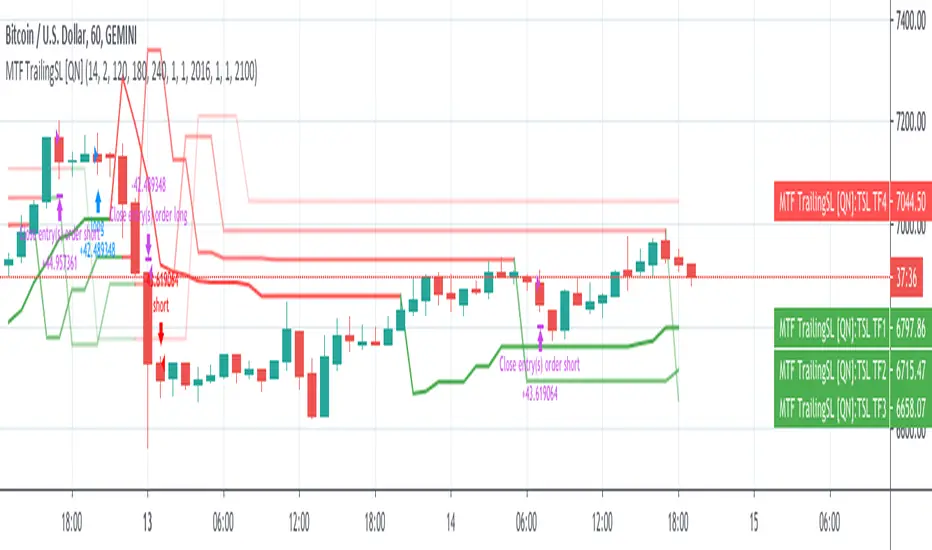
MTF Trailing SL Strategy [QuantNomad]This is a Multi-Timeframe version of my Trailing SL Strategy.
Few weeks ago I published Trailing SL Strategy. There I used only basic Trailing SL to enter positions.
It worked pretty well so I tried to work on it a bit. I thought what if you can use the same ATR TSL on different timeframes and combine them into one signal.
In this strategy you can use only ATR stops and choose 3 other higher timeframes in addition to your current timeframe.
You'll see Trailing SL plotted on the chart form all these timeframes.
Entry Long position if all 4 time-frames agree on long signal.
Exit Long positions when at least 2 time-frames disagree on long signal.
Entry to Short position if all 4 time-frames agree on Short signal.
Exit from Short positions when at least 2 time-frames disagree on Short signal.
Here is the link to my basic Trailing SL Strategy:
Ichimoku Clouds Strong Bullish/Bearish signals and alertsIchimoku Clouds Strong Bullish/Bearish signals with allerts
The Ichimoku cloud was developed by Goichi Hosoda, a Japanese journalist, and published in the late 1960s. It provides more data points than the standard candlestick chart. While it seems complicated at first glance, those familiar with how to read the charts often find it easy to understand with well-defined trading signals.
We provide you easy-to-use script which helps to decrypt meaning of lines in the indicator. The script takes Ichimoku clouds indicator formulas to calculate Tenkan, Kijun, SenkouA, SenkouB values and examines them in order to produce buy ( Bullish ) and sell ( Bearish ) signals which are displayed at the chart
The most appropriate time frame is 30m
Custom alerts are added to send you a notice with a webhook when bullish or bearish signal arrives.
You can easily add weak and neutral signals alerts by removing "//" in a specified place
Feel free to copy and use this script for your ideas and trading. You can modify the script by adding Parabolic SAR in order to increase accuracy of positions closure

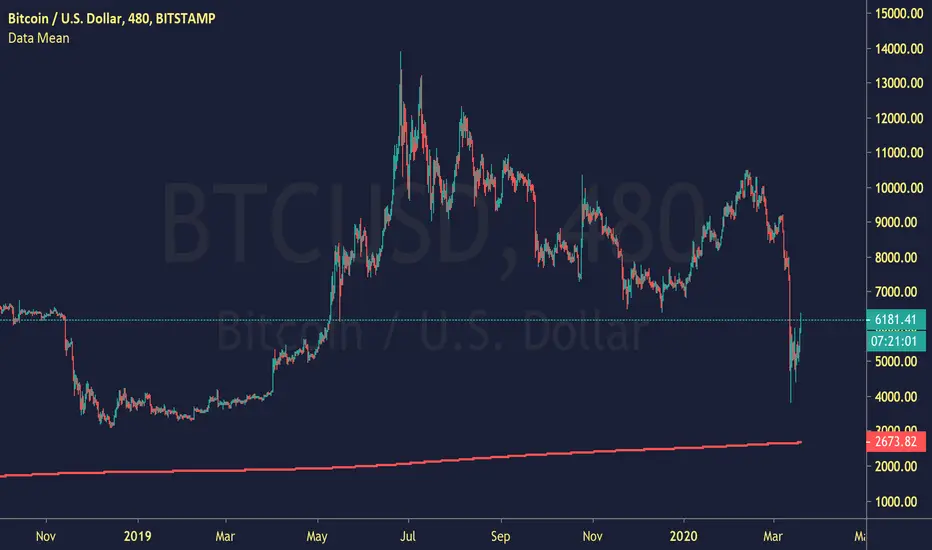
Data MeanCalculating the Mean, given a set of data.
I'd assume BTCUSD needs to touch this on the daily, as it hasn't yet.
"reverting to the mean" is essential in market dynamics.
Super Algorithm Strategy (Joy Bangla)This is the strategy tester for the
Below are the performance results
Starting with $10,000
Net Profit: 88%
66% profitable trades
34% losing trades. Do look at the losing trades. If one did careful moment management, some of those may end up profitable as well.
4.158 Profit factor.
16.1% drawdown. I would go a bit more and say if I am using this, my risk management should ensure for a stop loss of 20%.
66 bars on average (aka it holds for a long time. So, one needs to look into the funding factor in money management)
Sharpe Ratio: 0.291
Only 7 trades done (with 6 closed) in 2 and a half years. So this absolutely reduces noise as much as possible.
In short, if I had $10000 of BTC beginning of 2018, I would be having $18,878 worth of btc right now.
With 4x leverage, this could be a huge potential.
For info on gaining access see the ⬇ link below ⬇ in our signature field & direct message me. I have a busy schedule at my own workplace. Trading is my hobby. Hence, please be kind to me if I am late in replying.

Cuban's BTCUSD Spot Buying GuideI have been using a few different spreads to track market sentiment for $BTCUSD over the last 12 months, and has worked out very favourably.
Although it's a low sample size, I feel as the market has become more efficient, these signals have become more accurate. Obviously, alpha decay will slowly arb these out but I thought I would share this rough guide.
There are many ways you can use these buy opportunities. I recommend buying after waiting for the candle to flip white (from green), this will be accompanied by the text, 'SPOT'. However, aggressive entries can be taken by slowly averaging in while the candle colouring is green.
I have left out any take profit strategy, as I will leave this to the user.
Enjoy!

inwCoin DCA v2.0 StrategyinwCoin DCA v2.0 is the upgraded version of inwCoin DCA strategy
This strategy will show the "actual" profit/loss on the chart, since it cannot calculate by strategy result.
How to use
--------------
1) Specific "position size per entry" for each of your dca budget.
2) "Buy every N candles" is the trigger for strategy to "buy" the asset, it depend on your timeframe on chart. If you want to let it buy every 7 days, set timeframe to daily and set this value to 7.
3) Entry/Exit filter is the condition for you to continue dca buy or stop when some condition met.
3.1) Restart every N candles = the strategy will sell all of your dca position to realize profit/loss every N candles specific in "Reset at N candles" parameter.
3.2) Price above EMA = IF price above specific "Slow EMA length" value, the strategy will dca buy, else, it will sell to realize profit/loss.
3.3) Price above MA = same as 3.2 but use MA instead.
3.4) Price above WMA = same as 3.2 but use WMA instead.
3.5) MACD Above zero = will buy if MACD > 0 and sell all if MACD < 0. Set MACD value in 3 boxes below.
4) Close position at specific profit % = self explanatory
5) Close remaining position at last bar = self explanatory
6) Date = self explanatory
How to read result
================
Everything in result are self explanatory.
Have fun!

PpSignal drake delay oscillator GritasIt is a technique, when the drake oscillator moving averages (Drake Daly Statocastico) cross up you must buy and the histogram is painted in a green color .... when the drake oscillator crosses down and the histogram is painted red you must to sell.
