NVT + HV CombinationFamous NVT indicator combinated with HV
Use with BTC weekly or daily chart. Yellow line represents HV 40 threshold.
Interpretation:
White above threshold -> regular bearish
Red above threshold-> regular bullish
White crossing threshold from below to above -> very bearish
White crossing threshold from below to above -> very bullish
1-BTCUSD

Kimchi Premium Indicator with Selectable SymbolsThis indicator is the Korea Premium, also known as “Kimchi Premium” indicator, which shows how expensive and cheap the bitcoin price of the bitcoin exchange in Korea as compared to the bitcoin price traded in dollars or tether. Previously, the Kimchi premium indicator in TradingView does not have the recently added Upbit BTCKRW market, and it is not possible to select markets. In addition to the recently added Upbit BTCKRW market, this indicator is convenient because you can select all markets offered by TradingView. Therefore, not only bitcoin but also altcoin kimchi premium can be plotted.
▶ Usefulness and Originality
- Users can choose from various BTCKRW and BTCUSD markets.
- Users can plot altcoin Kimchi Premium in addition to Bitcoin.
_____________________________________________________________
이 지표는 달러 혹은 테더로 거래되고 있는 비트코인 가격 대비 한국에 있는 비트코인 거래소의 비트코인 원화 가격이 얼마나 비싸고 싼 지를 나타내는 코리아 프리미엄, 일명 "김치 프리미엄" 지표입니다. 이전에 트레이딩뷰에 있는 김치 프리미엄 지표는 최근에 추가된 업비트 BTCKRW 시장이 없을 뿐만 아니라 마켓을 선택할 수가 없습니다. 이 지표는 최근에 추가된 업비트 BTCKRW 마켓과 더불어 트레이딩뷰에서 제공하는 모든 마켓을 선택할 수 있어 편리합니다. 따라서 비트코인 뿐 만 아니라 알트코인의 김치 프리미엄도 plot할 수가 있습니다.
▶ 유용성과 독창성
- 사용자가 다양한 BTCKRW 및 BTCUSD 마켓을 선택할 수 있음
- 사용자가 비트코인 외에 알트코인 김치프리미엄도 plot 할 수 있음

Chanu Delta StrategyThis strategy is built on the Chanu Delta Indicator, which indicates the strength of the Bitcoin market. When the Chanu Delta Indicator hits “Delta_bull” and “Delta_bear” and closes the candle, long and short signals are triggered respectively. The example shown on the screen is a default setting optimized for a 4-hour candlestick strategy based on the Bybit BTCUSDT futures market. For the 15-minute candle, "Delta_bull=32", "Delta_bear=-31", "Source=hlc3" are best. You can use it by adjusting the setting value and modifying it to suit you.
If you use this strategy in conjunction with the Chanu Delta Indicator, it is convenient to anticipate alert signals in advance. Since the Chanu Delta Indicator represents the price difference based on the Bybit BTCUSDT futures market, backtesting is possible from March 2020.

Chanu Delta IndicatorThe Chanu Delta Indicator was created as the price difference between the two markets using the principle that the Bitcoin price fluctuations in the BTCUSD market on the BYBIT exchange are greater in the BTCUSDT market. This indicator shows the strength of the current market's buys and sells, and helps in short-term trading.
Chanu Delta Indicator (Δ) = BTCUSD ($) - BTCUSDT ($) (Unit: Dollar, Source: Close)
● Δ > 100 : Strong Buy
● 20 < Δ < 100 : Buy
● -20 < Δ < 20 : Neutral
● -100 < Δ < -20 : Sell
● Δ < -100 : Strong Sell

RTA MACD IndicatorRTA MACD Indicator comes from RTA Academy, author: RTA-Ruomise, public indicator.
instruction
This indicator is different from the traditional MACD indicator. The indicator combines the double moving average system with the traditional MACD indicator to judge the trend, and has made a new definition of the fast and slow lines and smooth lines, which is limited to the digital currency market.
And a logarithmic version is added, because as the price of BTC in the digital currency market rises, the BTC base is much higher than before. MACD fast and slow lines indicate price changes. In order to better judge the rate of price changes, the fast and slow lines are processed logarithmically, so that the speed of price changes can be observed more intuitively.
And the new deviation identification function, because there are many ways to define market deviation, according to the author's definition of identification deviation.
Function
Select【Logarithmic Edition】【Original Edition】【Volume Edition】
Modify the length of the fast line (default 14)
Modify the length of the slow line (default 28)
Fast and slow line smoothing (default 10)
——————————————————————————————————————————————————————————
RTA MACD Indicator 来自RTA学院,作者:RTA-Ruomise, 公开指标。
RTA MACD Indicator 中文名 RTA MACD指标
说明
该指标不同于传统MACD指标,指标结合双均线系统,配合传统MACD指标对趋势进行判断,对快慢线和平滑线做了新的定义,仅限于数字货币市场使用。
并新增对数版,因为随着数字货币市场BTC价格升高,BTC基数比之前高得多。MACD快慢线表示是价格变化,为了更好判断出价格变动的速率,对快慢线进行对数处理,这样便能更加直观观察价格变化的速度。
且新增背离标识功能,因为市场背离的方式定义非常多,根据作者定义标识背离情况。
功能
选择【对数版】【原版】【成交量版】
修改快线长度(默认14)
修改慢线长度(默认28)
快慢线平滑(默认10)
当前版本
2021/07/30 V2.2

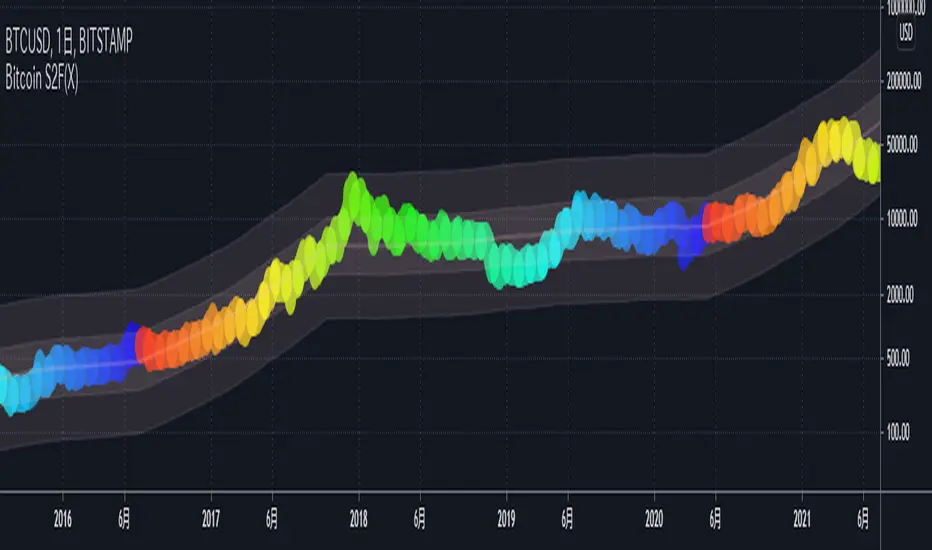
Bitcoin S2F(X)This indicator shows the BTCUSD price based on the S2F Model by PlanB.
We can see not only the S2F(Stock-to-Flow) but also the S2FX(Stock-to-Flow Cross Asset) model announced in 2020.
█ Overview
In this model, bitcoin is treated as comparable to commodities such as gold .
These commodities are known as "store of value" commodities because they retain their value over time due to their relative scarcity.
Bitcoins are scarce.
The number of coins in existence is limited, and the rate of supply is at an all-time low because mining the 2.2 million outstanding coins that have yet to be mined requires a lot of power and computing power.
The Stock-to-flow ratio is used to evaluate the current stock of a commodity (the total amount currently available) versus the flow of new production (the amount mined in a given year).
The higher this ratio, the more scarce the commodity is and the more valuable it is as a store of value.
█ How To View
On the above chart price is overlaid on top of the S2F(X) line. We can see that price has continued to follow the stock-to-flow of Bitcoin over time. By observing the S2F(X) line, we can expect to be able to predict where the price will go.
The coloured circles on the price line of this chart show the number of days until the next Bitcoin halving event. This is an event where the reward for mining new blocks is halved, meaning miners receive 50% fewer bitcoins for verifying transactions. Bitcoin halvings are scheduled to occur every 210,000 blocks until the maximum supply of 21 million bitcoins has been generated by the network. That makes stock-to-flow ratio (scarcity) higher so in theory price should go up.
The stock-to-flow line on this chart incorporates a 463-day average into the model to smooth out the changes caused in the market by the halving events.
I recommend using this indicator on a weekly or monthly basis for BITSTAMP:BTCUSD .
█ Reference Script
Bitcoin Stock to Flow Multiple by yomofoV
GMMAs v2.0 CRYPTO [badshah_e_alam]Hello Traders ,
The GMMAs v2.0 CRYPTO strategy stands for gap modified moving averages designed for cryptos. This is a non Repainting Indicator.
This strategy version is a advanced and modified to one of my previously published indicator named as "gap modified moving average".
I am using my Modified Moving Average indicator for a while. I always wanted to add some more information to moving
averages and made some modification to Moving averages.
The additional Information I have added to the Moving Average helps it to act more quickly based on the price of that
particular asset.
How is strategy gives signals?
when the GMMA'w cross over or cross under the GMMA'y than a trade is taken depending on the filter status.
Info about the settings :
The default setting is for 11m ETHUSD , it works with other cryptos and other timeframe as well . For other timeframes it need to be fine tuned and need little change.
The first category is for the selection of Moving average to be modified and the source to be used for that moving average .
I have added seven moving averages to choose between. SMA works good for me , you can choose and play with other MAs.
following are the option to choose MAs
1.EMA
2.SMA
3.HMA
4.RMA
5.WMA
6.VWMA
7.SWMA
Next option in setting is GMMA'y and GMMA'w :
these two settings define the length and lookback period of the MA you have choosed above.
The length is similar to the length of the moving average chosen to be modified.
The lookback option will look for that number of bars for the modification.
GMMA'w is more sensitive than the GMMA'y. So make sure that the setting input of the GMMA'y is significantly larger than the
GMMA'w.
FILTER:
I have added TradingView inbuilt SUPERTREND as a filter in the strategy, it works very good in filtering out false trades
you can enable/disable it in the settings.
EXIT strategy:
The exit Strategy is based on ATR, Take profit and SL are decided by the ATR in the SL/TP setting option. You can change the RR ratio in the setting.
The backtest settings are as follow:
Initial capital:10k
Initial Commission = 0.000
Initial Pyramiding = 0
Reference :
Thanks to pinecoders and Tradingview community.
my previous gap modified moving average version is :https://in.tradingview.com/script/e3WestBa-Gap-Modified-Moving-Average/
watermark added from:
color gradient framework picked from :https://in.tradingview.com/script/hqH4YIFa-Color-Gradient-Framework-PineCoders/
DISCLAIMER
Any and all liability for risks resulting from investment transactions or other asset dispositions carried out by the user based on information received or a market analysis is expressly excluded by me.
All the information made available here is generally provided to serve as an example only, without obligation and without specific recommendations for action. It does not constitute and cannot replace investment advice. We therefore recommend that you contact your personal financial advisor before carrying out specific transactions and investments.
Do your own research and Risk management before taking any trade.

MacroCorrelation (Bitcoin Real Value)The best minds in the financial world think about how to determine the real value of an asset.
I constantly say that it is necessary to buy an asset only at the moment when its market price is below or equal to its fundamental value. Let's see what is the difference between these two concepts.
Fundamental value
Imagine that we decided to grow and sell, for example, strawberries. For this, we purchased the necessary equipment, tools, fertilizers, seeds, and more. Let's say that we needed $ 3000 for this purpose.
To facilitate the task, in our calculation we will not take into account all types of possible costs (electricity cost, workers' wages, necessary tax deductions, etc.).
If we had to take a loan to meet the initial needs, for example, at 10% per annum , then each borrowed $ 1000 in a year would cost us $ 1100. That is, $ 3000 would cost us $ 3300 per year.
Let's agree that our initial funds were completely enough to buy everything we needed, and we didn't need to take out a loan at a certain percentage. In this case, we exclude from the calculation the cost of the capital required to start your own business.
Suppose we managed to harvest 100 kg of strawberries. This means that the real value (fundamental value) of 1 kg of our strawberries is $ 30.
Market price
Things are a little different with the market price. The market price is determined by the volume of supply and demand for a particular product or service at a particular point in time.
By demand, we mean the intention to purchase a product or service (secured by the ability to pay a set price for it). A need that exceeds solvency is not a demand.
By offer, we mean the willingness to provide ownership (use) of the object of demand for a certain fee.
Simply put, the market price is the price at which the buyer is willing to buy (and the seller to sell) the volume of goods we need.
In our case, the price at which we sell 1 kg of our strawberries will depend on how much people really need our strawberries.
If we are the only sellers of strawberries in a certain territory and, at the same time, buyers really want to taste fresh strawberries, its market price can be as high as the last buyer is able to pay. If not, everything will depend on how high quality our product will be for its price. At the same time, the price constantly varies over a certain period of time ( seasonality and other factors). For example, if in winter we could sell 1 kg of our strawberries for $ 90, then in summer for $ 50. Strawberry prices range from $ 50 to $ 90.
Magic formula
We now understand what is the difference between fundamental value and market price. If the first is made up exclusively of a set of real metrics, the second is a variable factor that depends primarily on “human factors” (what is the maximum price the buyer is willing to pay, what is the minimum price the seller is willing to set at a particular moment in time).
You should try to buy an asset only at the moment when its market price is below or equal to its fundamental value.
However, how can you independently determine the fundamental value of an asset?
Unfortunately, there is no universal answer to this question, just as there is no universal “magic formula” in nature (my sincere respect, Joel Greenblatt) that could determine the fundamental value of any asset on the planet. The point is precisely in the criterion of universality. If we consider each asset (or at least the market) separately, we can well determine its fundamental value.
Even those things that seem free to us in everyday life (just their cost are negligible) have a fundamental value.
Three factors to assess the fundamental value of Bitcoin
Let's try to take a separate asset, for example Bitcoin , and do with it everything that we did earlier with our “strawberry business”.
When assessing the real (fundamental) value of Bitcoin , we will take into account 3 main factors.
1. The maximum possible and current supply in the Bitcoin market
The reward for mining a Bitcoin block is halved every 210,000 blocks. This fact is called halving (halving). When all blocks are mined, the total amount of existing bitcoins will be 21 million coins.
Accordingly, the maximum supply in the Bitcoin network will not exceed 21 million coins.
In reality, things are even better, since this volume also includes a certain amount of lost coins. By lost, we mean all those coins whose “private keys” the last owner no longer has access to. For example, at the time of the appearance of Bitcoin in 2009, its real value was doubtful and not obvious to most of its owners, many of whom did not pay due attention to understanding the safe storage of an asset, periodically losing access to hundreds and thousands of coins.
As a result, we understand that the total supply in the Bitcoin market will be significantly less than 21 million coins.
To evaluate the proposal, it is not enough to understand how much of the asset exists, because a certain amount of it, as we have already understood, can either be lost or be blocked for a long time. It is also important to take into account the criterion of “supply in time”. That is, the current total “liquidity” of the network.
2. Bitcoin network hashrate
The main indicator of the viability and stability of the Bitcoin network is the hash rate (computing power). Stable hashrate = network security.
3. The real value of the US dollar
When analyzing the Bitcoin / Dollar pair, in addition to the real value of Bitcoin , it is also necessary to take into account the real value of the US Dollar .
It is believed that assets such as stocks or cryptocurrencies are extremely volatile (the price can change over a wide range within a relatively short period of time). At the same time, to reduce volatility , experts advise using the so-called “currency baskets”.
A currency basket is a certain percentage of foreign currencies in which the investor's capital can be distributed. The ratio of currency units in the basket is used to reduce the potential risk of currency fluctuations.
The main problem is that, due to inflation , the purchasing power of the currencies themselves drops significantly over time.
With the $ 100 we earned in 1913, already in the 1920s we could have purchased 50% fewer goods and services than before. In the 1980s, it was 90% less, and in the 2010s it was already 98% less.
This fact must also be taken into account when assessing the real value of Bitcoin , since everything is relative, and in the Bitcoin / Dollar pair, we determine the value of Bitcoin , expressed in US dollars.
The real value of Bitcoin
After assessing the relationship of the factors described above and drawing up a mathematical formula, we can proceed to the analysis of the results. In order to cut off unnecessary noise when constructing the function, we will use the graph for 1 month.
Analyzing the resulting chart, first of all, the following is striking: the fundamental value of Bitcoin grows over time. This is due to the gradual expansion of the "user base" of the network, as well as the growth of its popularity among investors of completely different classes.
I propose to compare the graph obtained earlier with the graph of Internet users (in% of the number of adult US citizens ). Similar, don't they?
The more the number of Internet users, the higher its influence and economic potential. The more the number of users of the Bitcoin network, the higher its economic potential and fundamental value.
However, understanding the fundamental value alone is not enough. We, as investors, first of all need to understand when to buy any asset.
To do this, compare the chart of the market price of Bitcoin with the chart of its fundamental value obtained earlier.
Now that we have a complete picture of what is happening and understand both the fundamental value of the asset and its market price, the fact of the numerical prevalence of the price over the fundamental value for 116 out of 133 months becomes quite clear. Periods of Bitcoin being below its fundamental value are extremely rare and only take ~ 13% of the trading time.
For about 87% of all trading time, Bitcoin's market price is above its fundamental value. Those rare periods when traders are willing to sell bitcoin below its fundamental value are an incredible gift for a long-term investor.
Bull and Bear Markets
If you buy Bitcoin (like any other asset) below its fundamental value, this is an absolutely incredible idea in terms of potential profitability, who in their right mind would sell their assets below this mark ?!
It's all about the emotionality of people. Saying “I will not do stupid things when the time is right” is easier than actually maintaining composure. Especially when it comes to money. Your money. And sometimes even dreams.
The classical market theory usually divides the market into two main phases: A bull market is a period of time during which the price rises systematically (accordingly, the demands and expectations of traders gradually grow). A bear market is a period of time during which the price gradually falls (accordingly, traders' requests and expectations gradually fall).
There is also the concept of “correction”: A correction is a temporary change in the price of an asset, contrary to the main trend.
For the current day, there is not a single clear criterion that separates the concept of a bear / bull market from the concept of a correction. However, we can say with confidence that the market change (from bullish to bearish or from bearish to bullish ) is interconnected with the fundamental factors of the market. Corrections, on the other hand, have significantly less connection with fundamental indicators.
and are rather related to the “physiology of the market” (nothing can only rise in price every unit of time for a significantly long time, nothing can only fall in price every unit of time for a significantly long time).
In this case, the most rational would be to define a bear market as a delay in updating the absolute historical highs of the price with a preliminary touch of the fundamental value.
Buying below the fundamental value is always a smarter idea than buying above the fundamental value, since, in most cases, it is the touch of the fundamental value that globally separates a bear and a bull market.
Fun fact: If we were to buy Bitcoin every time it touched the fundamental value, the average buy price as of July 2021 would be $ 1,506.65, which is 87% less than the current fundamental value of Bitcoin .
Conclusions
1. The total amount of Bitcoins , as well as the speed of their production (mining) over time, are programmatically limited, which limits the volume of the maximum possible supply
2. Bitcoin is transported, which means that the volume of supply for the current minute will also depend on the actual volume of assets available for sale
3. The viability of the network is based on the amount of computer power supporting it (network hash rate)
4. When analyzing the Bitcoin / Dollar pair, in addition to the real value of Bitcoin , it is also necessary to take into account the real value of the US Dollar
5. Price ≠ fundamental value
6. Buying below the fundamental is always a smarter idea than buying above the fundamental.
7. Don't believe the headlines of financial news and the public words of financiers
8. Selling strawberries can make a fortune too

Trend From Volume And Price (TFVAP)Indicator that indicates buying and selling times based on price and volume and who is imposed of the two (VAP).
It uses the trends of the Dow theory (primary: 365 days/1 year, secondary: 90 days/3 months and tertiary: 21 days/3 weeks) and the identification of Elliot waves, both impulse and correction, based on the Fibonacci retracements (23.61% , 38.2%, etc.).
- Purple line is the evolution in percentage of the price in the primary trend
- Blue line is the evolution in percentage of the volume in the primary trend
- White line is the evolution in percentage of the (volume % - price %) in the primary trend, if white line > 0
- Green triangleup is time of start to buy
- Green square is time of stop to buy
- Red triangledown is time of sell
To understand it better:
If the purple line goes up it indicates that the price is rising, if it goes down, that the price is down.
If the blue line is greater than 0 it indicates that there are more purchases than sales, if the blue line is less than 0 it indicates that there are more sales than purchases.
If the white line is greater than 0 there is a high volume of purchases or low sales for the price that there is, it is likely that the price will rise.
If the white line is less than 0 there is a low volume of purchases or high sales for the price that there is, it is likely that the price will go down.
PD: Ignore the chart drawings, the indicator script is only represented at the bottom

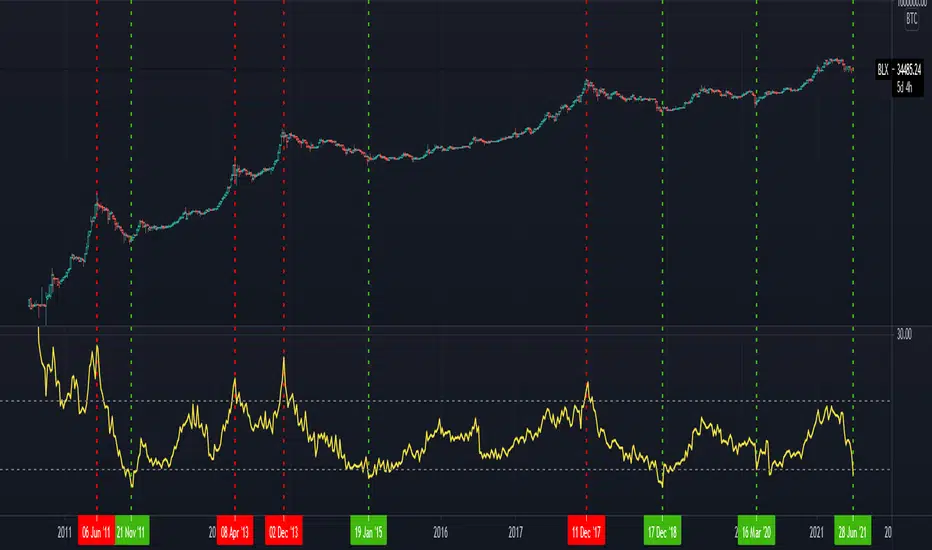
B1rd's Puell MultipleThis metric looks at the supply side of Bitcoin's economy - bitcoin miners and their revenue.
It explores market cycles from a mining revenue perspective. Bitcoin miners are sometimes referred to as compulsory sellers due to their need to cover fixed costs of mining hardware in a market where price is extremely volatile. The revenue they generate can therefore influence price over time.
The Puell Multiple is calculated by dividing the daily issuance value of bitcoins (in USD) by the 365-day moving average of daily issuance value.
So far, buying below 0.5 and taking profit above 4.0 has been proven profitable over the years.
This version allows you to expiriment with different moving average types.
I might update this version in the future with more expirimental tools of measurements, I just need some idea's to work with. So feel free to comment on what you'd like to see added to this version.
mark strategy2 divergence bot v0.5 for xbtusdHi first of all thanks for read this.
This is my second strategy for make trading, I optimized it for xbtusd with 30 min charts.
You can personalize some setting for reach a better result then me, these are the setting:
this script is only for long trade, so bearish divergence don't work
1)ema1
U can change this value for use another ema and use a faster or slower trend
2)ema2
U can change this value for use another ema and use a faster or slower trend
3)pivot right
U can change this value for watch a number of bar on your right
4)pivot left
U can change this value for watch a number of bar on your left
5)high range
U can change this value for watch a max number of bar
6)low range
U can change this value for watch a min number of bar
7)bullish
U can change this value for enable signal with bullish divergence
8)hidden bullish
U can change this value for enable signal with hidden bullish divergence
9)bearish
U can change this value for enable signal with bearish divergence
10)hidden bearish
U can change this value for enable signal with hidden bearish divergence
11)profit 1 %
U can change this value for the first take profit target
12)profit 2 %
U can change this value for the second take profit target
13)qty target 1 %
U can change this value for close a % of your trade at target 1
14)loss %
U can change this value for close the trade at a % of loss
Have nice day and send me a message if u will earn with my strategy.
If u want my code send me a message
for info send me a message

Moonraker OSC 1.1 Moonraker OSC complements the standard moonraker indicator shown on the chart and linked below.
Uses standard divergences within the deviation from the mean to identify trend weakness in the market.

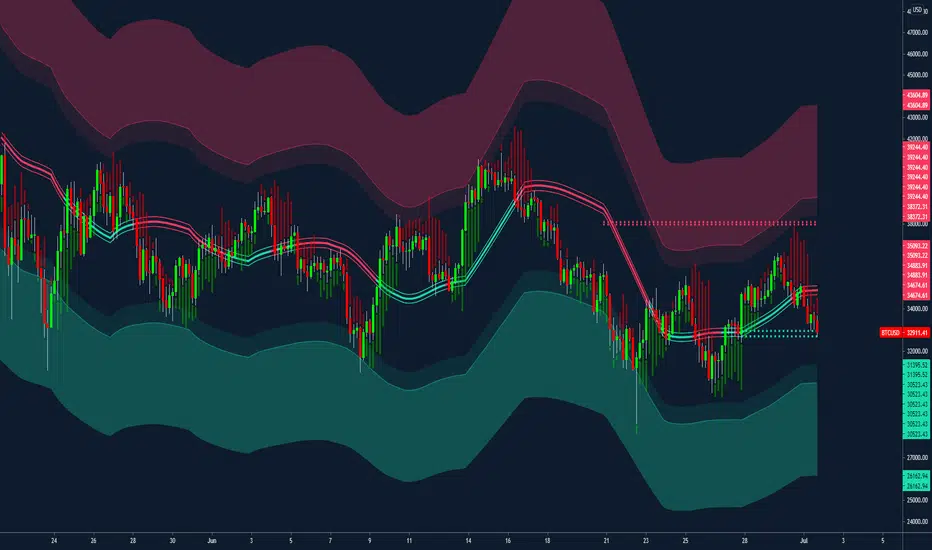
Moonraker 1.3Bespoke Decentrader Mean Reversion Strategy
Colour coded mean line using price and volume
Volatility Bands
Major support and resistance plotted lines
Suggested dynamic hard stop placement
Built for all markets
A realistic strategy for multi-asset portfolio management
Complementary components to assist other indicators/strategies
Key D1 Strategy:
Designed for the 1D+ chart
The overall assumption is that price gravitates towards the mean
The intention is to remain in the market directionally as long as possible
1) Once the asset closes the period above the mean line the asset is considered to be bullish
2) Trader will wait and look to buy close to the developing mean line
3) Trader once filled, remains long
4) If price closes below the mean line, trader will place asks/sell orders close to the developing mean line
5) Trader moves asks along developing mean line until the trade is exited
6) Trader waits in a neutral position until condition 1) is met
Other strategy consideration ;
7) Support and resistance plotted lines can also be used to overrule condition 6) i.e. if the asset falls to a key support area AND trader has already exited, they can look to re-enter and be long to the mean line at which point condition 5) is met
8) Volatility bands can be used as a warning around the deviation from the mean line and probability of reversal
9) Hard stops can be used -> there is a general trade-off between volatility and remaining in the trade – Dynamic hard stops can be used if the trader wishes to add a layer of additional risk management to mitigate unusual volatile events. Should a stop be triggered, waiting for either condition 1) 7) or 8) are met before entering.
Other consideration;
- Works well alongside the Predator indicator; adding additional confluence to the strategy or identifying entries if predator is already within a trend where the initial entry was missed.
Low Timeframe POCI have recently made a High Timeframe POC script (HFT POC) which is pretty popular. Thanks for this!
There are many requests to include lower timeframes in this script, that is why I created this script. I could have incorporated all the timeframe POC's into one indicator but I went this route to keep things more organized between all the different timeframes.
Currently included: Daily, 6H, 3H and 1H
/* DEFINITION */
Point Of Control (= POC) is a price level at which the heaviest volumes were traded.
/* HOW TO TRADE WITH THIS INDICATOR */
The basis for POC is determining bias on whichever timeframe you choose.
1. Identify a POC on the timeframe of your choosing.
/* If you choose the lowest timeframe (1H here) then always make sure to look at the higher timeframes to see how it is trading against a HTF POC.
2. When the price is moving away from the POC (either to the upside or downside) this can confirm or invalidate a trade.
3. You can now enter the trade on bias or wait for a retest of the same POC.
/* EXAMPLE TRADES /*
Here is a screenshot of some of the trades that are possible using these Low Timeframe POC's and some common sense.
s3.tradingview.com

Market Share AnalysisHOW THIS INDICATOR WORKS
-----------------------------------
I've been working on this new indicator to compare, for example, BTCUSD with it's market share or market dominance.
Market Share is the Coin's market cap divided by Total Market Cap. For example, Bitcoin Market Share is currently sitting around 45.7 %
Meaning, Bitcoin is around 45% of the total market of cryptocurrencies.
This indicator has different configurations you should pay attention.
1- Output:
- Market Share Change: this is the percentage change for market share from bar to bar moving up and down from a central line.
- Market Share: this is the close price from the market share symbol selected above.
2- Highlight:
- Divergences: Divergences shows the moment when the price rises and the dominance decreases or vice-versa. Divergences has extra config parameters (explained below).
- Rising/Decreasing: This plots a background red color when the market share price is below its MA(20) line and green background when it's above this line.
3- Show Abnormal signs:
This will print a plus sign in the market share chart when the market dominance rises or decreases too fast (Try changing StDev from 2.0 to 3.0)
4- Divergences:
Divergences has extra config parameters. For example, we want the price to rise or decrease 1% to show a divergence with the market share. Otherwise, it's not as important for us. Also, we can accept to consider an abnormal volume in the divergence or not.
HOW CAN WE INTERPRET THIS INFORMATION
-------------------------------------------------------
I've noticed when bitcoin rises in market share, it's doing or it's preparing for a Big Move. Usuallyl altcoins are dumping and Bitcoin gains the main attention. Best place to be is BTC.
I've also noticed when USDT.D dominance rises, means a big dump is happening or it's close to happen. The capital flow from different coins to Tether.
I have also observed the Bitcoin dominance divergences show us the moments of panic sell in the market. During those moments of extremely selling pressure, the capital flows from Alts to BTC again gaining market share when the price is dropping hard.
MORE INFO
--------------
This indicator allow us to change the symbol to any other like for example ETH.D. I encourage you to go to ETHUSD pair from your favorite exchange in 4H time-frame and change the symbol from this indicator to match ETH.D to have the Ethereum Market share to compare one next to each other.
You're going to find amazing divergences and rising/decreasing moments. Also, try looking at ETHBTC, and then check for ETH.D dominance. Amazing divergences will appear. I hope these are good signs for you too.
To reference any other symbol rather than BTC.D you can easily change the symbol to any other option like:
BTC.D => Ethereum Market Share
ETH.D => Ethereum Market Share
XRP.D => XRP Market Share
All these tickers are from CRYPTOCAP. So the correct ticker name would be for example: CRYPTOCAP:BTC.D to have the Bitcoin Market Dominance calculated by Trading View.
If you like the indicator, please like and comment below.
Good trades!

High Timeframe POCBecause the big Bitcoin crash I have been looking a lot at high timeframe metrics. I never spent much time learning POC so I decided to create a little script for determining these on higher timeframes.
Currently included: Monthly, 3 months and 6 months.
/* DEFINITION */
Point Of Control (= POC) is a price level at which the heaviest volumes were traded.
Value Area High/Low (=VAH/VAL) is a range of prices where the majority of trading volume took place. Naturally, Value Area High being the top price level and Value Area Low being the lowest. POC always is between the two.
/* HOW TO TRADE WITH THIS INDICATOR */
The basis for POC is determining bias on whichever timeframe you choose.
1. Identify a POC on the timeframe of your choosing.
/* If you choose a "low" timeframe (monthly here) then make sure to look at the higher timeframes to see how it is playing against a higher timeframe POC.
2. When the price is moving away from the POC (either to the upside or downside) this will confirm or invalidate the trade.
3. You can now enter the trade on bias or wait for a retest of the same POC.
/* EXAMPLE TRADES /*
Here is a screenshot of some of the trades that are possible solely using the POC and some common sense.
s3.tradingview.com

BTC|scanner|LONG|SHORT|30min STRATEGY- This strategy based on BTC|Scanner| v0.6b INDICATOR.
- Stop loss and take profit settings are available.
- This strategy can be used on a 30m timeframe and does not require fine tuning.
Detailed description of the strategy:
-According to the terms of the strategy:
-The initial deposit is $ 1000.
-The entry into the trade is carried out with the leverage from x3 to x8.
-Each entry/exit is shown by up/down arrows on the chart, the number of arrows shows the size of the leverage in the trade.
-Enter the trade with 100% of the deposit.
-All of the above suggests that with the input signal and the indication of the three arrows, an entry in the amount of$3000 will be made. If the shooter is 5, then$5000.
-Exit from the long/short position under the strategy conditions is carried out by 33% of the initial position volume on all TP (you can specify an unrealistic value of TP3, then the exit of 33% will be due only to an increase in the risk of further holding the position, but this can both increase profit and reduce it).
-To avoid distortion of the strategy indicators due to compound interest, it is recommended to take a period of a month to view statistics.
-The "Enter Confirm" field displays the confirmation of the trade, if several signals appear sequentially, the trade will be executed, and if the signal appears once, the trade will be skipped.
-The "ratio" field indicates the coefficient of change in activity on the current bar from the previous bar.
-The "Corner" field changes the angle of the stop loss correction depending on the time in the direction of reducing the loss.
-The "Short trigger" field indicates from which phase of activity you can open a short trade, conditionally this is a sinusoid with a lower limit of 0 and an upper limit of 100, but the sinusoid itself does not necessarily reach 0 and 100, the activity can stop at 80 and go towards 0 (initially the value 65 is specified).
-The "TP and Stop loss" fields are the percentage of profit / loss multiplied by 10. (the value 35 corresponds to 3.5%, 20-2% , and so on).
-The "cross action" field includes closing the trade when the activity sinusoid reaches the value of 99, regardless of any other calculations.
-The stop loss is displayed on the chart with orange and white dots.
The indicator and strategy can be applied not only to BTC , but it often has poor statistics on illiquid instruments.
////////////////////////////////////////////////////////////////////////////////////////////////////////////////////////////////////////////////////////////////////////////////
- Эта стратегия основана на индикаторе BTC|Scanner| v0.6b.
- Доступны настройки стоп-лосса и тейк-профита.
- Эта стратегия может быть использована на 30-минутном таймфрейме и не требует тонкой настройки.
Подробное описание стратегии:
-Начальный депозит составляет 1000 долларов.
-Вход в сделку осуществляется с кредитным плечом от х3 до х8.
-Каждый вход/выход отображается стрелками вверх/вниз на графике, количество стрелок показывает размер кредитного плеча в сделке.
-Вход в сделку на 100% депозита.
-Все вышесказанное говорит о том, что с помощью входного сигнала и индикации трех стрелок будет совершен вход на сумму 3000 долларов. Если стрелок 5, то 5000 долларов.
-Выход из длинной/короткой позиции по условиям стратегии осуществляется на 33% от объема начальной позиции по всем ТП (можно указать нереальное значение ТП3, тогда выход на 33% будет обусловлен только увеличением риска дальнейшего удержания позиции, но это может как увеличить прибыль, так и уменьшить ее).
-Чтобы избежать искажения показателей стратегии из-за сложных процентов, рекомендуется использовать месячный период для просмотра статистики.
-В поле "Enter Confirm" отображается подтверждение сделки, если последовательно появится несколько сигналов, сделка будет выполнена, а если сигнал появится один раз, сделка будет пропущена.
-Поле "ratio" указывает коэффициент изменения активности на текущем баре по сравнению с предыдущим баром.
-Поле "Corner" изменяет угол коррекции стоп-лосса в зависимости от времени в направлении уменьшения убытка.
-Поле "Short trigger" указывает, с какой фазы активности вы можете открыть короткую сделку, условно это синусоида с нижней границей 0 и верхней границей 100, но сама синусоида не обязательно достигает 0 и 100, активность может остановиться на 80 и пойти в сторону 0 (изначально указано значение 65).
-Поля "TP и Stop loss" - это процент прибыли / убытка, умноженный на 10. (значение 35 соответствует 3,5%, 20-2% и так далее).
-Поле "cross action" включает закрытие сделки, когда синусоида активности достигает значения 99, независимо от любых других расчетов.
-Стоп-лосс отображается на графике оранжевыми и белыми точками.
Индикатор и стратегию можно применить не только к BTC , но зачастую он имеет плохую статистику на неликвидных инструментах.
////////////////////////////////////////////////////////////////////////////////////////////////////////////////////////////////////////////////////////////////////////////////

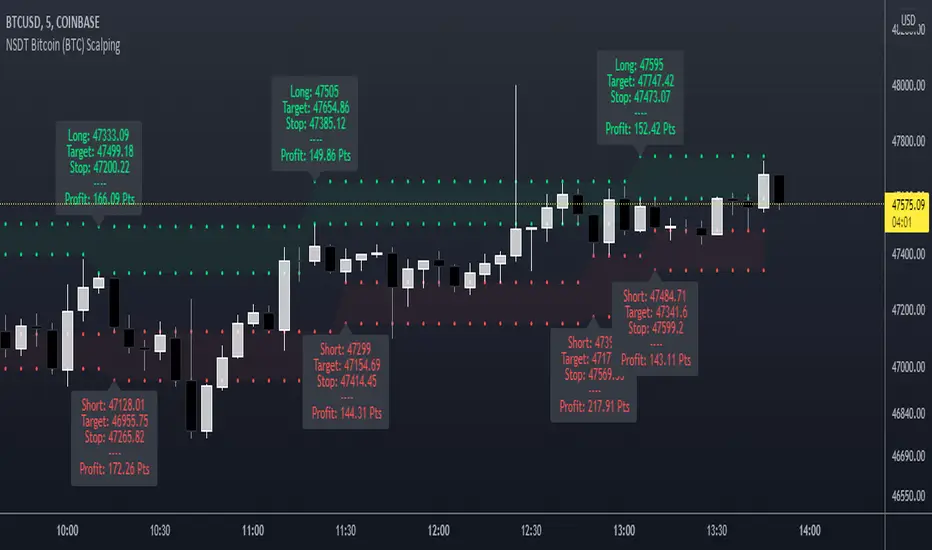
NSDT Bitcoin (BTC) ScalpingThis indicator is specifically designed for scalping Bitcoin (BTC). It looks for a particular price pattern/sequence and displays a label on the chart to show a potential entry, target, and stop based on that analysis. Basically enter long through the green zones and short through the red zones. These levels are not guaranteed to be hit. Trading is risking and you can lose money. Trade at your own discretion and risk. This indicator is only providing potential scalping zones based on recent price action.
Bitcoin Logarithmic Regression RainbowI know there are a lot of BTC rainbows out there, I just wanted to publish my version with my fittings to the BTC price.
The grey channel at the bottom encloses the March 2020 Corona dump.
For best experience USE WEEKLY TIMEFRAME .

Golden Mile indicatorThis indicator is based on several different collectively calculated indicators which are already used by many traders.
These include:
RSI
MFI
WaveTrend
Stochastics, and a few more bits i've thrown in.
This indicator can be used on any time frame, and is highly effective at helping decide whether the pressure lies in Buys or Sells.
free access..
Enjoy! :)

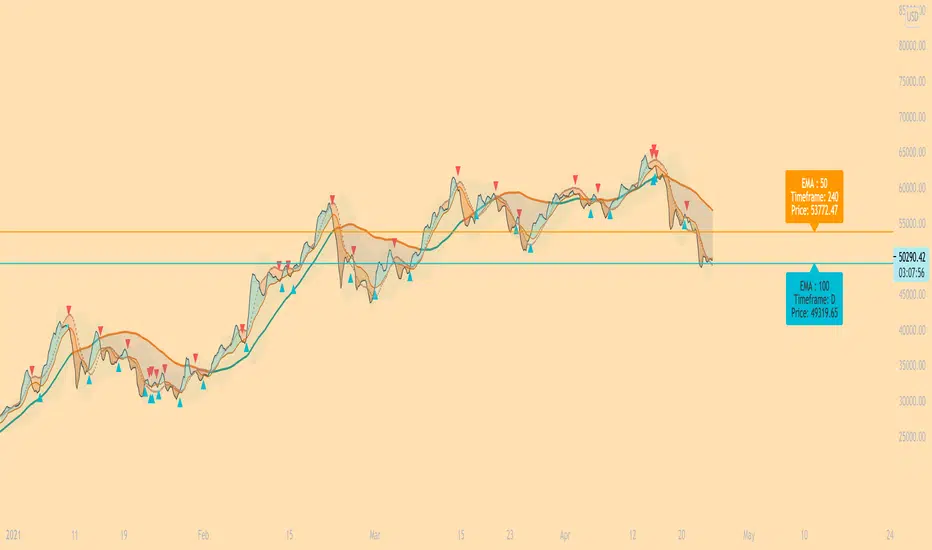
Professor Snipe: A superadaptive moving average. Prof. Snipe is a superadaptive, multi-purpose indicator I developed in order to judge market trend strength and show high probability entry points.
The indicator is focused around a zero lag moving average algorithm (SUPER-MA, ), that changes its parameters depending on the volatility (ATR) and trend strength (ADX).
If the price (black 3 period MA) is above the Super-MA, this indicates market momentum and strength. If price is below the Super-MA, price and momentum are showing weakness.
Micro-Signals are given based on smaller lag-free moving average crossovers (blue and red arrows), but entries will depend on the location of price, with respect to the super-MA.
Furthermore, to judge the current price position with respect to high timeframe averages, the algo will automatically show the location of the nearest moving averages for support and resistance.
/////////////////////////
Entry Conditions example.:
For Longs:
Wait until the 4 hour trend flips bullish, price above Super-MA. Once it does, it will often retest the Super-MA as support. When that happens, use the next entry signal to go long.
For further safety, check the safety net (dotted hull moving average) to see if price has broken above that too, for an optimal long.
-- use caution when entering longs if: price is floating around the super-ma (very weak trend) and if price is below super-ma.
For Shorts:
Wait until the 4 hour trend flips bearish, price below Super-MA. Once it does, use lower timeframes to find short entry points using the MA signals.
-- use caution when entering shorts if: price is floating around the super-ma (very weak trend) and if price is above super-ma.
DYOR and test it yourself to find what works for you.
BE AWARE!
Just following the entry and exit signals (arrows) will not give you perfect results.
Summary:
Overall, this is probably the best indicator I have ever created, and has a very high success rate when used properly.
Best,
MM
Optimized Keltner Channels Strategy for BTCThis strategy is optimized for Bitcoin with the Keltner Channel Strategy, which is TradingView's built-in strategy. In the original Keltner Channel Strategy, it was difficult to predict the timing of entry because the Buy and Sell signals floated in the middle of the candle in real time. This strategy is convenient because if the bitcoin price hits the top or bottom of the Keltner Channel and closes the closing price, you can enter Buy or Sell at the next candle start price. In addition, this strategy provides a visual plot of the price (bprice, sprice) at which the candle is closed by hitting Keltner Channel.
▶ Usefulness and Originality
- Convenient Buy and Sell entry compared to the original Keltner Channel Strategy
- Optimized for BTCUSD market (maximizing profits)
___________________________________________
이 전략은 TradingView의 Built-in 전략인 Keltner Channel Strategy를 비트코인에 맞게 최적화되었습니다. 기존의 Keltner Channel Strategy는 Buy, Sell 신호가 캔들 중간에 실시간으로 떠서 진입 시점을 예측하기 어려운 불편함이 있었지만 이 전략은 비트코인 가격이 Keltner Channel 상단 혹은 하단을 찍고 종가를 마감하면 그 다음 캔들 시작가에서 Buy 혹은 Sell 진입이 가능하여 편리합니다. 또한, 이 전략은 Keltner Channel을 만나서 캔들을 마감한 가격 (bprice, sprice)을 시각적으로 plot을 제공하여 타점 및 차트를 보기에 편리합니다.

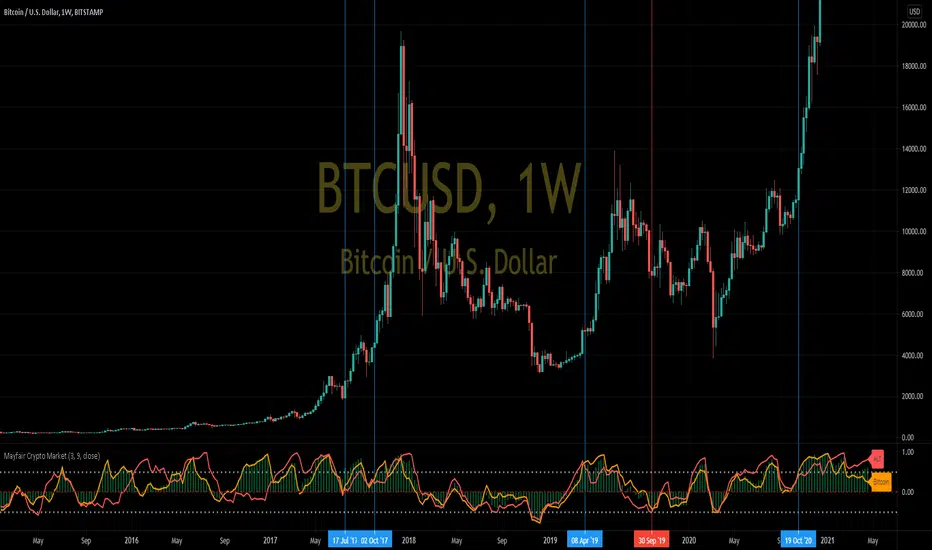
Mayfair Crypto Market 1.0In this indicator, we compare the market capitalisation of Bitcoin(in gold colour) with the market cap of all the other cryptocurrencies (in red), and the market cap of the whole cryptocoin market (the green histogram).
As you may be able to see, when Bitcoin (gold colour) crosses over the Others (red colour) in the indicator, it signifies a swing in popularity towards Bitcoin, and it appears to have predicted some of the recent large rallies (blue Vertical lines) and pull-backs (red vertical lines)
Like all indicators, it is not perfect, and you should never rely on one indicator in any situation.