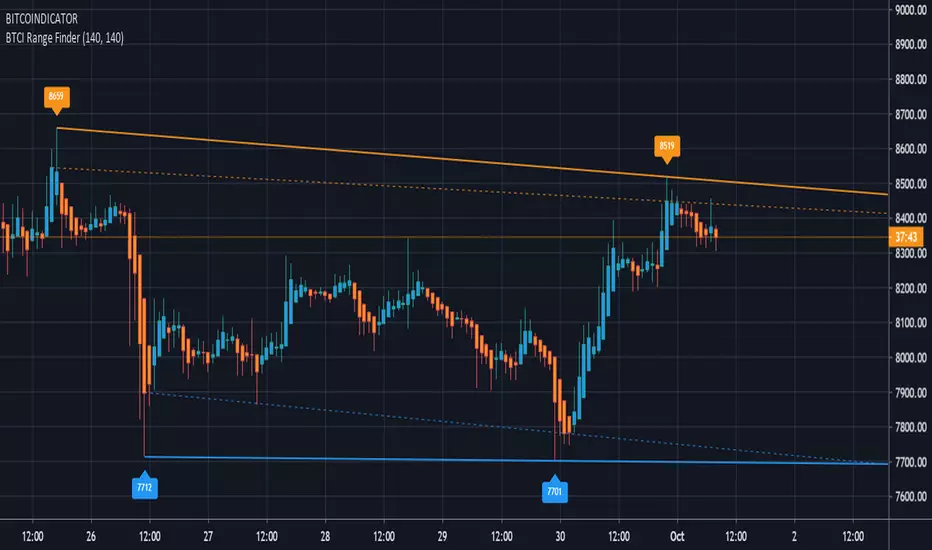
BITCOINDICATOR Range FinderShows the current trading range and market direction, with clear Support and Resistance zones.
Eliminates the need to manually draw trend lines and add price labels.
How to use:
Adjust the "Draw support/resistance from how many bars back" inputs to find an accurate trading range according to your timeframe and trading strategy.
Example (chart above): Bars back values are both set to 140. The left resistance label "8659" targets the "high" of the upper half of the bars back input (71-140). The right resistance label "8519" targets the "high" of the lower half of the input (0-70). The supports work the same way but target the "lows".
The dotted lines are drawn from the two "highest closes" (resistance) and the two "lowest closes" (support) over the same input range and can be used to create support & resistance zones.
Side note: the colored bars come from the BITCOINDICATOR indicator with the labels and symbols removed.
This indicator works for ANY chart and all markets.
*The Bitcoindicator Range Finder is part of the Bitcoindicator package.
For detailed information on Bitcoindicator and how to add it to your charts, please visit:
www.bitcoindicator.com
1-BTCUSD
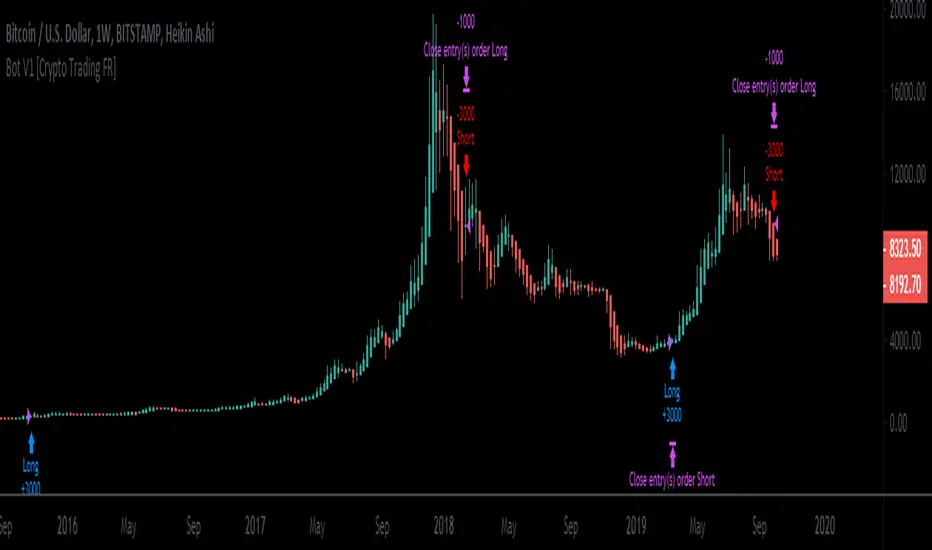
Crypto Trading France algo indicator V1This is an experimental study which calculates WMA and MA channel crossover over a specified period or interval using custom lengh for its calculations.
Some valuable tips:
- MUST USED Heikin-Ashi candles
- BTCUSD Bitstamp chart for longer backtest results
- Longer timeframe (2h, 4h, 1D, W) are better
- Moove the "Lengh - Speed" setting to adapt the strategy regarding the asset and timeframe used.
For example on BTCUSD ( Bitstamp ) my favorites "Lengh - Speed" values are:
4H > 4, 6, 31
1D > 6, 16
W > 12
Tested with both Crypto & Forex, results are extremly accurate and entry are most of the time predicted in the right way.
I don't necessarily recommend using this tool as a standalone, but rather as a supplement to your analysis systems.
This indicator DO NOT REPAINT
Hope you'll enjoy it :)
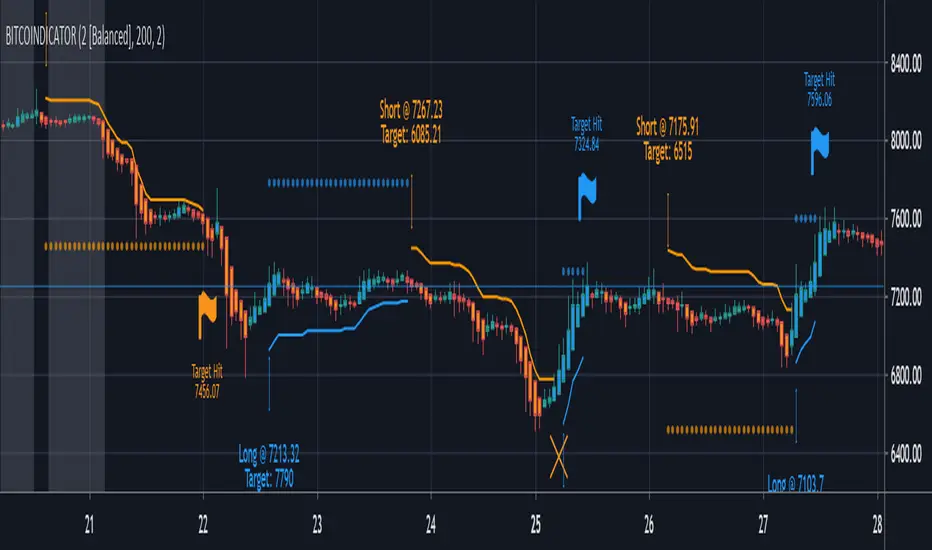
BITCOINDICATORAll-in-one indicator designed for Bitcoin (any BTC/USD pair), and works well for all Crypto/stable coin pairs. It utilizes individual trade signals from price momentum, EMA crossings, periodical VWAP, volume divergences, and market volatility to create a checklist that when filled, generates easy-to-read, real-time trade labels.
For detailed information on Bitcoindicator and how to add it to your charts, please visit:
www.bitcoindicator.com
Nitro LOTUSWelcome to the Nitro LOTUS.
This indicator does NOT repaint!
How to use: Wait for the candle to close before taking a signal. You can also set alerts with this indicator!
BULL = Buy alert
BEAR = Sell alert
DM if you have any questions!

ZomyzoX Scalp 1 MinuteEnglish
XBTBTC, BTCUSD , BTCUSDT is a strategy made to parity for 1 minute. Scalp is a very successful strategy for trading. It is free to use. Optionally, other strategies can be written.
Contact
Twitter: @zomyzox
Mail: oguzhan.yilmaz@hotmail.com.tr
Türkçe
XBTBTC, BTCUSD , BTCUSDT paritesi için 1 DK'da scalp trade için yazılmıştır. Scalp trade için başarılı buluyorum. Kullanımı ücretsizdir. İsteğe göre başka stratejilerde yazabilirim.
İletişim
Twitter: @zomyzox
Mail: oguzhan.yilmaz@hotmail.com.tr

iwin* this is a tool not intended to be used as financial advice or to make any investment decisions.
* invest at your own risk
Green - Bullish
Red - Bearish
Yellow - Caution

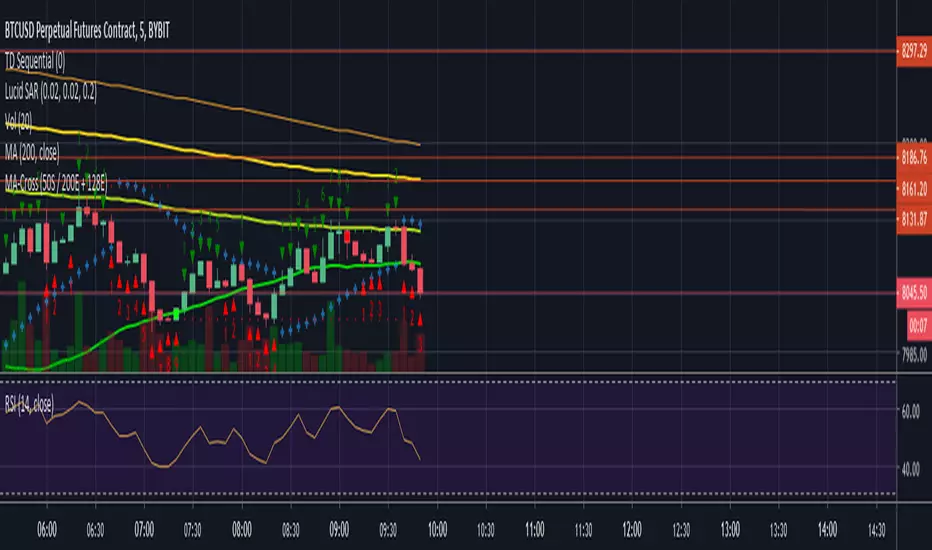
50 SMA / 200 EMA / 128EMA Moving Average CrossFound success using 50SMA vs 200EMA.
128 EMA also charted for it's BTC relevance.
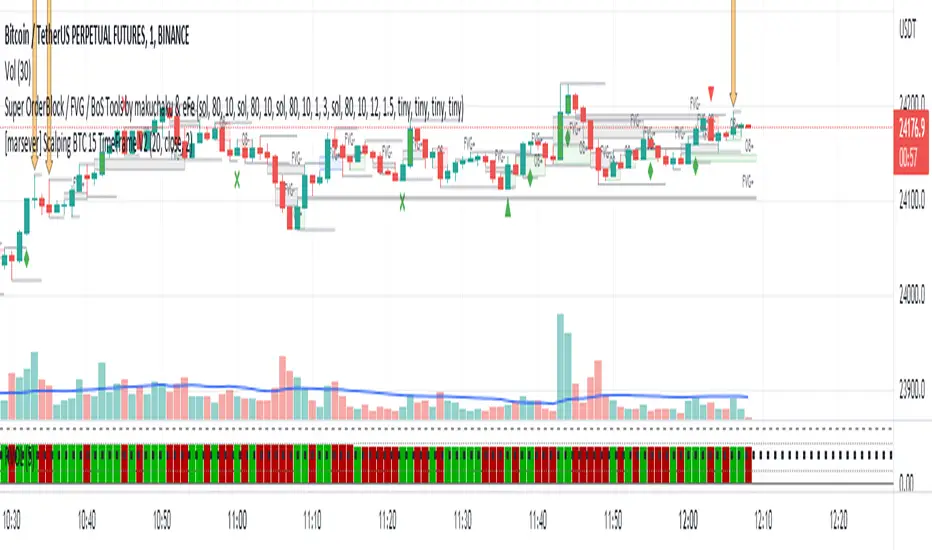
Scalping BTC 15 TimeFrameGreen arrow = enter LONG
Orange arrow = enter SHORT
LONG = SL under LOW of candle marked with GREEN arrow
SHORT = SL upon HIGH of candle marked with ORANGE arrow
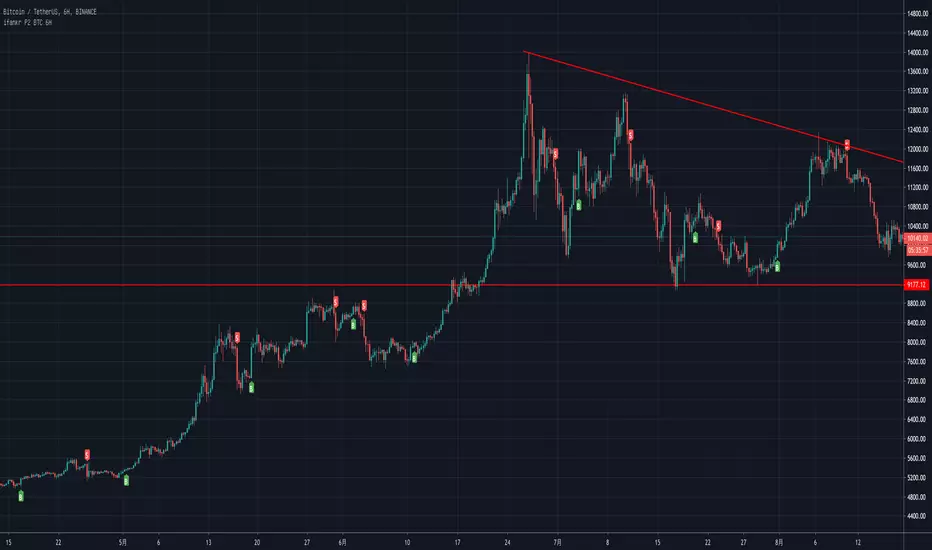
Lancelot vstop intraday trending strategyDear all,
Free strategy again.
I found using 3 volatility stop with different settings could be very helpful when trading an intraday trending market.
With the ATR setting or 5, 10, 15, we can weed out many false break.
Vstop setting is OHLC4.
On the other hand, this strategy also utilize Renko as part of the strategy, so you could say this strategy is mainly an intraday break out trend following strategy.
Works well on BTCUSD XBTUSD, as well as other major liquid alt Pairs.
And lastly,
Save Hong Kong, the revolution of our times.

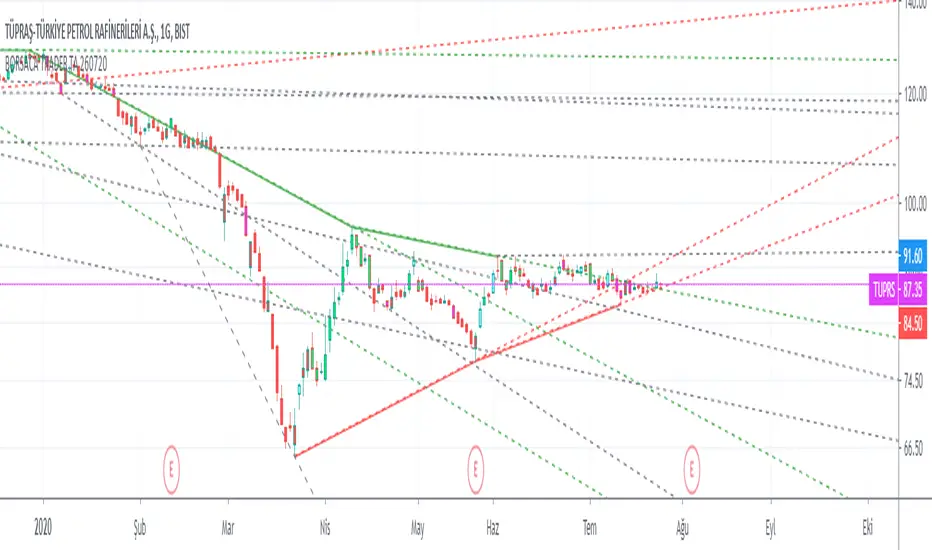
BORSACA TRADERBORSACA TRADER does NOT REPAINT. If the signal occurs it will be forever. Easy and profitable strategy optimized for Crypto, Foreks and Stock Markets...
This indicator gives you Long and Exit signals all timeframes...
BORSACA TRADER is optimized to catch trend movements as soon as possible and maximize profitability.
Strategy tester results. 96% Profitable on BTCUSD Daily scale. Test other markets you want.
WE RELY ON OUR INDICATOR TO THE END. AND WE ASSURE YOU THERE IS NOTHING BETTER THAN THE BORSACA TRADER INDICATOR.
Best regards and happy trading.
Herif's winning strategy option. Check the strategy tester results success than %96
Safe Mode as optional parameter. You can enable this to prevent some riskier trades to happen at the cost of some profitability. Use it if you are more conservative in trading.
Normal Mode signals for Buy and Sell. Trade Mode signals for buy and sell use with support and resistance levels.
Auto Support And Resistance ..
Auto Fibonacci Levels...
BORSACA TRADER indicator is the best option for everybody in financial markets. Check my Profile Page for more information and follow me, like and favorite my indicator and support your positive response and take a message for 10 days trial.
UPDATED PINE SCRIPT V4
Happy trading. Good luck :)
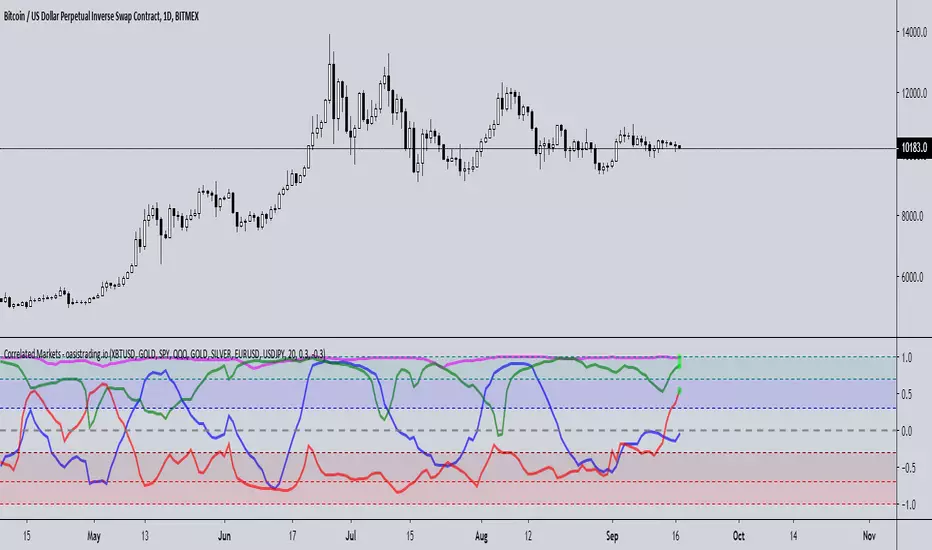
Correlated MarketsThis indicator is free to all Oasis Trading Group members.
This indicator reads correlations between two symbols of your choice, and displays 4 correlations at the same time.
The upper and lower thresholds are user-definable, alerts and visual indications are given when the line crosses the level.
This indicator uses a correlation coefficient which ranges between -1.0 and +1.0.
A correlation of +1.0 implies a perfect correlation while -1.0 implies the two pairs are in complete opposition.
This is useful not only in Forex trading but also for managing or diversifying your portfolio or for finding patterns,
for example when two Forex pairs move independently or an altcoin splits from BTC .
A circle on the +1 line will display for a positive correlation (or whatever you set the threshold to and vice versa for the -1 line.
Alerts are also available for each correlation pair.
For Access or Questions: Private message us. Thank you.
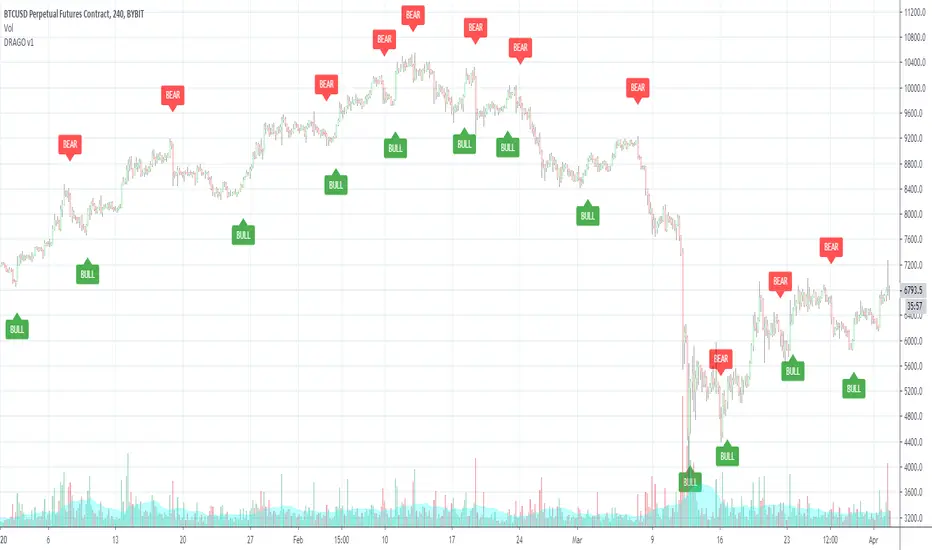
DRAGO v1Welcome to the DRAGO v1.
This indicator is best used on heikin ashi candles on higher timeframes such as 4hr, 1 day.
You can set alerts on this indicator for Buys and Sells.
This indicator does NOT repaint.
No back tester is currently provided with the Express.
DM for access!
QuarryLake v4As some of you requested, I will make the code for QuarryLake Open for you all.
I have also updated the script in version 4.
This strategy consists of 3 indicators that I found works quite well together.
Keltner Channel, Waddah Attah Explosion, and Volatility Stop .
KC Period = 200
KCATR = 5
Vstop Period = 3
Vstop Mult = 1.5
Long when close > KC, close > Vstop, WAE trendUp
Short when close < KC, close < Vstop, WAE trendDown
Works well on BTCUSD XBTUSD , as well as other major liquid Pair.
This strategy utilized a modified Kelly position sizing for BTCUSD Bitstamp , feel free to modify it to your needs.
And lastly,
Save Hong Kong, the revolution of our times.

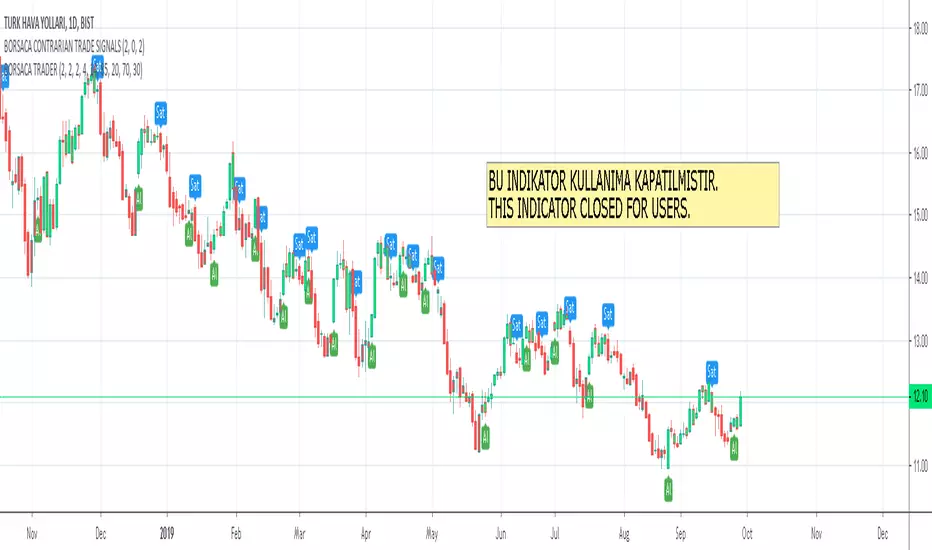
BORSACA CONTRARIAN TRADE SIGNALSThis indicator does NOT REPAINT. If the signal occurs it will be forever. Easy and profitable strategy optimized for Crypto, Foreks and Stock Markets...
This indicator gives you Long and Exit signals all timeframes...
BORSACA CONTRARIAN TRADER is optimized to catch trend movements as soon as possible and maximize profitability.
Strategy tester results. 96% Profitable on BTCUSD Daily scale. Test other markets you want.
WE RELY ON OUR INDICATOR TO THE END. AND WE ASSURE YOU THERE IS NOTHING BETTER THAN THE BORSACA TRADER INDICATOR.
Best regards and happy trading.
Added Auto Support And Resistance ..
Added Auto Fibonacci Levels...
BORSACA CONTRARIAN TRADER indicator is the best option for everybody in financial markets. Check my Profile Page for more information and follow me, like and favorite my indicator and support your positive response and take a message for 10 days trial.
Happy trading. Good luck :)
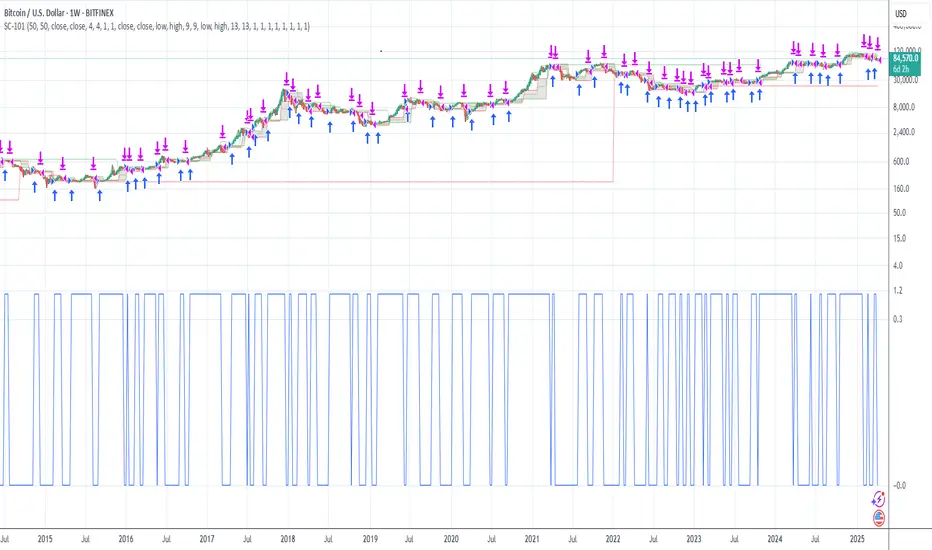
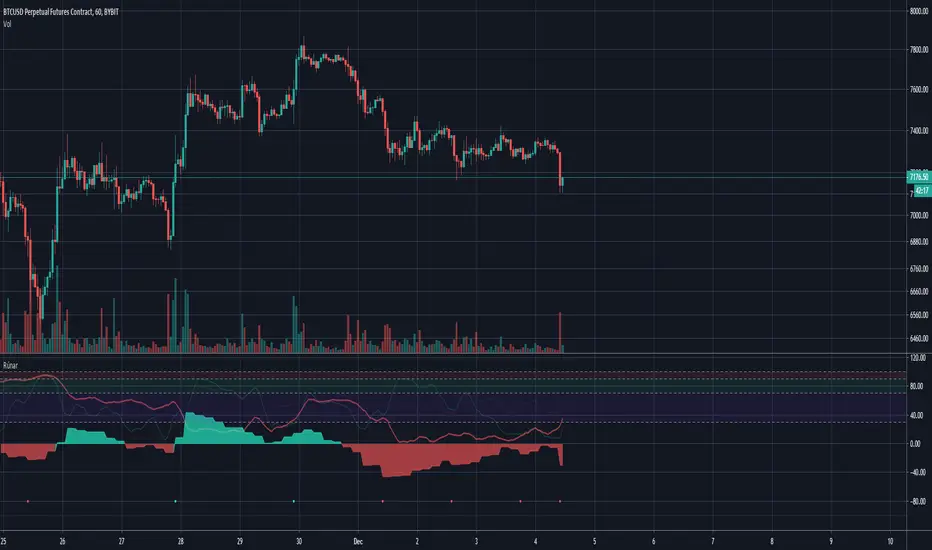
Rúnar - Secret Wisdom (Runar)Rúnar is an extension of my "Current script". Runar is a MTF indicator that looks at the market across several sections to determine strong buy signals and end of trend.
The best way Runar is used is entering on Green/Red dots and exiting the market once the oscillator rolls down or if you have the daily filter turned on, using the next opposite signal.
This indicator is something I'm seriously proud of and insane for swing trading.
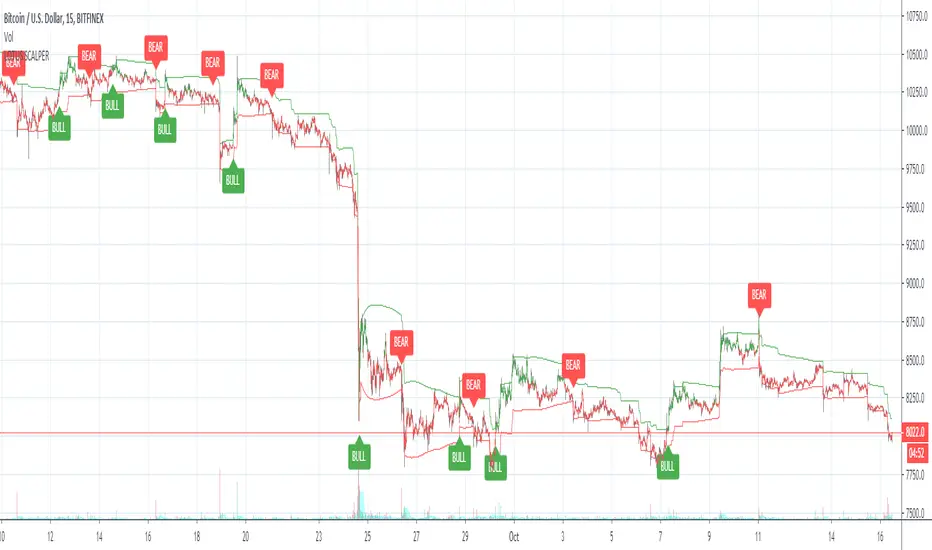
Lotus scalperWelcome to the Lotus scalper. This indicator is designed for scalping the 15m and 30m timeframes.
BULL = Buy
BEAR = Sell
Enjoy and let me know if you have questions!
You can also set alerts with this indicator!
Welles Wilder MAHow to trade:
Recommended for longer timeframes at least 4H.
Buy when the green dot appears.
Sell when the yellow dot appears.
Welles Wilder moving average by XOOOOOO

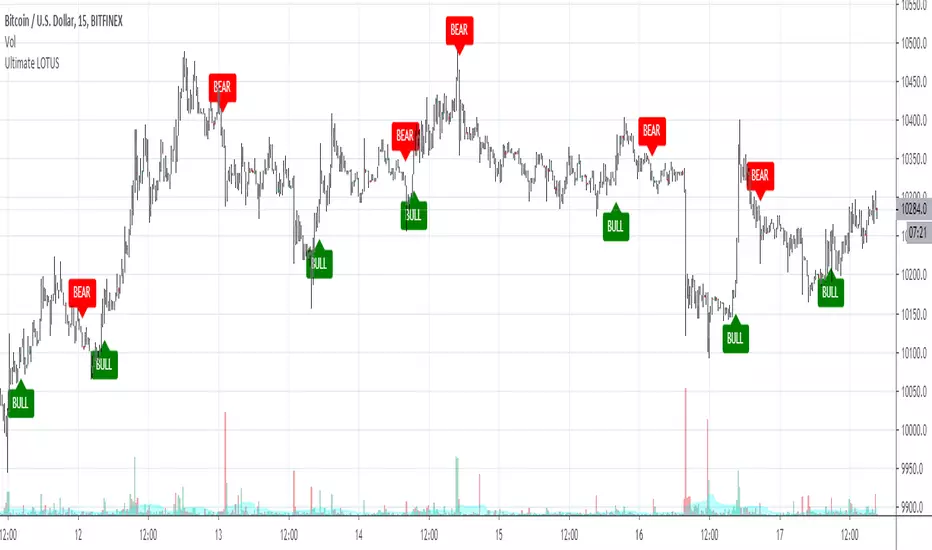
Ultimate LOTUSWelcome to the Ultimate LOTUS.
You may have used my original Lotus indicator from last year. This is the new and improved version of the Lotus.
This indicator does NOT repaint!
How to use: Wait for the candle to close before taking a signal. You can also set alerts with this indicator!
BULL = Buy alert
BEAR = Sell alert
DM if you have any questions!
inwCoin CDC ATR Trailing Stop Risk% StrategyATR Strategy base on CDC ATR Trailing stop นะครับ
ตัวนี้มี option ให้เลือกว่าจะใช้ stop ตาม ATR หรืออยากจะ stop แบบแท่งเทียนย้อนหลัง
ลองเล่นๆ ดูครับ

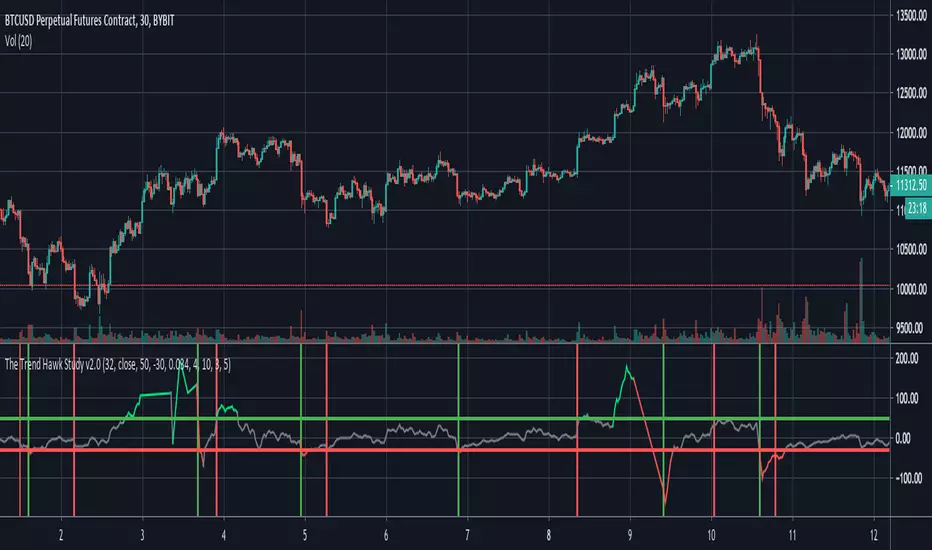
The Trend Hawk Study v2.0Study Version of the TrendHawk Strategy based on Commodity Channel Index(CCI). Comes with built-in alerts and stop loss.