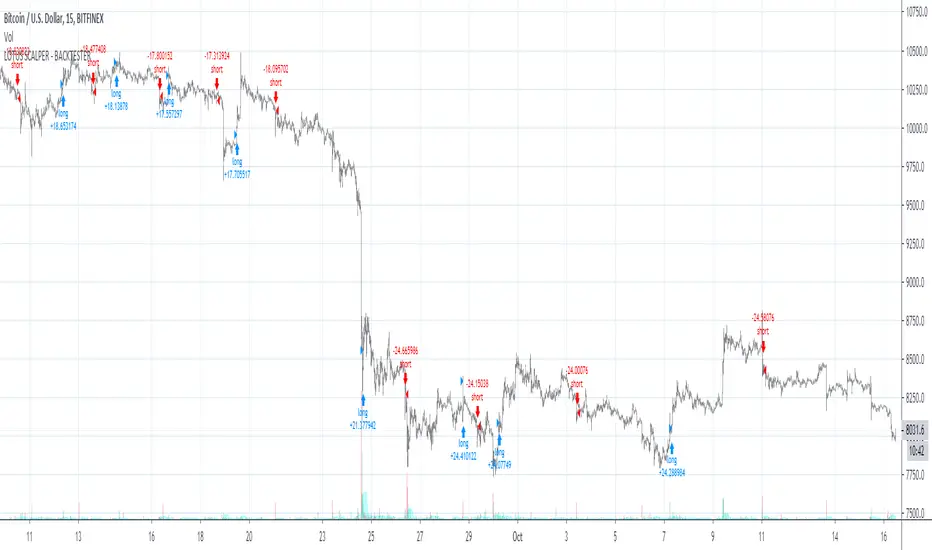
Express - Strategy TesterWelcome to the Express - Strategy Tester.
This indicator is used for back-testing. Once you have found settings that you like, you can use my other published indicator "Express" to set alerts.
How to use: Apply to any chart, on any time frame. You will see LONG and SHORT signals on the chart. A LONG signal represents an entry/buy in, and a SHORT signal represents an exit/sell.
You can use the Express - Strategy Tester to scalp on low time frames such as the 5m, 15m, 30m etc. Or use it on higher time frames such as the 1hr, 2hr, 4hr.
You can use regular candles but Heikin Ashi are recommended for better accuracy.
When using Heikin Ashi, I have included a real price line which shows the actual price of the asset/chart at the close of each candle.
You cannot set alerts with this indicator!
1-BTCUSD

Support / Resistance TradingDo not worry about drawing the correct support and resistance lines across any time frame. You can enter a long or short position on a major / minor line break out. Feel free to use my script.
Red & Orange - Major and Minor resistance lines.
Lime & Aqua - Major and Minor support lines.
For source code and more info, tip my BTC Jar: 1JddaKpkW4W1UmEuyK9oDUJLA46r1UK2aH

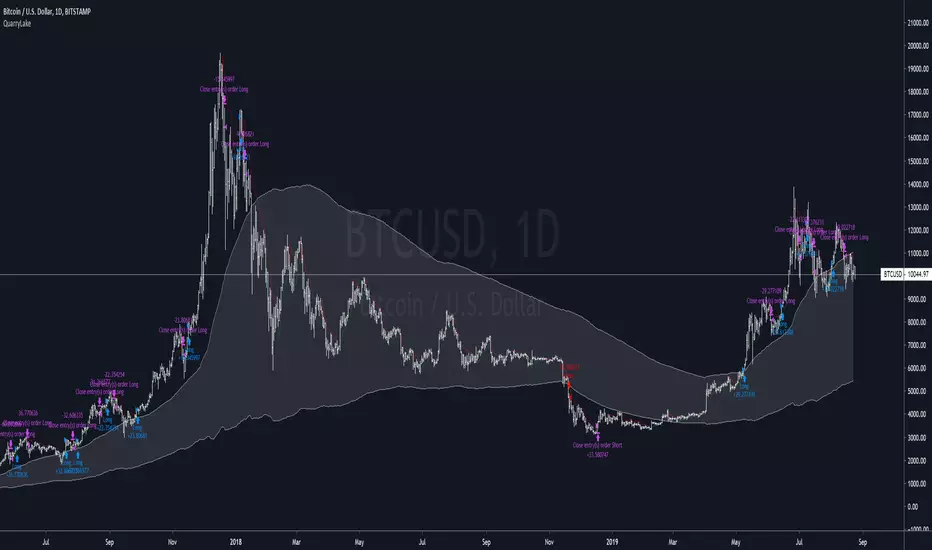
QuarryLake - An ATR base strategyThis strategy consists of 3 indicators that I found works quite well together.
Keltner Channel, Waddah Attah Explosion, and Volatility Stop.
You can find WAE here
KC Period = 200
KCATR = 5
Vstop Period = 3
Vstop Mult = 1.5
Long when close > KC, close > Vstop, WAE trendUp
Short when close < KC, close < Vstop, WAE trendDown
Works well on BTCUSD XBTUSD, as well as other major liquid Pair.
This strategy utilized a modified Kelly position sizing for BTCUSD Bitstamp, feel free to modify it to your needs.
More information can be found here dqydj.com
Feel free to follow me on Twitter @Lancelot_Auger for more free Alpha.
MACD Builder ProOur newest indicator, the MACD Builder Pro, gives traders the ability to build a MACD based on 7 different kinds of moving averages. The options include:
1.Standard MACD (EMA)
2.Hull Moving Average MACD
3.Volume Weighted MACD (VWMA)
4.Arnaud Legoux MACD (ALMA)
5.Double EMA MACD
6.MACD based on median
7. Simple Moving Average (SMA) MACD
Additionally, we've included countless plotting options for users to choose from. Users can choose to plot either the MACD or MACD Histogram in addition to the signal line. There is also an option to have the entry and exit signals displayed as green(entry) and red(exit) triangles for the entry and exit signals or red and green vertical highlight lines.
We've also provided the ability to fully customize the entry and exit conditions for the indicators trading logic. As mentioned, we've included over 7 different types of MACD indicators. But, we also included the ability to customize the lengths of the fast and slow Moving Averages used in the MACD calculation, as well as the length of the signal line. For entry conditions, the different options are:
1. MACD Histogram Above/Below Zero- Entry signals are generated when MACD Histogram crosses above the zero line into positive territory and exit signals come when the MACD Histogram crosses under the zero line into negative territory.
2. MACD Histogram Rising/Falling - Entry signals are generated when MACD Histogram first begins rising and exits when MACD Histogram first starts decreasing.
3. MACD Above/Below Zero - Entry signals are generated when MACD crosses above the zero line into positive territory and exit signals come when the MACD crosses under the zero line into negative territory.
4. MACD Rising/Falling - Entry signals are generated when MACD first begins rising and exits when MACD first starts decreasing.
As always, this script comes with pre-set alerts and we will be offering 3 day trials to anyone interested!
To check out more of our indicators head on over to our website : profitprogrammers.com

Dompeet Pompeet (Breakout bot)Dompeet Pompeet is my first attempt at a viable swingtrading algo.
It uses volatility and some trend analysis to enter trade when the market is about to breakout or break down. Having a trailing stop locks in profits and prevents runaway losses for low drawdown and 2:1 profit factor.
Settings to use:
BTCUSD or XBTUSD
4hr Timeframe or 2hr or 1hr (not shorter)
Bars window: 13, 16 or 20 bars
Moving average settings: 100/10 EMA to confirm trend
Trade the Trend - check on to only take trades long in a confirmed uptrend (vice versa short), otherwise it will attempt to buy and sell counter trend, which increases profits but also increases loss rate.
Trailing stop, values from 2-5% give the best results.
Take with a pinch of salt, there are some bugs in pine script which are difficult to track down but overall I'm pleased with the idea.

ExpressHow to use this indicator: This is an all-around indicator that is capable of being used on any chart. From 5m time frames up to 1 Day time frames.
There are BULL/BEAR signals which represent BUY/SELLS. You can set alerts with this indicator as well.
No back tester is currently provided with the Express.

MA-MTF-ALERT// Alerts based on SMA strategy
// Time frame 5M, 10M, 15M
// Created and based on Binance chart
// Working with comission
// No repaints
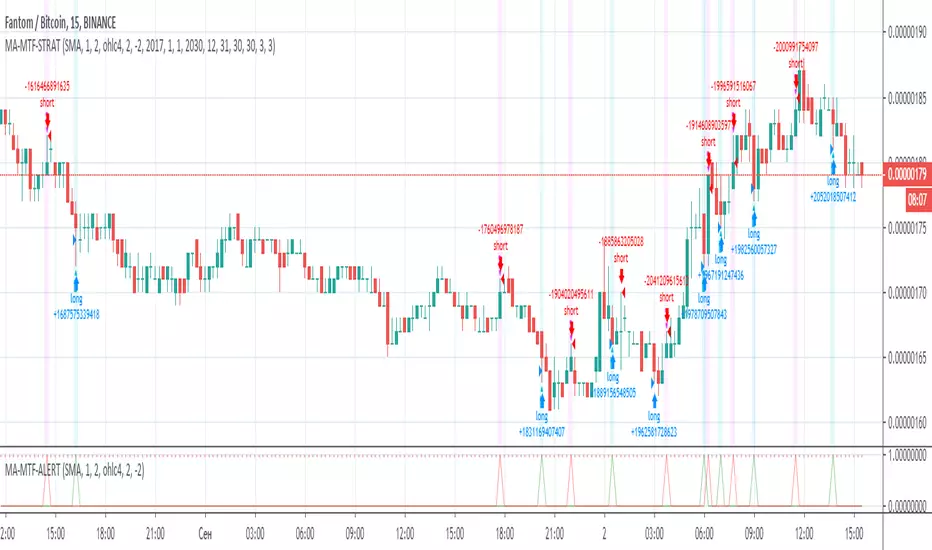
MA-MTF-STRAT// Strategy based on SMA
// Time frame 5M, 10M, 15M
// Created and based on Binance chart
// Working with comission
// No repaints

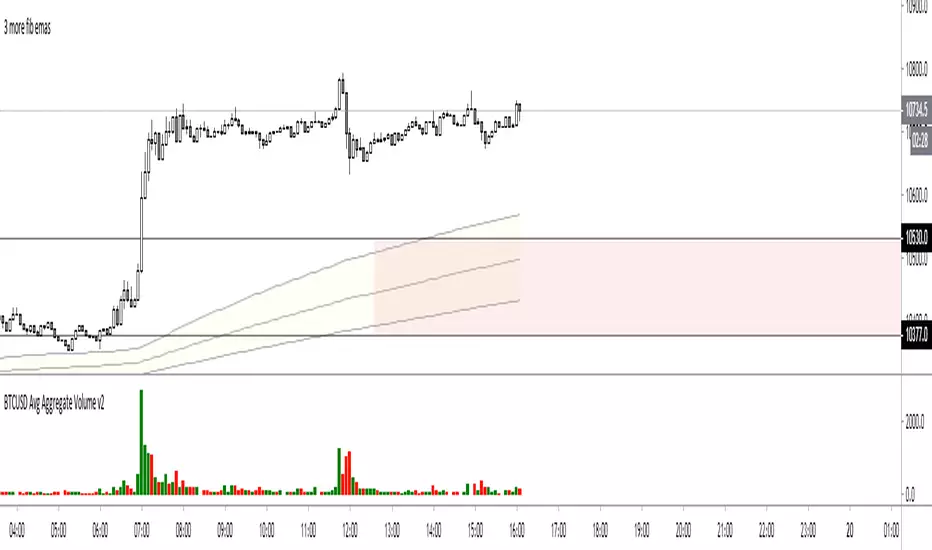
BTCUSD Avg Aggregate VolumeSimple script which gives an average volume for an aggregate of legit spot btcusd(t) exchange pairs based on user-selected period. Also including mex btc perp in there.
Includes:
Coinbase BTCUSD
Bitstamp BTCUSD
Bitfinex BTCUSD
Bitflyer BTCJPY
Binance BTCUSDT
Huobi BTCUSD
Bitmex XBTUSD
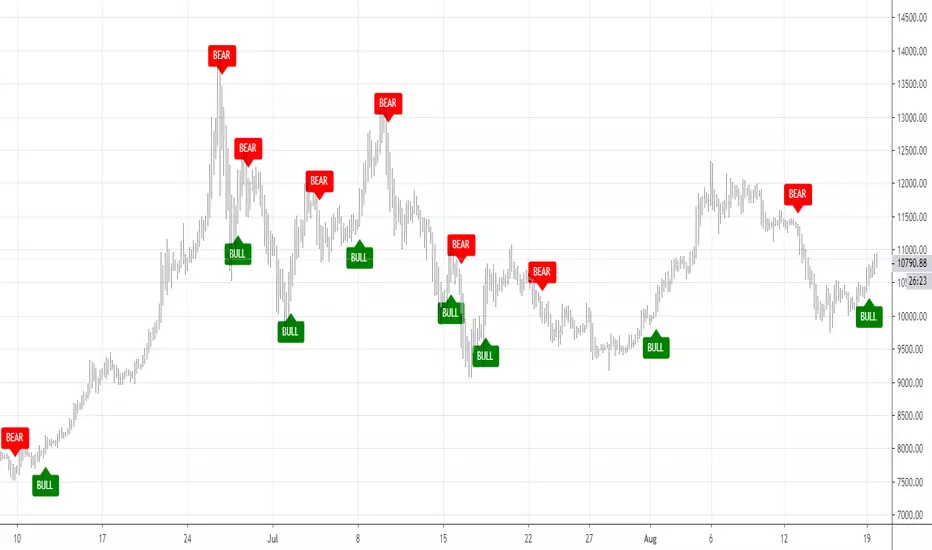
Classic MaverickWelcome to the Classic Maverick.
How to use: Apply to any chart, on any time frame. You will see BULL and BEAR signals on the chart. A BULL signal represents an entry/buy in, and a BEAR represents an exit/ sell.
You can use the Maverick to scalp on low time frames such as the 5m, 15m, 30m etc. Or use the Maverick on higher time frames such as the 1hr, 2hr, 4hr.
You can use regular candles but Heikin Ashi are recommended for better accuracy.
Settings alerts: You can easily set buy/sell alerts by selecting Maverick in the set alerts tab and selecting BULL for buy alerts and BEAR for sell alerts.

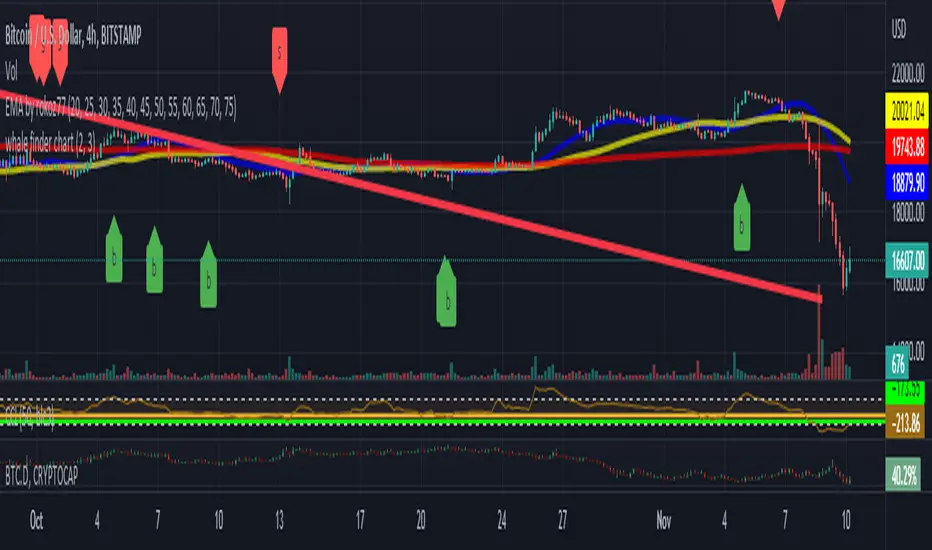
whale finder work very good on BTC 4hour chart
detect the hidden moves in the chart
it give a sell and buy signals and put it on the chart
do not get last candle signal till it close
JackTrendChaser V3Hi everyone! I am so thrilled to announce this!
>> LIMITED TIME OFFER, read below! <<
My name is Jack and I have been trading trends using TA on Forex for 10 years now and have within the past two years been trading Bitcoin and other cryptocurrencies.
I am a part time trader and developer. On a daily basis I work as a software developer creating various algorythms for big data usage - such as machine learning etc. and I have found a passion in creating scripts to predict major trend moves. Which is why I would like to share this script (strategy) with you all!
Looking at the stats it looks amazing! 100% profitability - who doesn't want that?! But that doesn't mean it cannot be improved - I am daily looking into how I can improve this to become even more profitable.
Currently the script have been tested with BTC and ETH:
BTC = 100% profitability and 9 trades since 2016
ETH = 83% profitability and 6 trades since 2016 with a drawdown of $5.
Now - 9 and 6 trades since 2016 isn't many trades but it suites my way of trading perfectly! I aim for the major trends and try to hit the pullbacks as soon as possible.
You can use this script alone or with other complimenting indicators. I like to draw some support and resistance levels for even further verification.
TRIAL OFFER:
Everyone is offered a 15 days trail.
Let me know in the comments if you would like a trail. Please do not PM me for trails.
>> LIMITED TIME OFFER <<
Since this is my first script to publish on TradingView I am offering the FIRST 10 traders a LIFETIME access to the script for a very small price! After that everyone else will be able to buy acces for 1m, 6m, 1y or lifetime (but at a higher price).
So how do you become one of the first 10?! Simpel - just PM me for the details.
I will update this post when the first 10 has been chosen.
>> OBS: I might be away from TradingView up to 24hours at a time because of my job - but don't panic! I will keep track of every message and get back to everyone as soon as possible!
Best regards
Jack

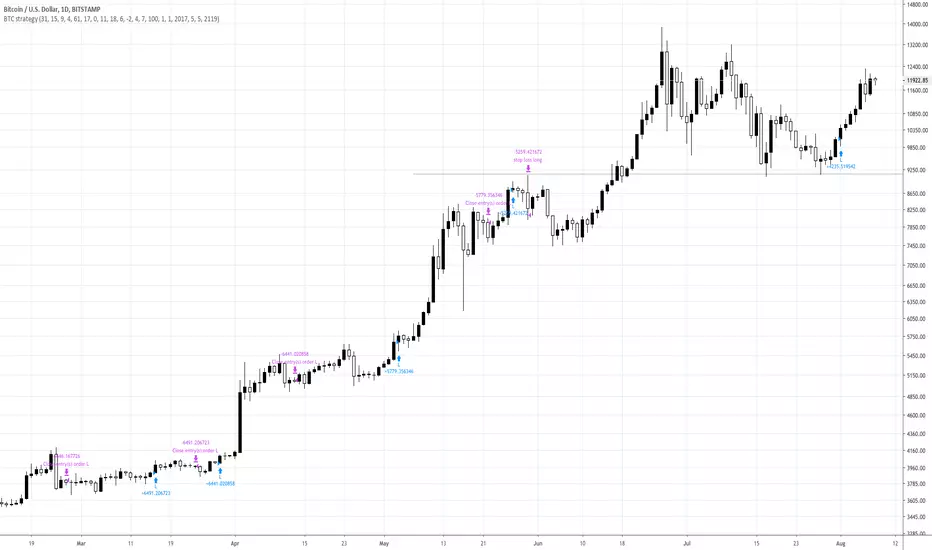
Maverick - Strategy TesterWelcome to the Maverick - Strategy Tester.
This indicator is used for back-testing. Once you have found settings that you like, you can use my other published indicator "Maverick" to set alerts.
How to use: Apply to any chart, on any time frame. You will see LONG and SHORT signals on the chart. A LONG signal represents an entry/buy in, and a SHORT signal represents an exit/sell.
You can use the Maverick - Strategy Tester to scalp on low time frames such as the 5m, 15m, 30m etc. Or use it on higher time frames such as the 1hr, 2hr, 4hr.
You can use regular candles but Heikin Ashi are recommended for better accuracy.
When using Heikin Ashi, I have included a real price line which shows the actual price of the asset/chart at the close of each candle.
You cannot set alerts with this indicator!
WBCC Scalp StrategyИндикатор для Scalp сделок, использовать рекомендуется исключительно на временных интервалах от 1 часа и ниже.

WBCC Main TrendИспользуется для определения движения основного тренда (Long/Short), а так же успешно может быть применен и на более маленьких временных интервалах.
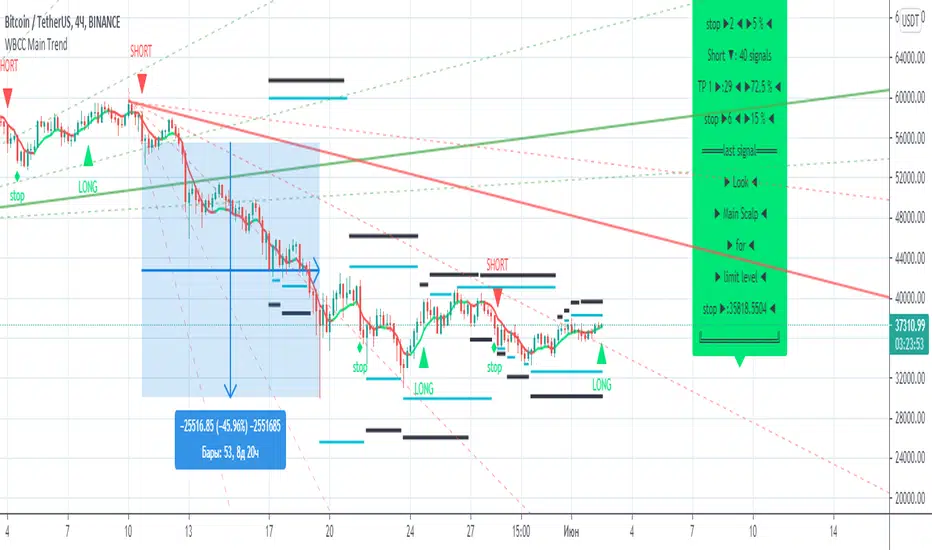
WBCC Level StrategyКраткое описание настройки:
Trend Period - количество свечей для расчета тренда.
WBCC_Level - уровень влияет на быстроту сигнала, чем меньше уровень тем быстрее сигнал появится, чем выше уровень тем меньше ложных сигналов и стабильней входы в Long и Short (рекомендованные параметры - 0.45-0.65)
Рекомендованное использование на Time Frame графика от 1 часа и выше.

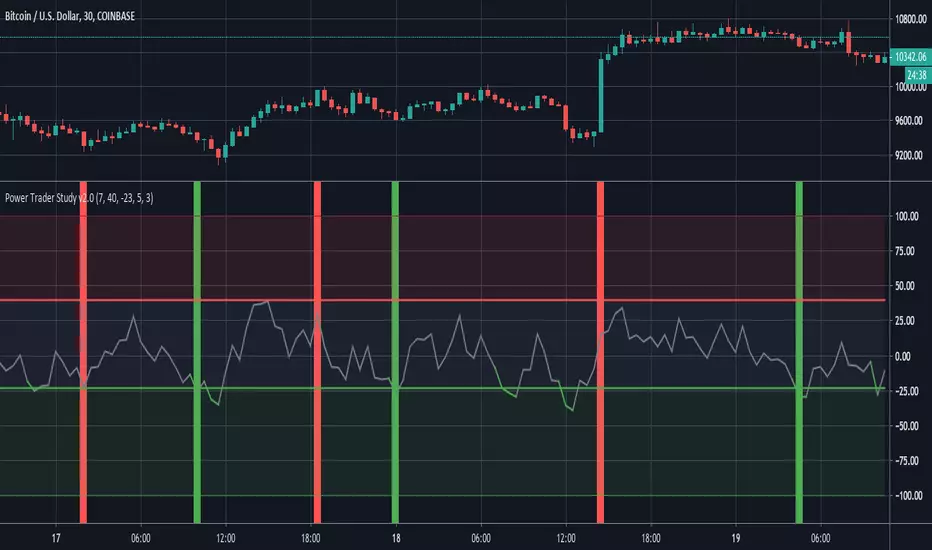
Power Trader Study The Power Trader is an indicator based around the Balance of Power Oscillator. Balance of Power is a price-based measurement that evaluates and compares the strength of buyers and sellers by assessing their respective abilities to push prices to extreme points(both extreme highs and extreme lows).
BoP values fluctuate between a maximum value of 100 and a minimum value of -100. When the BoP value is greater than 0, it indicates that buying pressure is greater than selling pressure. Conversely, negative BoP readings mean that selling pressure is greater than buying pressure.
The exponential moving average of Balance of Power values is displayed as a gray line on the chart. The upper red line represents the upper bound at which a security is considered overbought. The lower green line represents the threshold where we start to consider a security to be in an oversold state.
When the gray BoP EMA line crosses below the lower green line, it changes color to green then changes back to gray once it crosses back above that lower threshold. Similarly, the line turns red when it crosses above the upper red line.
When the EMA line is between the upper and lower bounds, it signifies that there is no significant difference between the power of buyers versus the power of sellers. The top red area indicates that the amount of buying pressure is relatively high. The lower green area means that selling pressure is abnormally high.
When the BoP line falls between the red and green areas, do not take action. When the BoP line turns green and is inside the green area, enter a long position. When the BoP line rises above the red line and into the upper red area, exit the long position.
Entry signals are displayed as vertical green lines that extend the length of the chart. Exit signals are represented by the same lines, except in red.
Users can decide the order of signals in the input option menu through the ‘allow repeat signals’ parameter. If this is set to false, the study will generate signals in the logical chronologic order of . If it is set to true, then signals will be generated as they come, regardless of whether the last signal was its inverse. This means that it could generate sequences like this for example .
Additionally, the stop and limit can also be set in the input menu through the ‘stop’ and ‘limit’ options. This input option accepts parameters of type float (ie: numbers that contain decimals).
The 'Upper Bound for BoP Values' and 'Lower Bound for BoP Values' input options gives traders the option to adjust the upper and lower thresholds for buy and sell signals. It is important to note that setting the upper bound higher or the lower bound lower will result in less frequent signals (and vice versa).
When it is time to enter a long position, an alert with the following message is sent “Power Trader - High Sell Pressure, Enter Long”.
When it is time to exit a long position, an alert with the following message is sent “Power Trader - High Buy Pressure, Exit Long”.
The Power Trader, along with all of our other invite-only scripts, can be found on our website:
profitprogrammers.com
Double RSI StudyHere is the study version of our recent Double RSI strategy based on a Hull RSI and ALMA RSI.
The study version includes alerts for signals generated by both RSI's. It also includes an option to allow repeat signals, as well as tons of plotting options, etc.
If interested in a 3 day trial, feel free to send a message and check out our website ProfitProgrammers.com !

Double RSI Strategy(ALMA RSI + Hull RSI)We're back at it with a brand new strategy centered around an Arnaud Legoux RSI and Hull RSI. This one took a lot longer to make than usual, which is the reason there hasn't been any new posts the last week.
The first component of the strategy is the Hull RSI. The Hull RSI is shown in light blue and its upper and lower bounds are plotted as the dark pink and teal horizontal lines. Applying a Hull Moving Average to the RSI results in higher smoothness and less false signals. The lengths of the RSI and the HMA of the RSI can both be adjusted by the user.
We then used a similar process to calculate an Arnaud Legoux Moving Average(ALMA) of the RSI. The ALMA RSI is shown as the solid white line, while its upper and lower thresholds are the green and red horizontal lines. The ALMA RSI is a great tool since it is adaptable for multiple different uses - users can adjust the offset, sigma, and length values to modify the RSI's responsiveness and smoothness.
Input Options for ALMA RSI:
-Offset : Value in range {0,1} that adjusts the curve of the Gaussian Distribution. A higher value will result in higher responsiveness but lower smoothness. A lower value will mean higher smoothness but less responsiveness.
-Length : The lookback for each ALMA calculation.
-Sigma : Defines the sharpe of the curve coefficients.
The entry and exit signals generated by the Hull RSI are represented by the small green(buy) and red(sell) circles, while the green and red vertical highlights are the ALMA RSI's buy and sell signals. By default, we set the pyramiding to 3, with 50% equity used in each trade to allow the ALMA to make the longer-term swing trades and higher frequency trades made with the Hull RSI.
The strategy will be posted on our website, ProfitProgrammers.com, soon. As always, we will be offering 3 day trials for this strategy so feel free to send a quick message to start the trial period!

Filtered Waves [NXT2017] #Linda Raschke #basics on Arthur MerrilHI BIG PLAYERS,
this script I wrote for an enquiry of a tradingview-user. It should represent the Filtered Waves idea from Arthur Merril and used by Linda Raschke.
It's similar like a visualization of Elliott Waves.
On YouTube title "MTA UK Chapter Presentation with Linda Raschke" between 34-36 minutes Linda Raschke shows the rules for her Filterd Waves.
Any questions? Ask me!
King regards
NXT2017
========
TO MY PERSON
I'm the second winner of the official German Forex Trading Competition in 2018.
Look here to the ranks:
deutsche-trading-meisterschaften.de
I speak german, english and russian.
My strength in trading are Wolfe Wave pattern.

Cruzamento de MM para BTC 5MSão 3 médias móveis simples.
- 9 períodos
- 21 períodos
-105 períodos
A intenção desse estudo é me dar sinais para compra quando ocorre um cruzamento da média de 9 períodos com a de 21, somente dando o sinal se o cruzamento ocorrer acima da média de 105 períodos. Para sinais de venda segue-se o mesmo raciocínio, quando a média de 9 períodos cruzar com a de 21 e estiver nesse caso abaixo da média de 105 períodos.
O que eu tenho usado e tem dado bons resultados com o BTC 5M desde o início de julho, principalmente naquelas bart formations, é utilizar apenas o primeiro sinal de venda ou de compra após o cruzamento da média de 105
O sinal que se dá para compra seria o círculo verde
O sinal que se dá para vendas seria o círculo vermelho
Este indicador tem o propósito de eu testar a efetividade de um sistema desses.