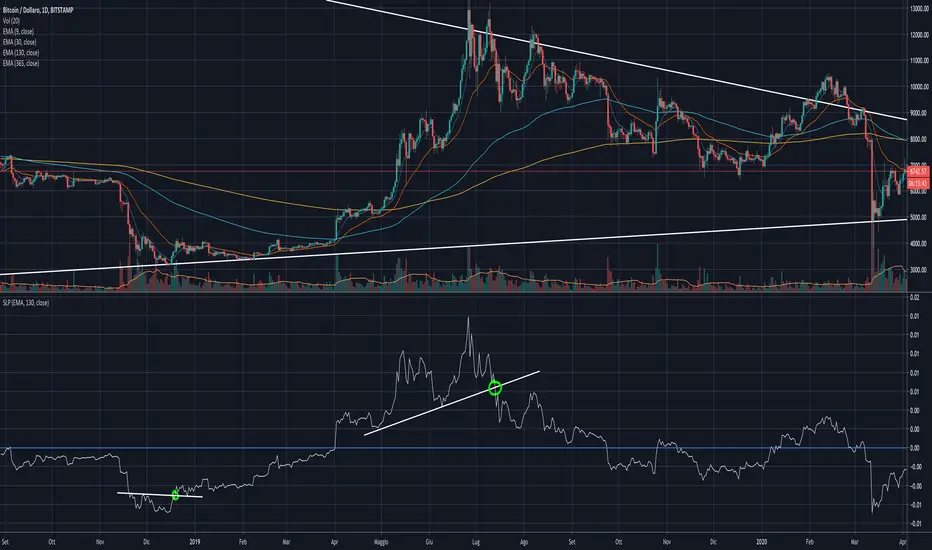
Moving Average SlopeA simple calculation and plotting of the slope of a Moving Average.
You'll be amazed looking at how accurate it is signaling early entries and exits from trend follower positions, just by applying some basic TA to it (support, resistance, trend lines).
Have a look:
In the settings, you can choose to use it on EMA on SMA, and the length of the MA involved.
I recommend using it on a medium-long sampling MA, to minimize noise.
Average
Fancy Triple Moving Averages [BigBitsIO]This script is for three moving averages with as many features as I can possibly fit into a single moving average.
Features:
- Three moving averages (MA1, MA2, MA3).
- Standard MA inputs.
- MA type.
- MA period.
- MA price.
- MA resolution (time frame).
- Visibility toggle.
- MA Candle Type
- Fancy MA inputs.
- Toggle to show only candles included in the MA calculation ("Highlight inclusion") or display entire MA history.
- Toggle to show a ghost trail when Highlight inclusion is toggled on. Displays a shaded version of past MA history before the inclusion period (as seen on snapshot).
- Toggle to show forecast values for the MA.
- Other inputs related to forecasting:
- Forecast bias. (Neutral forecasts MA if the current price remains the same.)
- Forecast period.
- Forecast magnitude.
*** DISCLAIMER: For educational and entertainment purposes only. Nothing in this content should be interpreted as financial advice or a recommendation to buy or sell any sort of security or investment including all types of crypto. DYOR, TYOB. ***

Smooth HA / Hull MA / MTF===========
Smooth HA / Hull MA / MTF
===========
A combination of a Smoothed Heikin Ashi Chart Line and a Hull MA Line, paints a "Long" or "Short" alert when the Hull MA changes color - editable settings for the smoothing of HA data and Hull MA Length; you can also change the time frame used (must be the same or longer as the chart).
-----------
This indicator does a real good job at finding highs and lows (otherwise known as entry and exit points!) picking up on just about every large, decent swing and making the most from those big moves! The disadvantage of all Smoothed HA strategies are when times are choppy or ranging - given the natural lag of the indicator you can be sure in choppy times you'd be buying at the top and selling at the bottom almost every time ~ No indicator is perfect!
This Smooth HA/Hull MA indicator also has a built in MTF function (Multi-Time-Frame). This means you can be using a 1hr chart and set the indicator to a 4hr chart - generally any movements on a greater time frame will overcome any movements of the smaller time frame, so this is where you should be gathering data about which direction the market is moving - as always, follow the trend.
Hope (like always) this is of at least some use to some people.
Good Luck and Happy Trading!

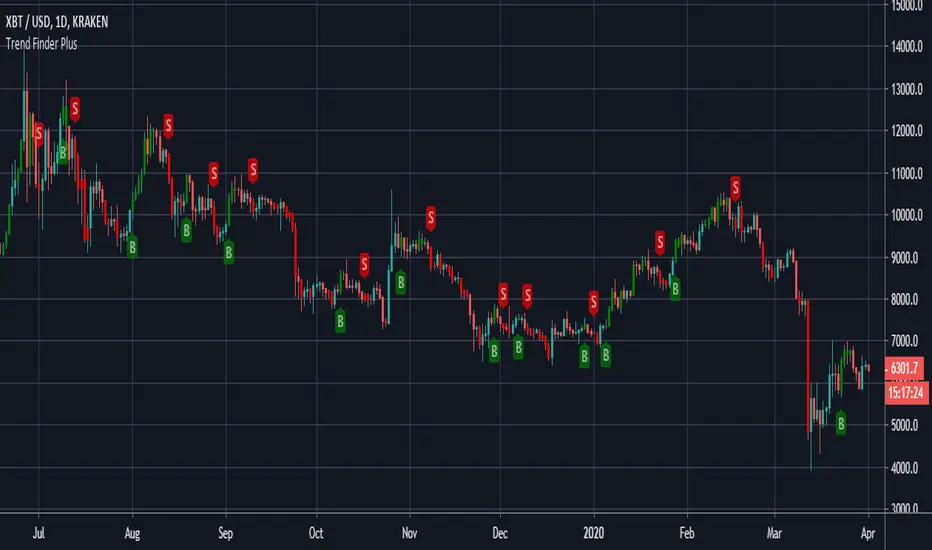
Trend Finder Plus - theCrypster===========
Trend Finder Plus
===========
A combination of various trend analysis techniques - MA's, pivotal breakouts, and Stochastics - Combined to make one super handy indicator!
-----------
Editable settings include a custom "Trend Finder" length and the usual settings for utilizing a "Stochastic RSI" .
This is a really useful tool for catching the very start of potentially bigger swings and movements - but it can get easily and display false signals during choppy periods - use with other indicators for a true sense of what can be achieved with this.
Good Luck and Happy Trading!
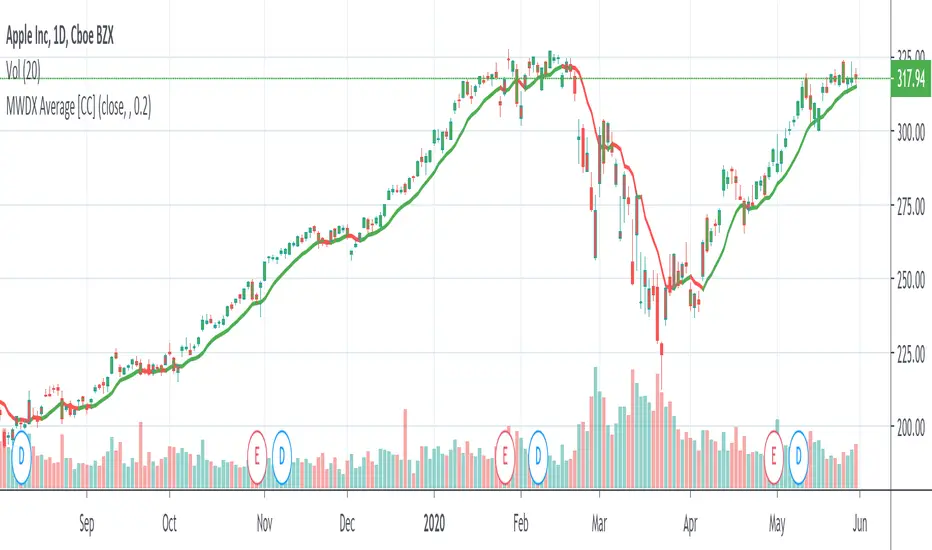
MWDX AverageThis is a variation of an exponential moving average which follows the price pretty smoothly. Feel free to change the factor to adjust how closely it follows the price. I set the default to 0.2
Let me know if you want me to write code for any other indicators!
Superstock 10-30 WMA Band script I was reading Jesse Stine's Insider Buy Superstocks book, and one of the technical traits he mentioned of a superstock (read the book, seriously, very strongly recommended) was a breakout above the 30 weekly moving average. He goes on to mention that after breakout, the 10 WMA often acts as a support line where you can add to your position. This script is inspired by the visual direction of Chris Moody's slingshot system, and how it displays MA's. The skinny line is the 10 WMA and the bigger line is the 30.

Running Average [EXPERIMENT]Predicting the future has nothing to do with trading, understanding your indicator and knowing how to use it does.
Probably not the most efficient code, oh well..
Let me know if it's useful :)

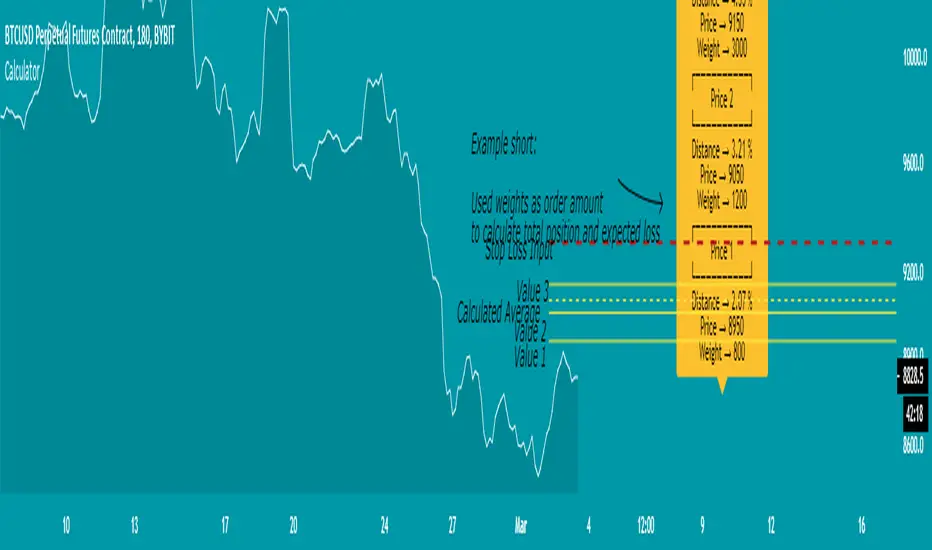
Weighted Average Calculator - evoTest version of a weighted average calculator, will make an update later with more functions and a better view.
For now it's mainly useful for getting an average value and see how you can ladder into your position,
if you use the weights as the amount you want to order, you can see the total value and expected loss in the label.
You can use the weights as percentage or any numbers you like, but expected loss won't apply to that for now (before update)
5 values and weights available
If you have ideas to add anything or find mistakes send me a message.
BnB Moving Average BacktestBacktest on the B&B Strategy with addition of Bolinger Bands variance for SL

Slow Heiken Ashi and Exponential Moving average Strategy 2.2Strategy using Slow Heiken Ashi by Glaz and Exponential moving averages. Looking for someone to help me turn the strategy into non-reoccuring alerts as I am having trouble doing so.
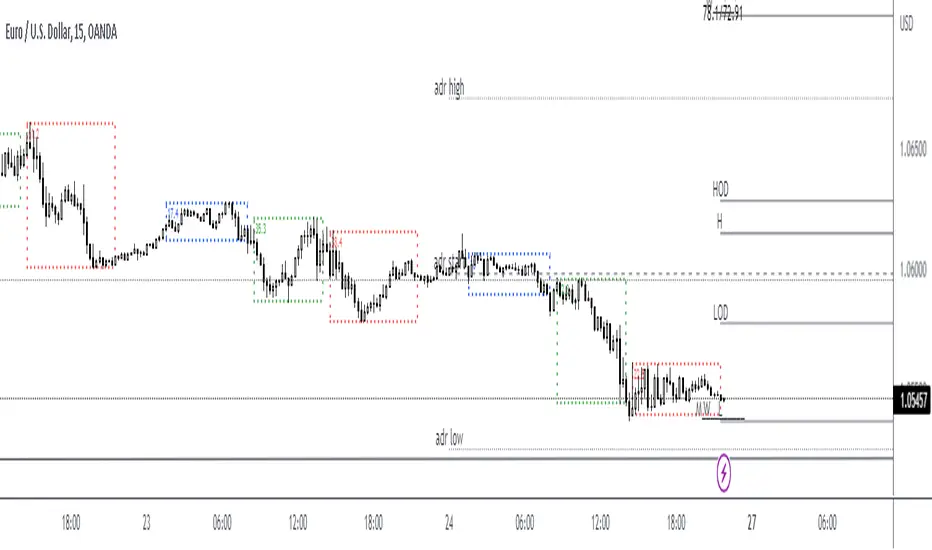
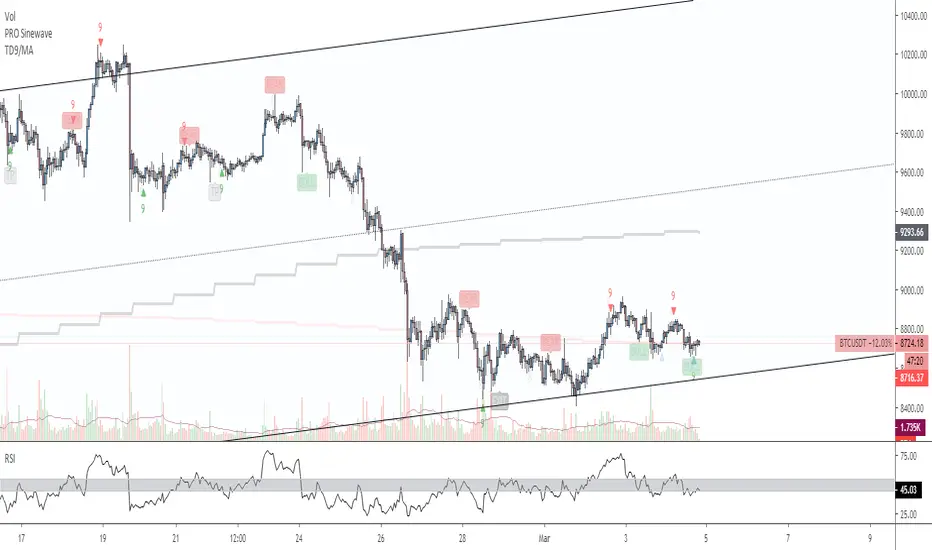
Sideways Money - Bitcoin BeatsHello, Hello, Hello,
And welcome back to Bitcoin Beats.
This is another version of my previous script, "Range Indicator - Bitcoin Beats".
Designed initially for breakouts but shows adaptive ranges and consolidation in XBTUSD(Haven't tested other assets but should do the same thing).
If we are consolidating (which is most of the time) a good strategy to trade would be to trade ranges. However, as soon as you spot the range it can feel like the range has changed so you lose out on making the monies.
This indicator plots out the average range in a consolidation.
It also shows you when the range has broken in a direction that it previously hasn't broken in. This essentially signifies the the trend changing and gives warning that trading the range may no longer be valid.
There are a few ways to trade this indicator and I will explain 2 of them here.
PLEASE TRADE AT YOUR OWN RISK. YOUR FUNDS ARE YOUR RESPONSIBILITY.
IF YOU TRADE WITH THESE STRATEGIES, YOU ARE TO BLAME FOR YOUR OWN LOSSES.
BY USING THIS INDICATOR YOU AGREE THAT I WILL NOT BE HELD LIABLE IN THE CASE OF YOU LOSING FUNDS.
Strategy 1:
- Have 2 bitmex accounts open.
- Use on the 30m, 1h, 3h or 12h.
- Long AND Short on both accounts when we hit the middle area. This is called the "Reload Zone".
- When we hit the edge of each side of the plotted range, close the positions in profit.
- You will then have 1 trade underwater.
- If the range is solid, the price will move back to the Reload Zone in which you reload you position that you took profit with.
- You then have both a Long AND Short open after 1 profitable trade.
- Rinse and repeat until you get the "STRATEGY CAUTION" message signifying that the range will most likely break soon.
Strategy 2(least profitable):
- When the "STRATEGY CAUTION" Message appears, you can long or short depending on which side it breaks toward.
- If we break down, short.
- If we break up, Long.
I wouldn't advise this second strategy if you are a beginner as the results are inconclusive and it's more of a hybrid trading strategy, meaning you have to know how to trade with price action flowing.
Usually if it is appearing volatile, you can go to a higher time frame and find the exact range it's catering to, adjusting your strategy accordingly.
See you soon,
Goodbye, from Bitcoin Beats.


Calculator (weighted) - evoA tool to calculate the average price and position size.
The "Risk Amount" input means the amount of dollars you lose if the trade gets stopped out (it should be based on a small percentage of your account).
TIPS
- If you use the weights to calculate an average price, make sure it adds up to 100% in total or you will get a weird number.
- Keep an eye on the risk amount if you take a trade, if I ever update the script it might set back to default which will change your position size.
- I tested it all but you might trade in a different way than me, so do your own calculation for every new thing you try with it.
If you find any bug please tell me so that no one ends up with a weird calculation or position size.

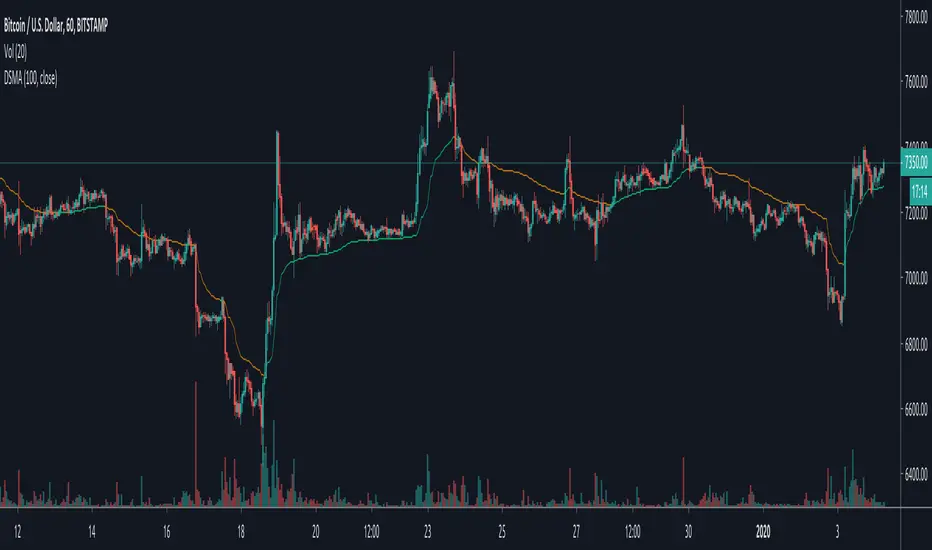
Deviation Scaled Moving Average [ChuckBanger]This is a deviation scaled moving average original designed by John Ehlers. It is a new adaptive moving average that has the ability to rapidly adapt to volatility in price movement with minimal lag. Because it is so smooth and adapts to the volatility of the market it is by far a really great tool for spotting trend changes
Exponential Least Squares Moving AverageModified LSMA (Least Squares Moving Average) to use exponential rates of growth instead of linear regression. Inputting a number into the confidence interval allows the user to have set percentage of statistical guarantee based on past movement. To set this percentage of guarantee (Default set to 97.5%), refer to the input values below:
0.000 = 50%
0.255 = 60%
0.525 = 70%
0.835 = 80%
1.040 = 85%
1.285 = 90%
1.645 = 95%
1.960 = 97.5%
2.330 = 99%

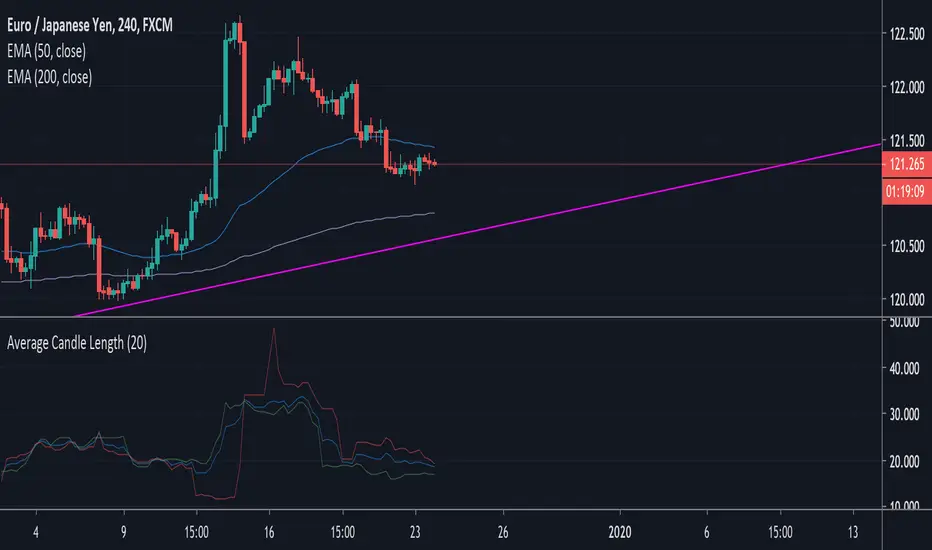
Average Candle Length 2.0This script will tell you the following:
• Average length of all the candles (wick to wick) for the last 20 candles
-- shown in blue
• Average length of bull (green) candles (wick to wick) for the last 20 candles
-- shown in green
• Average length of bear (red) candles (wick to wick) for the last 20 candles
-- shown in red
___________________________________________
Inputs:
• # of Candles to analyze (default = 20)
[VB]Chota Bulu Strategy by VivekChota Bulu Strategy is combination of moving averages,Bull/Bear Power Trend and Leading Oscillators
Strategy
Green Background
Strict Bullish Trend (Buy Favourable)
Buy Price Moves above or crosses above all moving averages
Above 200/800 EMA (Buy Sides Only)
Red background
Strict Bearish Trend (Sell OFF period)
Sell only if Price crosses below all moving averages.
Below 200/800 EMA (Sell Side Only)
Convergence Early Warning Indicators (Arrows for Price Momentum Change)
Trending Early Warning Triangles (Green Triangle Bottom means Start of Trending Market) (Red Triangle Top Means Start of Bearish Trending Market)
Moving averages can be changed to various types too.
Adjust Stop Loss and Target Points
Change Properties for Initial Capital and % of Equity or Contracts
Currency Traders need to change to Contracts

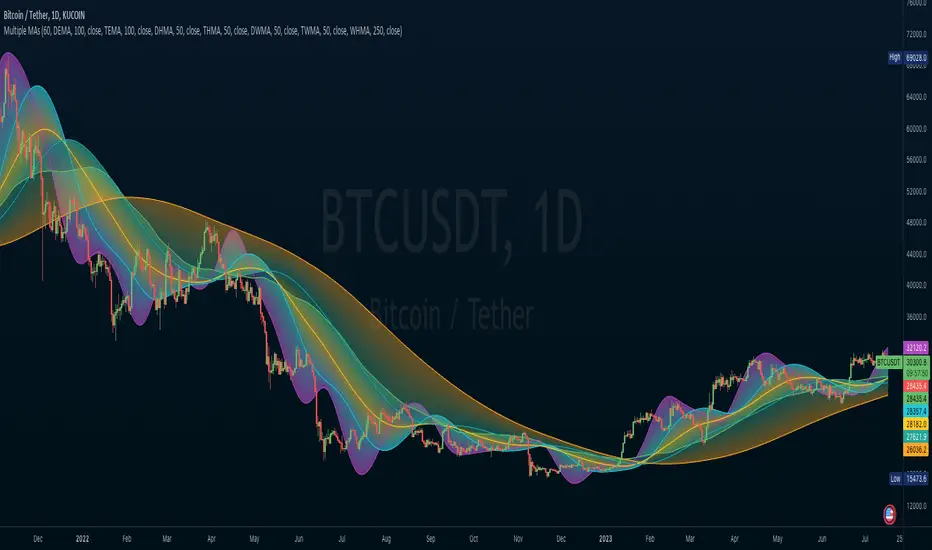
Multi Moving Averages @Hendo 4C (14 Types)A script containing 14 different types of Moving Averages, a total of 4 can be added per chart (allowing multiple Moving Averages under a smaller TradingView plan).
It also comes with: Adaptive coloring, settings for the source of calculations, customizable colors and lengths. Most importantly, as mentioned: 14 different types found below.
Simple Moving Average (SMA)
Exponential Moving Average (EMA)
Double Exponential Moving Average (DEMA)
Triple Exponential Moving Average (TEMA)
Running Moving Average (RMA)
Kaufman's Adaptive Moving Average (KAMA)
Hull's Moving Average (HMA)
Least Square Moving Average (LSMA)
Weighted Moving Average (WMA)
A. Legoux Moving Average (ALMA)
Volume Weighted Moving Average (VWMA)
Symetrically Weighted Moving Average (SWMA)
Smoothed Moving Average (SMMA)
Elastic Volume Weighted Moving Average (eVWMA)
The goal of creating this script was to allow people with a small TradingView subscription to have access to multiple Moving Averages. Of course it’s not unique in that use case, the thing that makes this script is unique is the fact that it comes with 14 different Moving Averages that can be selected independently. You want a RMA paired with 2 EMA’s and one HMA? Go ahead!
I’m open to add any requests that you guys might have. Feel free to ask so in the comments.
Check out my “Volatility Stop Loss Helper” too! And happy trading.
Last: I think it’s pretty clear to say that this was not “my idea” to build. But I found most of the similar scripts available pretty lacking in terms of settings and additions.
{{Settings overview}}
“Adaptive Colouring”: If enabled the Moving Average colours will be determined by their relation to price. If price is above the Moving Average it’s green, and red if price is below.
“Plot First MA”: Disable or enable the first moving average
“Moving Average Type 1”: The type of Moving Average that the first MA should be. 14 choices.
“Moving Average Length 1”: The length of the first Moving Average.
“Source of Calculation MA1”: The source that is used to calculate the Moving Average. Default is “Close”.
“Plot Second MA”: Enable if you want to use 2 Moving Averages
Settings are the same as described above. But then for the second MA.
“Plot Third MA”: Enable if you want to use 3 Moving Averages
Settings are the same as described above. But then for the third MA.
“Plot Fourth MA”: Enable if you want to use 4 Moving Averages
Settings are the same as described above. But then for the fourth MA.
It is recommended to click the little left arrow to hide your indicators in the top corner while using this indicator. Due to the length of the settings menu.
Settings can be added due to requests. Please check the update notes below:

Multiple MAsYou can set up to 5 moving averages (or more if you know how to edit the script), selecting from SMA, EMA, HMA, WMA, DEMA, TEMA or RMA. Select the source and the period for each MA.
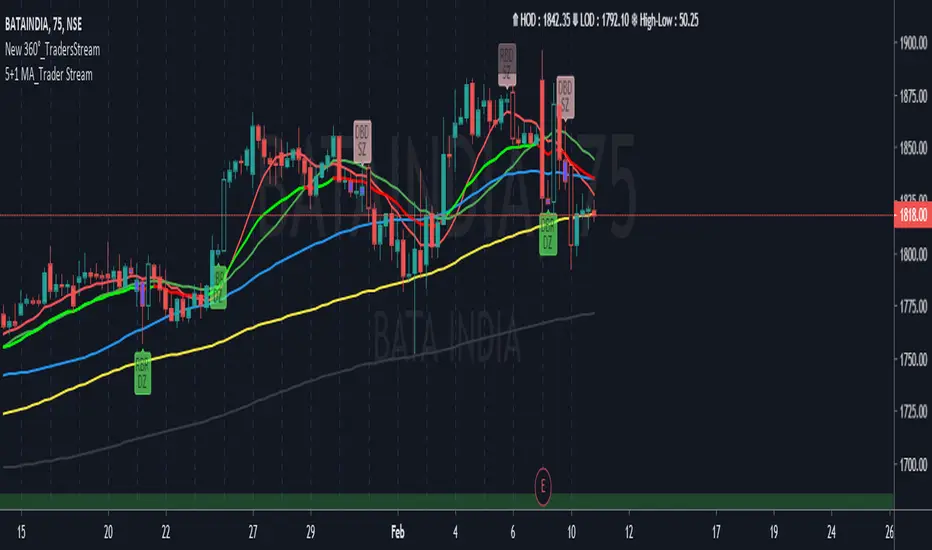
Moving Averages Traders StreamHello Guys this is a new set of Multiple Moving Averages with Bullish and Bearish coloured. Our Tool Includes SMA, EMA, RMA, VMA and VWMA. So if any comments than please.......
Average Daily Range Label by Theoris (ADR)This indy show Label of
* Last price
* Range of Low - High ( from Average daily range calculation )
* ADR (14 ) default period 14
* value of current range ( pip ) / Average daily range.
Example
now price is
1499.4
( 1486.959 - 1510.841 ) --- > This is range calculate from ADR for normal range.
ADR(14)
58/148.41
meaning use ADR period 14
today run 58 pips
from average 14 period is 148.41 pips
can change period to other normally I use 10 or 14
Timeframe to use default is Daily