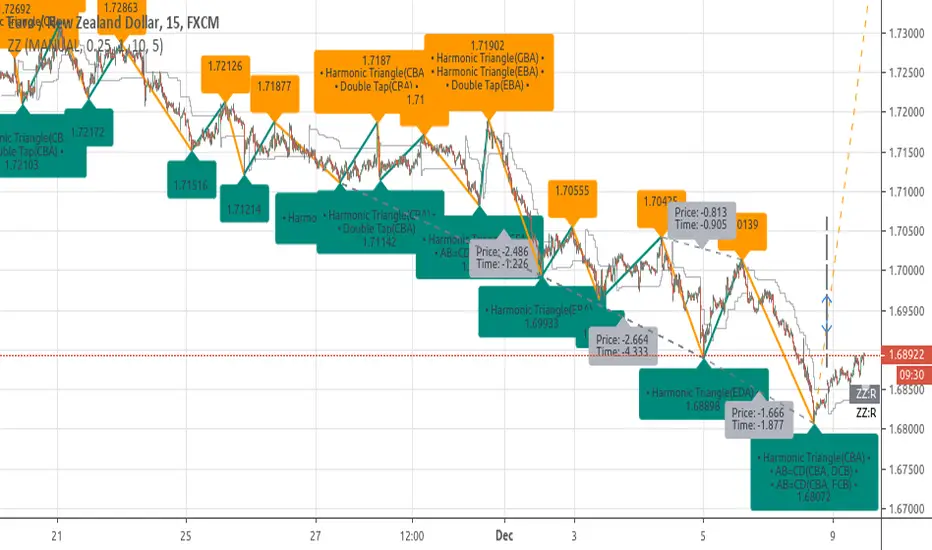
[RS]ZigZag Percent Reversal - Forecast - patterns - labels description:
• Zig Zag indicator plots points on the chart whenever prices reverse
by a percentage greater than a pre-chosen variable.
• Forecasts area based on zigzag statistics.
• Displays labels with detected patterns.
• Displays slope information rate of price, time diferentials and angle(experimental)
Average
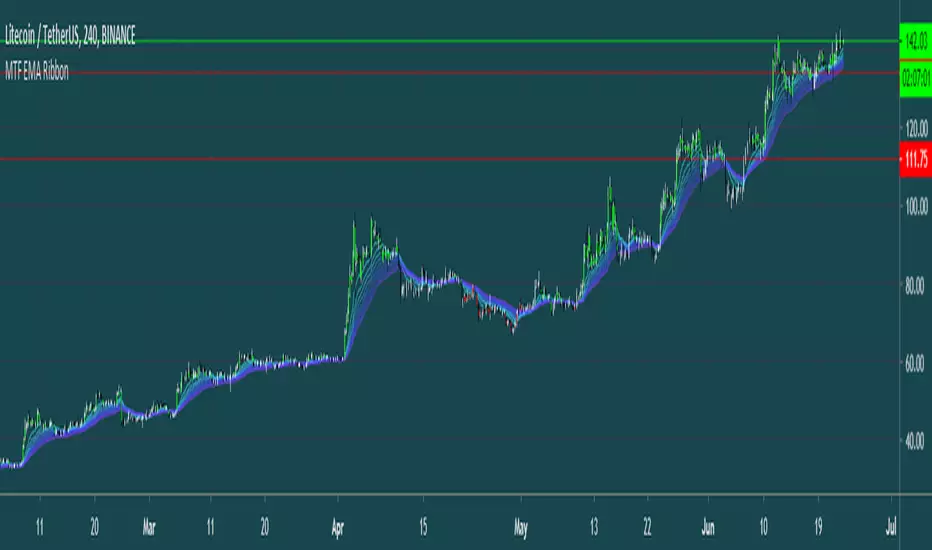
MTF EMA RibbonThis Script analyses trends using an EMA Ribbon (Can be adjusted to any timeframe).
tips are always welcome at: 38uGQJDDZDL6wX48x4gYTccPeQ3ZHVYmY4 (btc)
I hope you enjoy the script :)

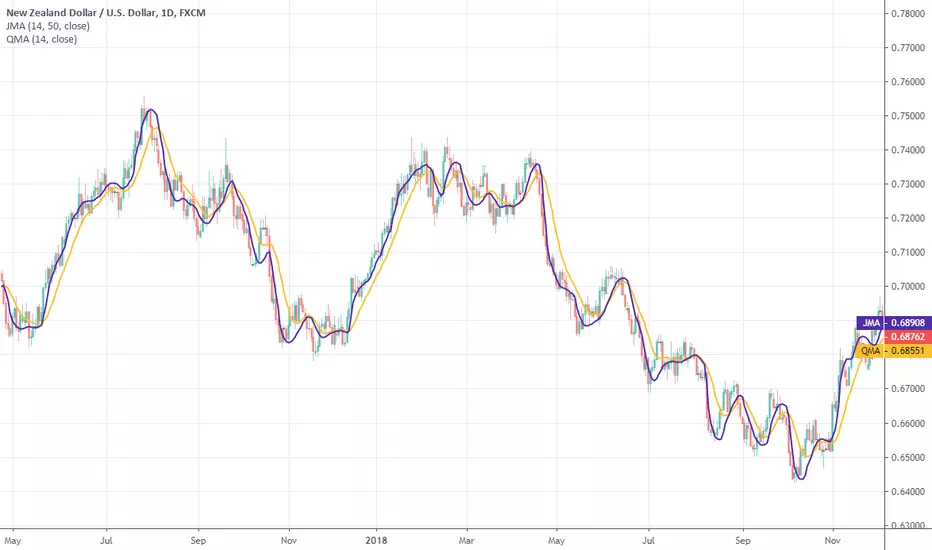
Quick Moving AverageThis moving average was originally developed by John McCormick in 2008 as NinjaTrader indicator. The purpose was to find a cheap replacement for JMA ( ).
Well, not impressive concerning the response.
Source code on request .

Ratio OCHL Averager - An Alternative to VWAPIntroduction
I had the idea to make this indicator thanks to @dpanday with the support of @Coppermine and @Reika. Vwap is a non parametric indicator based on volume used by lot of traders and institutions, its non parametric particularity makes it great because it don't need to go through parameter optimization. Today i present a similar indicator called Ratio OCHL Averager based on exponential averaging by using the ratio of open-close to high-low range by using monthly high/low.
The Indicator
The indicator can more recursive by checking the "recursive" option, this allow to use the indicator output instead of the open price for the calculation of the ratio of open-close to high-low range. The result is a more reactive estimation,
The indicator reactivity change based on the time frame you are in, using higher time frame result in a more reactive indicator, however it is way less reactive than the vwap, this is a personal choice since i wanted this indicator to be smooth even with high time frames, if you want to change that you use another resolution for H and L in line 5,6.
Conclusion
I presented an alternative to vwap based on the Ratio OCHL indicator. I hope you like it and thanks for reading !
Thanks to Coppermine and Reika for the support during the creation of the indicator

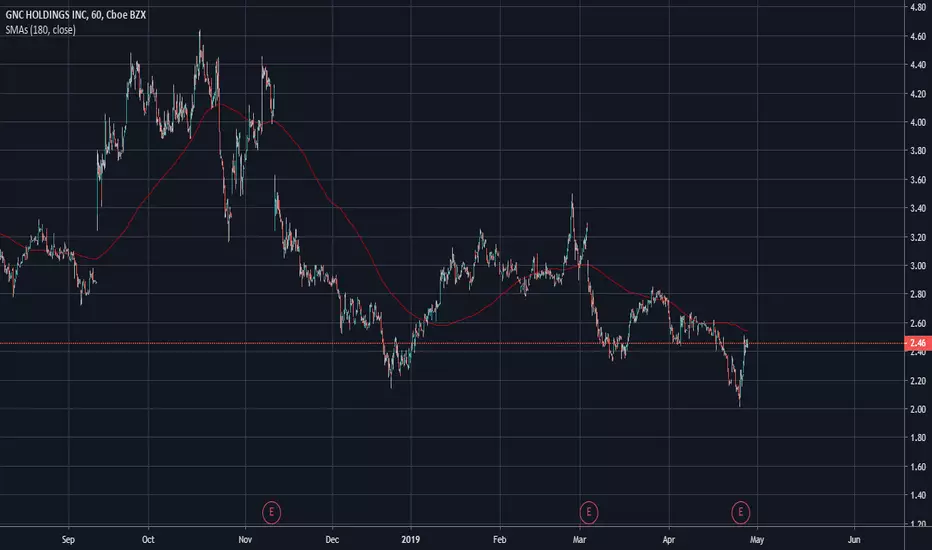
AVERAGE MULTI_SMAIndicator returns an average of 5 SMAs. an interesting point that I have noticed that the price has several times reacted on it.
Note 1: Do not just use this as a criterion for buying and selling, use as one more aid.
Note 2: It is possible to leave in the chart all the averages, if you feel it necessary.
------------------------------------//--------------------------------------------------
Indicador retorna uma média de 5 SMAs. um ponto interessante que tenho notado que o preço tem diversas vezes reagido nele.
Observação 1: Não use apenas isso como critério para compra e venda, use como mais um auxilio.
Observação 2: É possivel deixar no grafico todas as médias, caso você ache necessário.

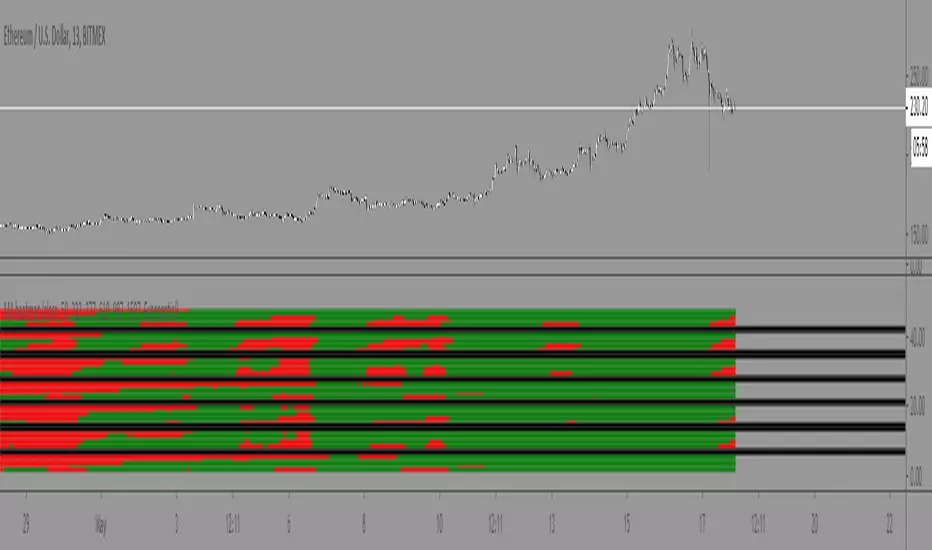
Moving Average Heatmap Visualization7 different types of moving averages (5 different lengths of each) compared to a base moving average. Base moving average can be configured to be a slew of different types of moving averages (credit to @mortdiggiddy for the code) and have a custom length.
Red = base moving average is over other moving average (bearish)
Green = base moving average is under other moving average (bullish)
lengths for the different MAs are just fibonacci numbers due to lack of creativity.
First 5 moving averages are Simple moving average the next 5 are Exponential moving averages and after that it is weighted moving averages, volume weighted moving average (VWAP), Exponential volume weighted moving average (thanks again @mortdiggiddy ), hull moving averages and lastly zero lag moving averages.
The indicator might lag your chart out a bit so be ready for that.
Have fun!
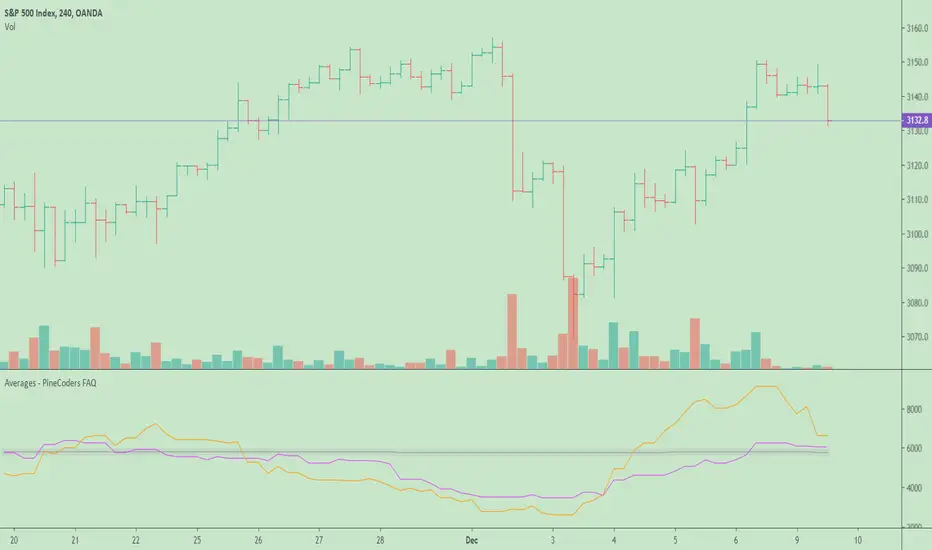
Averages - PineCoders FAQ█ WARNING
The publication of our ConditionalAverages library has deprecated this publication.
█ ORIGINAL DESCRIPTION
The need to calculate averages (arithmetic mean) comes up here and there in scripts. When you want the average of a value only when a given condition has occurred, you will often not be able to use the standard sma function in Pine because it will average all values in the series. Even if you take care to use your condition to set non-conforming values to zero, this ends up skewing your results with zero values.
This script calculates:
1. The running average of all up volumes,
2. The average of last x occurrences of up volume ,
3. The average up volume occurrences in last y bars.
Look first. Then leap.
Moving Average Trend IndicatorThis Indicator shows you the major moving averages, both in simple and exponential.


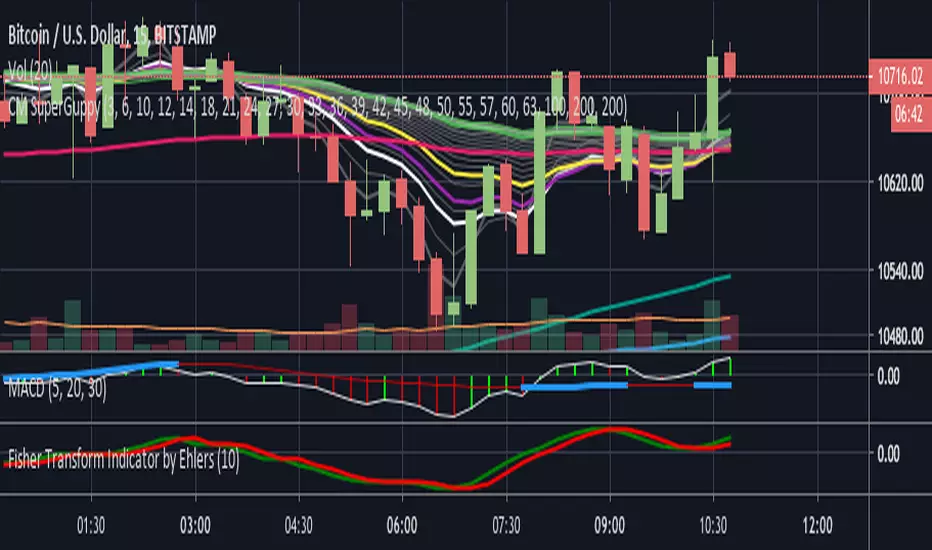
Volume+ (RVOL By Time of Day)This script is an enhanced volume indicator.
It calculates relative volume (RVOL) based on the average volume at that time of day (rather than using a moving average).
For example, using this indicator you can see today’s volume during the first 5-minute candle of the market open compared to the previous day’s volume at the market open. Or you can see today’s volume at the market close during the last 15-minute candle compared to the average of the past 20 days of volume at the market close.
Due to the different quantity of candlesticks in a session between Stocks and Forex/Crypto, I separated those markets into separate settings, making this an all-in-one volume indicator that works on all markets.
Settings:
Stocks
If you set the lookback period to 1 on the 5-minute chart and look at the 9:30am candle for a stock, then the current volume bar will show you what today’s volume is compared to yesterday’s 9:30am 5-minute candle.
If you set the lookback period to 15, then the current volume bar will show you what today’s volume is compared to the average of the last 15 days of 9:30am 5-minute candles.
Max Lookback: 64 Sessions
Stocks
This setting is for traders who want to use this indicator on a timeframe lower than the 5-minute chart.
Due to limitations in how many historical bars PineScript can reference, referencing 1-minute and 3-minute bars requires a lot more historical data so I separated the two to allow the 5-minute+ timeframes to have a longer lookback period.
Max Lookback: 12 Sessions
Forex/Crypto
When you set the script to Forex/Crypto, it does the same thing for stocks but calculates based on a 24-hour period.
So if you set the lookback period to 1 on the 1-hour chart and look at the 11:00am candle for a currency pair, then the current volume bar will show you what today’s volume is compared to yesterday’s 11:00am 1-hour candle.
If you set the lookback period to 10, then the current volume bar will show you what today’s volume is compared to the average of the last 10 days of 11:00am 1-hour candles.
Max Lookback: 17 Sessions
What Doesn’t It Work On?
Because I had to manually calculate how many volume candles to look back per timeframe to get the previous session’s candle, I had to hard-code the math in this script.
That means that this indicator will only work on 1m, 3m, 5m, 15m, 30m, 45m, 1h, 2h, 3h, 4h, Daily and Weekly timeframes. If you try to use it on any other timeframe it will revert to a regular volume indicator.
Why Is It Useful?
Similar to volume profile by price, this gives you a volume profile by time in a way that the default volume indicator does not.
For example, you can use this to determine when a stock has a particularly strong opening drive, or when a currency pair has a weak fake-out leading up to the London open, or for general confirmation on trading signals with time-specific volume information to work with.
Colors
The purple line and the faint gray bar is the RVOL value.
The blue number is the percentage of the current volume bar relative to RVOL.
There are four different bar color settings:
Heatmap – Changes color to be brighter based on higher RVOL
Price – Changes color based on price action (like the default TradingView volume indicator)
Traffic – Changes color based on RVOL percentages (for fast visual cues)
Trigger – Changes color only when the specified alert conditions are met
Heatmap:
Traffic:
Trigger:
Price:
Heatmap:
Turns very bright green at 2.0 RVOL
Turns light green at 1.0 RVOL
Turns normal green at 0.75 RVOL
Turns medium green at 0.5 RVOL
Turns very dark green at 0.25 RVOL
Is gray otherwise.
Price:
Turns red if the price action candle closed bearish.
Turns green if the price action candle closed bullish.
Traffic:
Turns red if RVOL is between 1.0 and 1.5.
Turns orange if RVOL is between 1.5 and 2.0.
Turns dark green if RVOL is between 2.0 and 3.0.
Turns bright green if RVOL is above 3.0.
Is gray otherwise.
Trigger:
Turns teal if any of the given alert conditions in the user settings are met.
Alerts
Alerts are optional. You have to set them like any other indicator, by creating a new alert and selecting this indicator.
If you leave the "Alert At RVOL %" setting at 0, then alerts will only be triggered if the current candle exceeds the 1.0 (100%) RVOL level.
If you change the "Alert At RVOL %" setting then alerts will be triggered if the RVOL percentage (blue number) exceeds your given value. The blue number is a percentage of the average, so if it’s at 0.5, then it’s 50% of the average.
Notes
- This indicator only works with regular time bars. It will not work with range, tick, renko etc.
- This script has lookback limitations due to restrictions on how many historical bars PineScript can reference. The lookback limit varies based on the market type you choose. The more bars required for calculation the lower the lookback limit.
- If you use it on the Daily timeframe the lookback period will count as 1 week. If you use it on the Weekly timeframe the lookback period will count as 1 month. So a Lookback of 3 on the Daily would be 3 weeks of averages, a Lookback of 5 on the Weekly would be 5 months of averages (for that Day of Week or Week number).
- Big thanks to @tb12345 for the idea and for helping to field-testing the indicator!

Flagging BandsIntroduction
A pun between the word flag and the adjective flagging (less dynamic) , this indicator have two bands who react faster when in contact to the price. Imagine you are under sheets, if you abruptly rise, the sheets will instantaneously go up, then if you abruptly get down, the sheets will fall slowly until being in contact with a surface, this is because of a type of friction called drag or air resistance , this force is described in fluid dynamics and i inspired myself from that for the creation of the indicator.
The indicator
The indicator is made of two bands, one upper band and one lower band, then a weighted average of each bands, this average is weighted depending on which band the price is closer. The length control the period of the indicator, in general higher lengths will create wider bands, you must consider that this parameter behave differently than other ones and may create slower results in comparison with other bands indicators while having the same length period.
The indicator can use a simple breakout methodology (see trailing stop part) but can sometime provide support and resistance points, in fact i believe that when the average variability/volatility of band A is higher than the average variability/volatility of band B and that the price cross band B then price will reverse its direction, this claim is not justified, research is needed.
Trailing Stop Mod
It is possible to make the indicator act as a trailing stop, in order to do so just tick the trailing stop mod box.
The average/bands will automatically disappear being replaced by the trailing stop.
Conclusion
I was just playing around when making the skeleton of the indicator, i hope the code is easy to understand, if you need some kind of explanation just pm me, i'm always open to help people/receive suggestions.
Best Regards

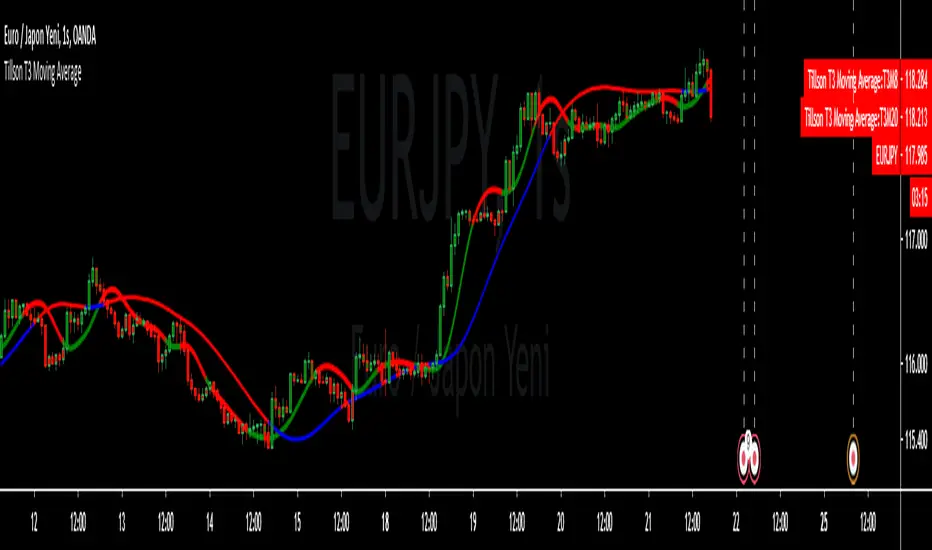
(YEK) Combo(YEK) Combo is a combination of several indicators (listed below). You can use them together or one by one. Just click settings, and choose which of them to be shown.
Here are the indicators included in this script:
- Ichimoku Cloud
- Bollinger Bands
- Moving Average 1
- Moving Average 2 (In case of detecting golden crosses or death crosses)
- Exponential Moving Average
- T3 Tillson
- MavilimW
Enjoy!

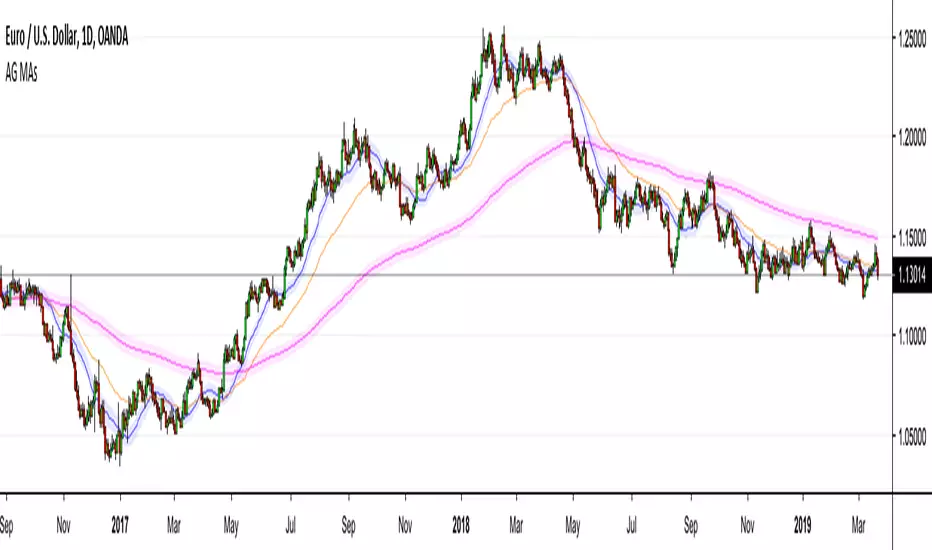
AG Moving Averages w/ BandsThis is an indicator that we built from a few simple ideas: display more than one Moving Average, display the Moving Average "Band" (more below) for each Moving Average, and allowing toggle between SMA/EMA - all in the one indicator.
The Moving Average "Band" is creating using Moving Averages (SMA/EMA) with High and Low as sources. The combination of the MA(Close), MA(High), MA(Low), creates a "Band" for each MA length - which we have found to be very helpful in our Moving Average studies.
The example in the chart above is EURUSD with 20SMA (with Bands), 55EMA (without Bands), 200EMA (with Bands). As you can see, the Bands do a better job than MAs alone for capturing price movement and acting as larger dynamic Support/Resistance zones.
Everything in this indicator is fully customizable, from which MAs to show, to those MA lengths, whether to use SMA/EMA for each individual MA, and whether to display the MA "Band" for each individual MA.
We hope you find it as useful as we have!
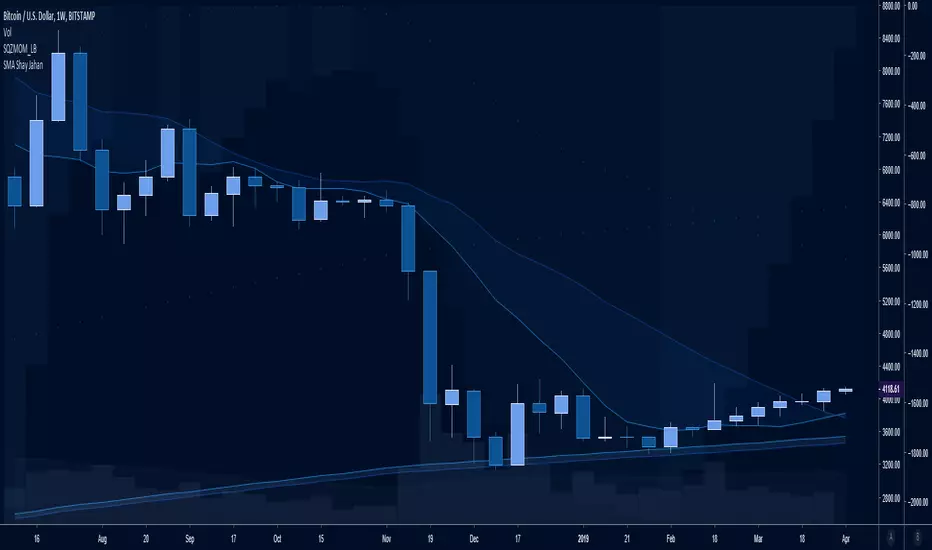
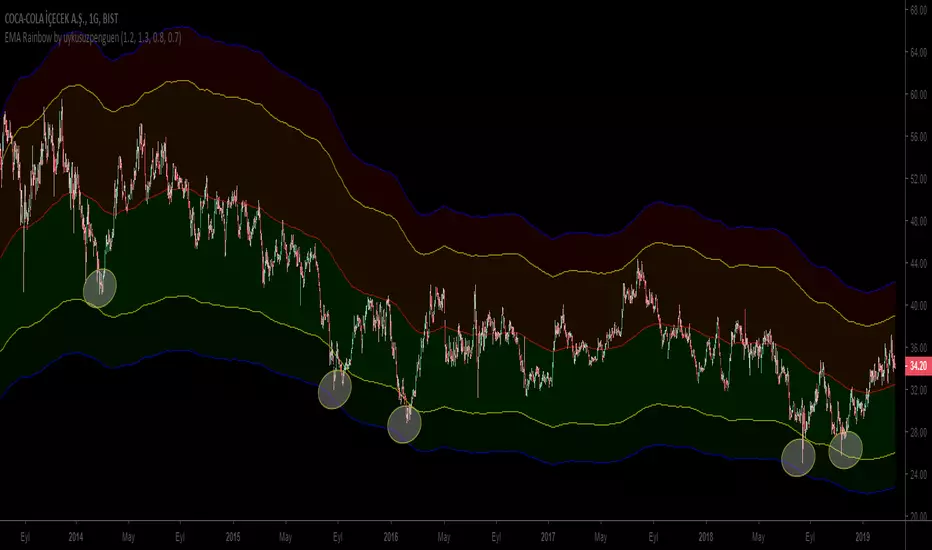
EMA Rainbow by uykusuzpenguenTo Survive in Bear Markets or in Horizontal Markets;
EMA Rainbow ;
EMA Rainbow is a rainbow which is formed by multiplying the moving average by certain proportions and reflecting up and down on the ema200. According to the observations, dark green areas are strong buying areas, dark red areas are strong sales regions. Trading decisions can be made according to the line breaks or the regions in which the price movements. Rates can be edited in the settings section.
The graph shows reactions in dark green areas.
Ayı Piyasasında yada Yatay Piyasalarda hayatta kalmak için ;
EMA Rainbow ;
EMA200 hareketli ortalamanın belirli oranlarla çarpılarak ema200ün üstüne aşşağı ve yukarı yansıtılmasıyla oluşan gökkuşağıdır. Yapılan gözlemlere göre koyu yeşil bölgeler güçlü alım yerleri , koyu kırmızı bölgeler güçlü satış bölgeleridir. Çizgi kırılımlarına yada fiyatın gezindiği bölgelere göre alım satım kararı verilebilir. Oranlar ayarlar kısmından düzenlenebilir.
Grafikte koyu yeşil bölgelerdeki tepkiler gözlemlenebilir.
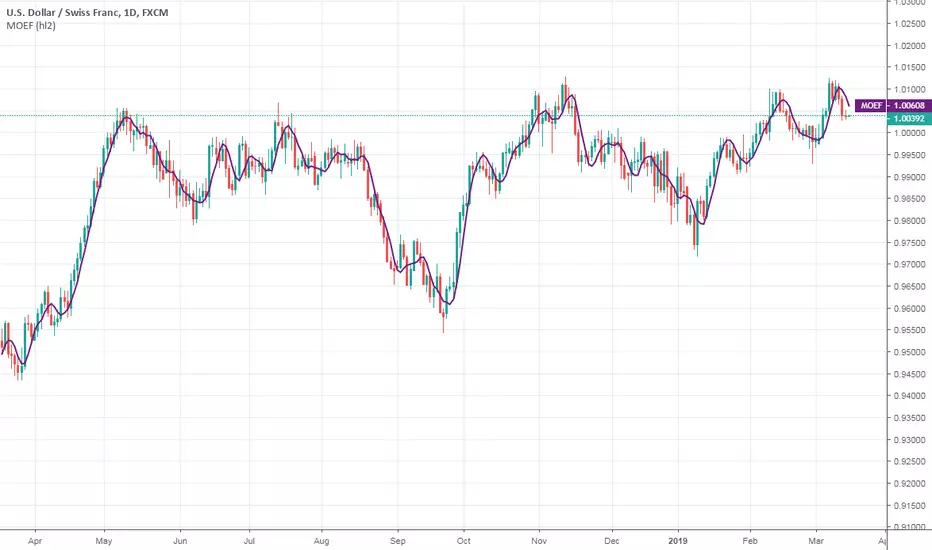
Ehlers Modified Optimum Elliptic FilterThis indicator was originally developed by John F. Ehlers (Stocks & Commodities, V.18:7 (July, 2000): "Optimal Detrending").
Mr. Ehlers didn't stop and improved his Optimum Elliptic Filter. To reduce the effects of lag he added the one day momentum of the price to the price value.
This modification produce a better response.
Ehlers Optimum Elliptic FilterThis indicator was originally developed by John F. Ehlers (Stocks & Commodities, V.18:7 (July, 2000): "Optimal Detrending").
Mr. Ehlers worked on the smoother that could have no more than a one-bar lag. An elliptic filter provides the maximum amount of smoothing under the constraint of a given lag.
Self-Weighted Moving AverageThis type of moving average was originally developed by Alex Orekhov at his home. This WMA uses previous prices as weights for the new ones. At the moment, this is a highly experimental approach, so don't use it in real trading.
The weighting scheme is presented on the chart.
