% Volume (%V)Read about it in the book of Buff Pelz Dormeier "Investing with Volume Analysis: Identify, Follow, and Profit from Trends" .
Normalized volume ( %V ) is a concept that uses an average of volume to plot volume. The volume total for the current bar is divided by the average volume (over the last n bars) to form a ratio. This ratio is multiplied by 100 and plotted in the same way that traditional volume is plotted as vertical bars on the horizontal plane, which creates a normalized volume scale of 0 to 100 . This allows for easy interpretation of volume’s relative movements, with 50 being typical or average volume, numbers below 50 being light volume, and numbers above 50 being heavier volume.
Good luck!
Average

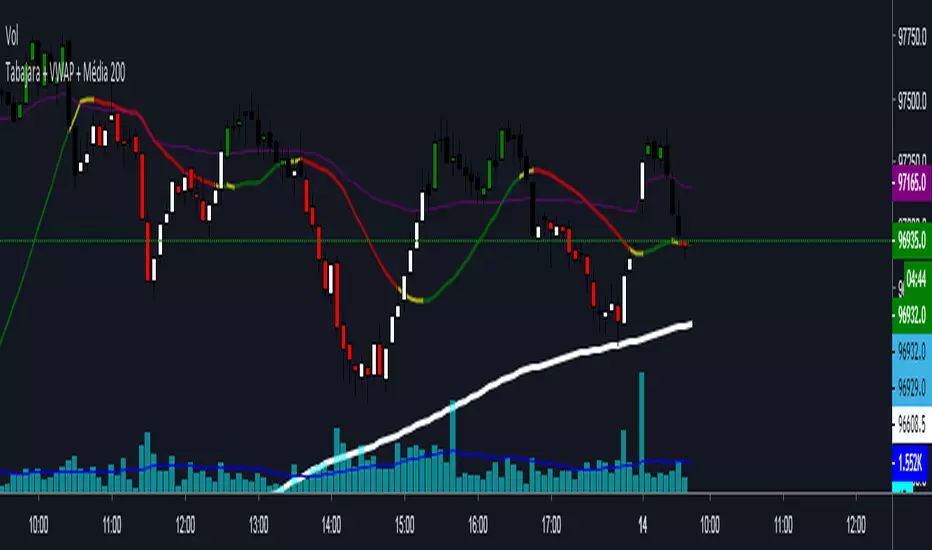
Tabajara + VWAP + Media 200Tabajara was created by André Machado, the Wall Street Ogre.
The Tabajara is accompanied by an average of 200 periods and the daily VWAP.
Suggestions will be very welcome!
Good profit and good trades!
Att
Felipe Kruger
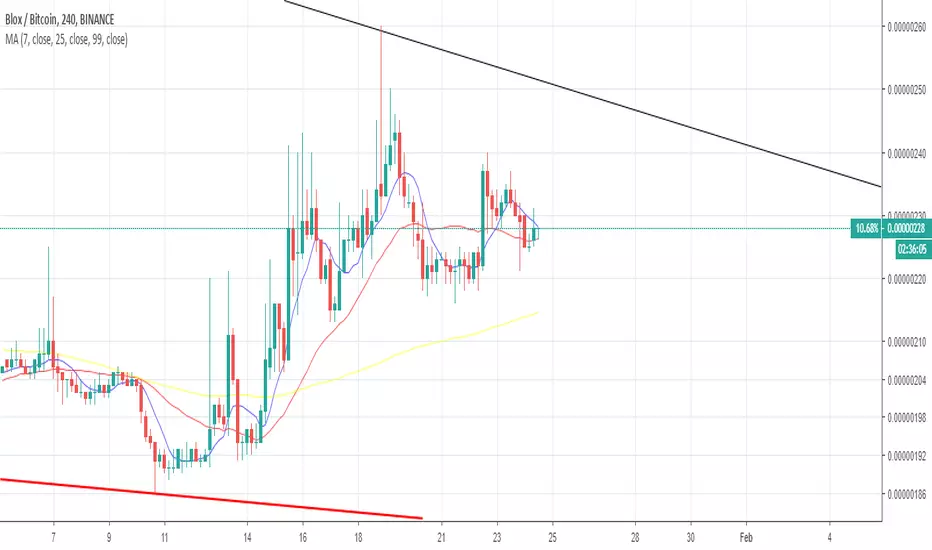
Synchronicity 3 Displaced SMAsA simple, clean script that displays three simple moving averages and allows you to displace them forward by a number of bars. I have set the defaults to
Period, 3 Shift, 3
Period, 7 Shift, 5
Period, 25 Shift, 25
These are the defaults for use with Joe DiNapoli strategies.
Further changes to make them fore flexible, like switching each one on or off may come if required.
No donations sought, just a wee like if you like it.

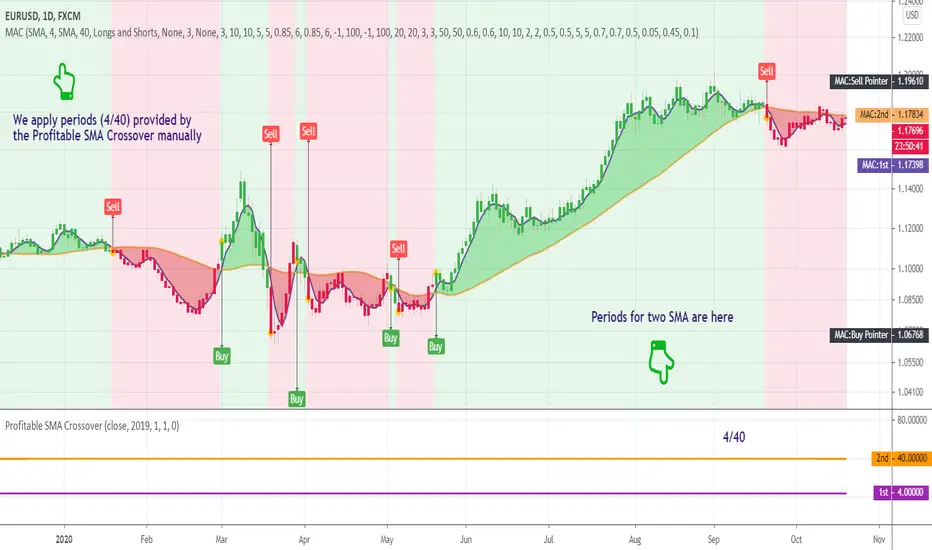
Profitable SMA CrossoverWhat is this tool?
This tool is a performance scanner of the crossover trading system that is based on the two simple moving averages (SMA). It uses a decision tree-based algorithm under the hood to find and plot the most profitable periods of the SMA combination.
It analyzes the range of periods between 4 to 45 and backtests each combination across the entire history of an instrument. If the more profitable periods were detected the indicator will switch periods of the moving averages immediately.
This is an add-on for the Ingenious SMA Crossover but can be used standalone.
Alerts
It has an alert that notifies when the more profitable periods were detected.
NOTE : It does not change what has already been plotted.
Good luck!
Ingenious SMA CrossoverIntroduction
A popular use for moving averages is to develop simple trading systems based on moving average crossovers. A trading system using two moving averages would give a buy signal when the shorter (faster) moving average advances above the longer (slower) moving average. A sell signal would be given when the shorter moving average crosses below the longer moving average. The speed of the systems and the number of signals generated will depend on the period of the moving averages.
What is this tool?
This tool is a crossover system of two simple moving averages. I called it "Ingenious" because it uses a decision tree-based algorithm under the hood to find and plot the most profitable SMA combination.
It analyzes the range of periods between 4 to 45 and backtests each combination across the entire history of an instrument. If the more profitable periods were detected the indicator will switch periods of the moving averages to the found ones immediately.
NOTE : It does not change what has already been plotted.
Good luck!

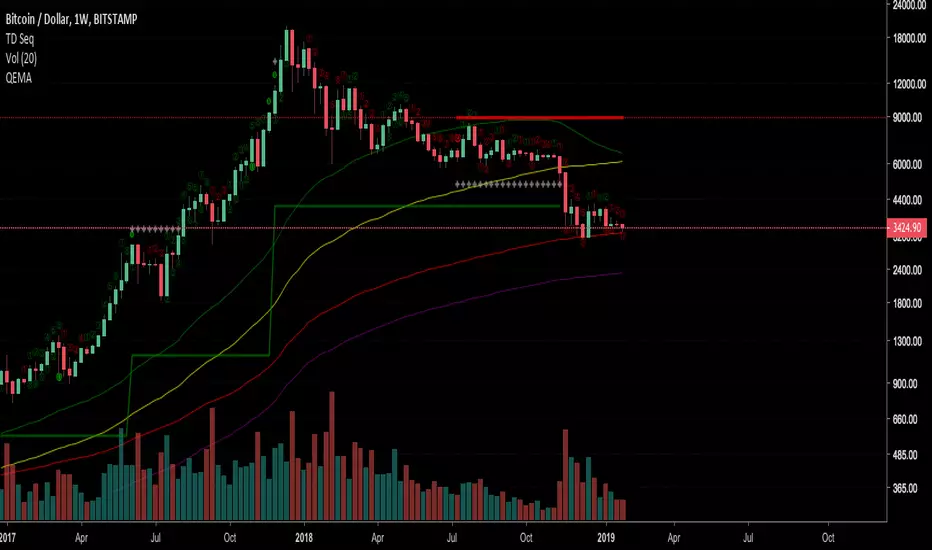
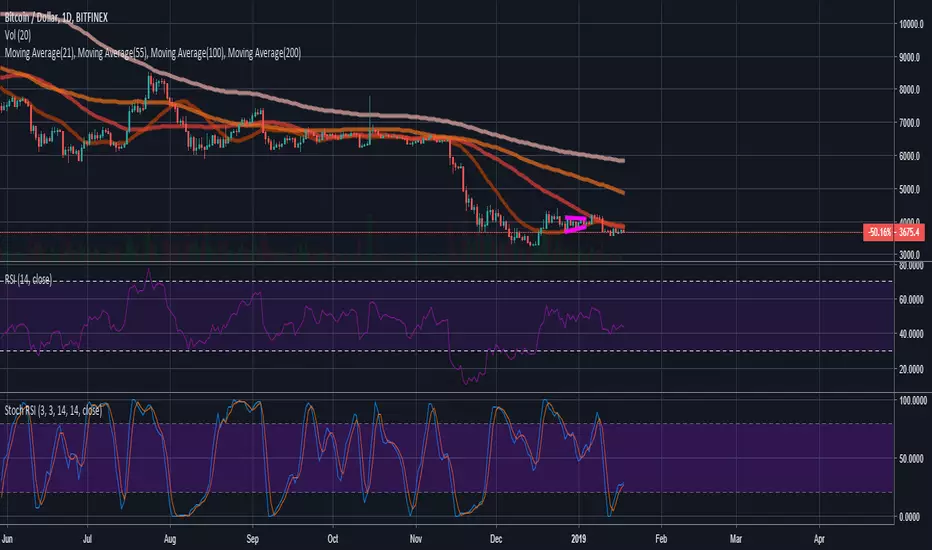
QEMA - Quadruple Moving Averages (50,100,200,300)The script combines the common moving averages 50,100 and 200 and adds an additional MA300 to the graph.
Average Indicators Positionsby this script you can see the average level of macd, macd-asprey, rsi, stochastic, cci, momentum, obv, DI, volume weighted macd, cmf indicators within a period. It also calculates and creates the same graph for higher time frame, so you can see average levels for current and higher time frame. you can also check it for divergence/convergence. You can use it as you wish and add/remove indicators.

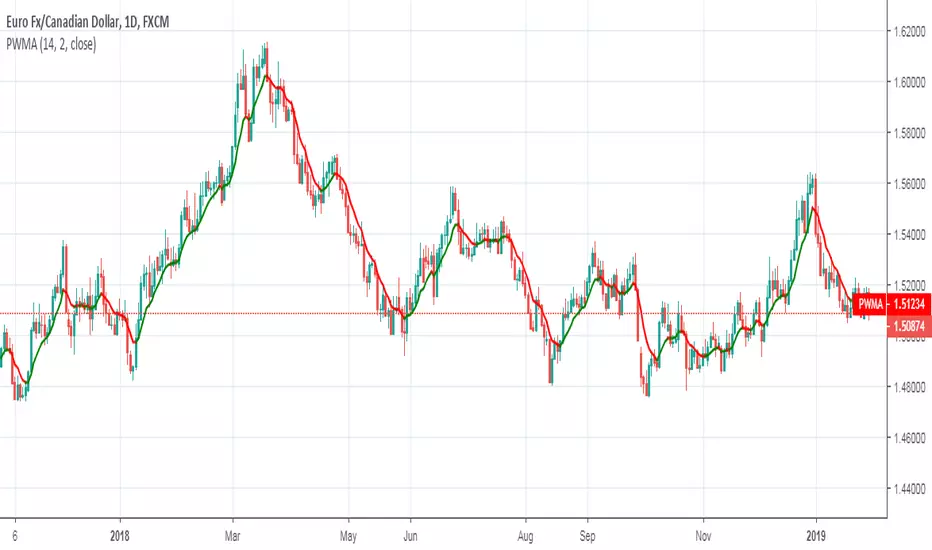
Parabolic Weighted Moving AverageThe weights of this moving average are powers of the weights of the standard weighted moving average WMA .
Remember:
When parameter Power = 0, you will get SMA .
When parameter Power = 1, you will get WMA .
Good luck!
Bitstamp BTC Horizontal 200 Week SMAsmall change to my horizontal 200 week SMA script.
Plots the latest 200 week SMA value from Bitstamp BTCUSD on the chart. I use it for the Bitmex chart, as Bitmex doesn't have enough history for a 200 week moving average.

Jurik Moving AverageThis is my best attempt to reproduce the original Jurik Moving Average. It differs from Jurik's a little bit, but in most cases it behaves like the original.
Jurik Moving Average is known as a superior noise elimination (causal, nonlinear and adaptive) filter and a world class moving average that tracks and smoothes price charts or any market-related time series with surprising agility.
Settings
Length (default: 7 )
Phase (default: 50 )
Price Source (default: close )
I attached some screenshots to show you how it works with other instruments
USDJPY, D
USDJPY, 60
USDCAD, D
USDCHF, D
EURUSD, D
GBPJPY, D
AUDUSD, D
XAUUSD, D
XAUUSD, 60
AAPL, D
AAPL, 60
MSFT, D
AMZN, D
BTCUSD, D
BTCUSD, 60
ETHUSD, D
Good luck and happy trading!

4SMA Fibonacci 55/89/223/610just noticed the correlation of SMAs and fibonacci on my charts.
maybe it will help you to.

Higher Timeframe EMAThis script plots a higher timeframe EMA to your chart.
You can specify the timeframe and the length of the EMA in the settings.
This chart demonstrates the 5-minute 50EMA (black) combined with the 1-hour 50EMA (colored) on the 1 minute timeframe.

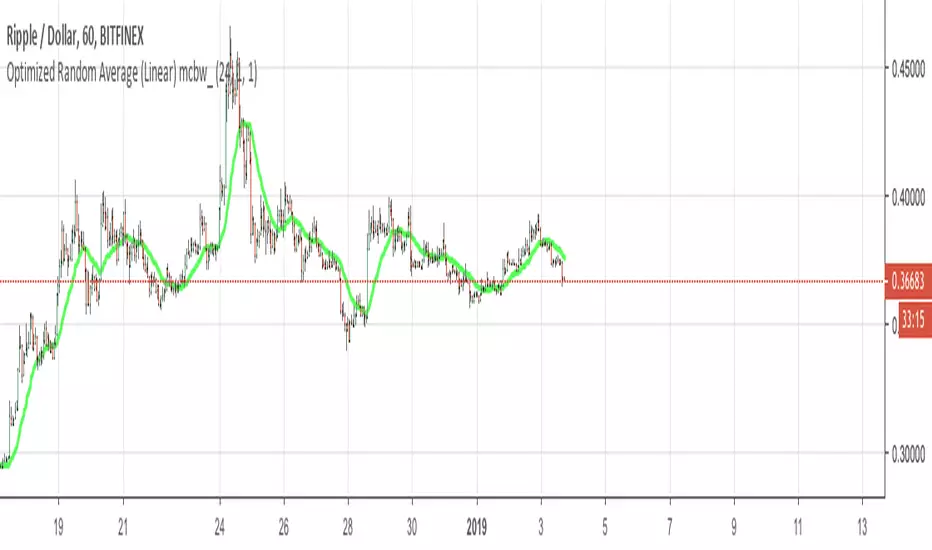
Optimized Random Average (Linear) mcbw_This is a moving average with a customizable random kernel. You can shape your kernel by selecting your parameters in the settings window. This is not something that is immediately ready to mess with by just applying it on the chart, it is very useful for people who are researching indicators and developing new tools. To see the shape of your kernel you can plug it into google or wolfram. This indicator and the related ones are rather technical in nature, so feel free to comment any questions you may have and to see if anyone has asked your question.
Read more here:
Happy studying and enjoy your life!
2019 will be absolutely insane!
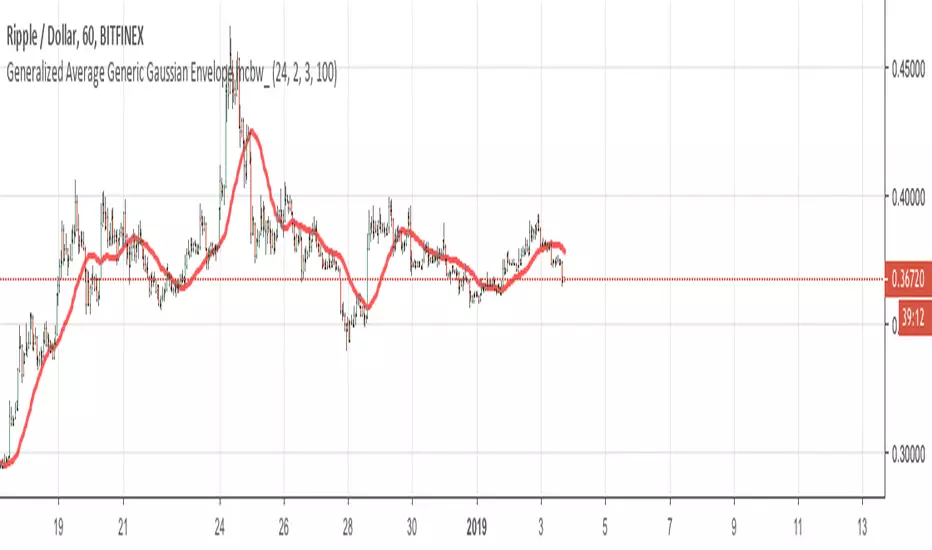
Generalized Average Generic Gaussian Envelope mcbw_This is a moving average with a customizable gaussian kernel. You can shape your kernel by selecting your parameters in the settings window. This is not something that is immediately ready to mess with by just applying it on the chart, it is very useful for people who are researching indicators and developing new tools. To see the shape of your kernel you can plug it into google or wolfram. This indicator and the related ones are rather technical in nature, so feel free to comment any questions you may have and to see if anyone has asked your question.
Read more here:
Happy studying and enjoy your life!
2019 will be absolutely insane!
Generalized Average Polynomial Envelope mcbw_This is a moving average with a customizable polynomial kernel. You can shape your kernel by selecting your parameters in the settings window. This is not something that is immediately ready to mess with by just applying it on the chart, it is very useful for people who are researching indicators and developing new tools. To see the shape of your kernel you can plug it into google or wolfram. This indicator and the related ones are rather technical in nature, so feel free to comment any questions you may have and to see if anyone has asked your question.
Read more here:
Happy studying and enjoy your life!
2019 will be absolutely insane!

Average buyer/seller priceThis script shows average buyer or seller price since the last bar you define.
The bar is defined by the condition low/high less or greater than specific value.
Recommended to use 15/30 or 1h timerame (the less the better).
The error is about 1%.
Blue - Buyer
Red - Seller.

RSI WMAThis is RSI but using WMA as a part of calculation. Green is bullish and red is bearish. This is not my idea. All the credits go to @alexgrover. Have to protect the code just in case someone will commercialise this.

Trader Set - Volume CandleThis is a candlestick system but not on price. These candles are drawn based on the volume movement. This is one of those professional charting systems that big industries use every day. Remember, the key to find what smart money is doing, is always VOLUME. Any new way that you can track new aspects of volume will help determining what the market will do, BEFORE it starts doing it !
There are total of Seven moving averages that you can ...:
1- Set their period separately
2- Set their type separately
3- Turn on/off separately
The averaging types that are supported, remember you have options PER moving average :
- SMA
- EMA
- RMA
- WMA
- HMA
- KAMA
- MAMA
- FAMA
This script IS FOR SALE , you can buy it with crypto currencies, or webmoney or perfect money. THE PRICE is 55$. for life time license.
You can find all the crypto wallet addresses plus webmoney and perfect money accounts in the link below. Please send the correct amount PLUS the transaction fee. After the transaction is confirmed, contact me with the info of the transaction for granting access.
AَِDDRESSES FOR WALLETS : justpaste.it

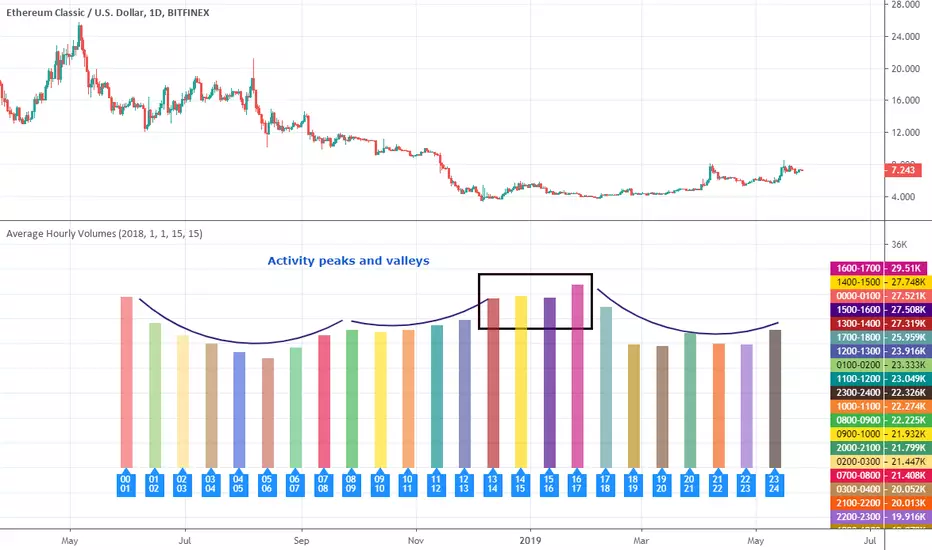
Average Hourly VolumesHello traders!
This indicator shows you the average hourly volumes across the instrument history.
It can help you to find time frames with the highest and the lowest activity of traders. Thus, you will know when to jump into the train and when to jump out.
What is included
An option to include/exclude weekends from calculation
An option to start calculations from specific date
An option to hide zero volumes
It works on ANY instrument that has available volume data.
It works on all resolutions
I attached some screenshots to show you how it works with other instruments.
Good luck and happy trading!
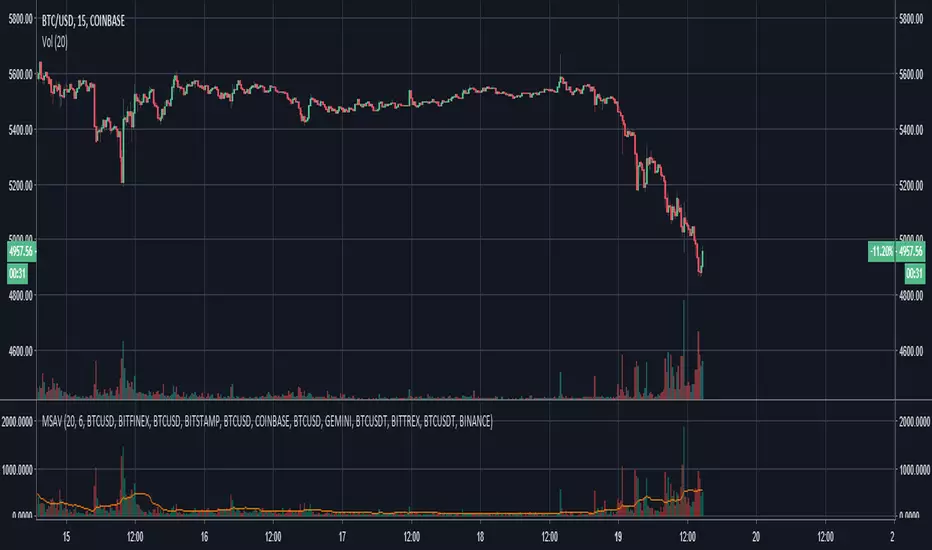
Multiple Security Average VolumeCame up with an idea to show an average volume of up to 6 securities together. Helps when looking at Bitcoin with its multiple exchanges.