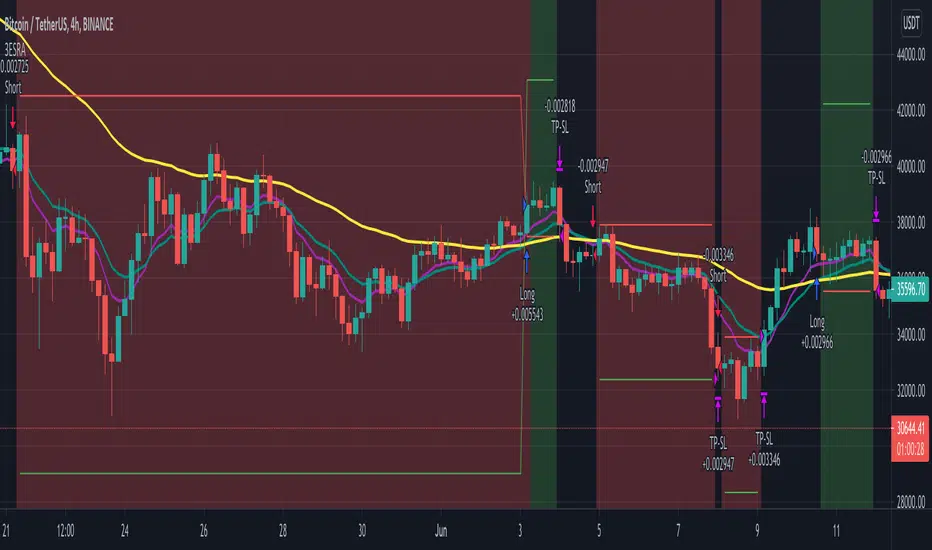
3 EMA + Stochastic RSI + ATR 3ESRA
v0.2a
Coded by Vaida Bogdan
3ESRA consists of a 3 EMA cross + a close above (for longs) the quickest EMA
or below (for shorts). Note that I've deactivated the RSI Cross Over/Under
(you can modify the code and activate it). The strategy also uses a stop loss
that's at 1 ATR distance from the entry price and a take profit that's at
4 times the ATR distance from the entry price.
Average True Range (ATR)
Crypto EMA Trend Reversal StrategyThis is an EMA crossover strategy which involves 5 EMAs to trigger trades. The strategy has two take profit settings and uses a stop loss.
TP1 and SL are based on ATR and TP2 is an EMA crossover.
The strategy goes both long and short and the default settings work particularly well as a scalping strategy for ETHUSDT on the 5M time frame.
I have also created another version with tweaked settings for scalping LINKUSDT on the 5M with very similar results.
There is an option to add a volume condition parameter within the script on lines 26-28 which can be added to the end of lines 34-35 in the following format: and vol_cond
I personally don't currently use the volume condition parameter.

EMA RSI ATR Hidden Div Strat - 1 MinHey there!
Hereby I present you the EMA RSI Lowest Low Hidden Divergence strategy, which I discovered on a youtube channel.
He has tested the strategy hundreds of times manually, herewith I try to automate the whole thing.
Since I use the strategy with a bot, it can only enter long positions for now. But in the future I will add the possibility to trade short positions.
The strategy was tested with BTC/ USDT in 1m chart (8 days). The values must be adjusted depending on the timeframe and coin.
-----------------------------------------------------------------------------------
How does the strategy work?
First of all, we need a bullish hidden divergence.
Once this is detected, the following parameters are checked:
The 50 EMA must cross the 250 EMA .
Then, the candle must close above the 50 EMA .
The K line of the RSI STOCH indicator need to crosses the D line.
If the next candle closes above the 50 EMA , a long position is opened.
The stop loss is determined with the "lowest low/highest high lookback".
The profit factor is multiplied by the value of the lowest low/highest high lookback.
The results of the strategy are without commissions and levers.
If you have any questions or feedback, please let me know in the comments.
In the future I will add other types of stop loss / take profits. (ATR; %; eg.)
I wish you good luck with the strategy!

HMA_ATR StrategyATR with HMA experimental minimalist bot for ETHBTC .
A strategy for use by Automated Algorithm systems.
Different from normal ATR as it uses HMA for smoothing.
Example settings result shown here on chart include commission 0.5%

[EURUSD60] BB Expansion StrategyOverview
This is a strategy that can be used in the EURUSD 60 time frame.
It is a trend-following method that uses Bollinger Bands Expansions.
The idea of using Bollinger Bands expansion is well known to the general public, but I don’t know any strategy that this idea has been PINE coded.
The three main components of this strategy are as follows.
・Long term BB and Short term BB : When the short term BB expands more than the long term BB, it suggests the occurrence of a trend.
・14EMA of 240 t/f : The direction of 14EMA of the upper time frame is used as the trend direction.
・ATR lines : As a stop-loss line and a take-profit line.
Description
Fig. Long entry pattern
Fig. Short entry pattern
・Description of lines
Gray : Large BB (=Long term BB)
White : Small BB (=Short term BB)
Blue or Red line : Upper t/f EMA(default: 14EMA), blue is up-trend, red is down-trend
Yellow : Stop loss line by ATR(the term is 14)
Purple : Take profit line by ATR(the term is 14)
・Description of strategy
First of all, when the small BB expands more than the large BB, this strategy detects the occurrence of a trend.
Second, When the price crosses over or crosses under small BB basis, this strategy entries long or short to trend direction (by upper time frame 14EMA).
The default stop-loss range is three times ATR value, and the default take-profit target is 1.5 times the stop-loss range (=risk reward ratio is 1.5).

Momentum Trading Strategy (Weekly Chart)The strategy will open position when there is momentum in the stock
The strategy will ride up your stop loss based on the super trend.
The strategy will close your operation when the market price crossed the stop loss.
The strategy will close operation when the line based on the volatility will crossed

3x SuperTrend Strategy (Mel0nTek) V1This is a triple SuperTrend based strategy for lower time frame trades such as day trades and scalping. I have not seen many strategies that combine multiple SuperTrends so I thought I would publish this one since I put it together and have been quite happy with the results. I have found through testing that the best results are on currency exchange markets such as Crypto or Forex on 1-15 min time frames.
The core idea was inspired by a youtube video put out by Trade Pro:
"Trade Pro - HIGHEST PROFIT Triple Supertrend Trading Strategy Proven 100 Trade Results"
I went ahead and set the defaults to the ones he uses in his video for anyone who wants to try a configuration similar to his. They work pretty well in general, however the EMA, SuperTrend ATR multipliers, and P/L ratio can be tuned/optimized to fit the timeframe/market desired. The video is quite good but not a required watch as I will explain below.
The 200EMA is used as a medium-term trend direction indicator.
- Price closing consistently above the 200EMA means that only long positions should be entered.
- Price closing consistently below 200EMA means that only short positions should be entered.
The 3 SuperTrend indicators should be used as direction confirmation for entries. Typically, price above SuperTrend indicates bullish movement, while price below SuperTrend indicates Bearish movement. However by itself, it is not a great indication to enter/exit positions in my experience. By combining 3 of them with slightly longer periods and increased ATR multipliers, we can get much stronger confirmation of trend direction/strength.
The way they are used in this strategy is such that:
- We only want to enter a position if at least 2 out of 3 SuperTrends are on our side.
- 3/3 SuperTrends on our side is the best case, since we are taking trades WITH momentum/price strength.
- The second farthest SuperTrend from entry price is used as a Stop Loss
SuperTrend being on our side is not the only requirement for an entry however. The probability of success is increased with SuperTrend, and a longer EMA on our side, but we want to be sure that we aren't getting in too late/after the movement has already happened.
So we use Stoch RSI to pick our entries where price is oversold/overbought and reversing. That means the Stoch RSI is above 80, or below 20, and our indication to enter the trade is when the 2 lines cross/begin reversing direction.
So with trend direction on our side, we can get really good entries at these oversold/overbought extremes, especially as it's reversing (Stoch RSI K and D are crossing). This allows us to use the SuperTrend as a support/stop loss on our entry since price should be above it.
Then we just target 1.5x our max loss so that even if we only win 50% of the time, we still make a profit.
The explicit rules of this strategy are as follows:
=== Rules ===
long only
- price above EMA200
short only
- price below EMA200
Stop Loss = 2nd SuperTrend line above (short) or below(long) entry candle
Profit = 1.5x SL/risk (Profit Ratio x Max Loss)
=== Entry Setup ===
LONG
- Stoch RSI below 20, cross up
- at least 2 SuperTrend lines below close
SHORT
- Stoch RSI above 80, cross down
- at least 2 SuperTrend lines above close
P.S. Special thanks to Trade Pro for producing so many quality videos, putting strategy claims to the test, and providing me with so many good ideas I apply to my own strategies.

[KL] Bollinger bands + RSI StrategyThis strategy is based on two of my previous scripts, one called “RSI14 + 10”; the other one called “Bollinger Bands Consolidation”. At its core, it combines the main setups from each of those two scripts but excludes the auxiliary features that were considered as experimental. This strategy will identify periods of squeeze, and then enter long during consolidation with a trailing stop loss set.
Primary indicator will be the Bollinger Bands. By comparing the width of the BBs with the ATR of the same lookback period (i.e. 2 standard deviations of the 20 recent closing prices vs ATR(20) x2), we begin to look for confirmation for entry whenever the standard deviation of prices is less than the ATR. This can be seen visually in the plots (i.e. default gray lines representing ATRx2 relative to BB center line).
Confirmation for entry will be the RSIs (slow-14, and fast-10). If both are upward sloping, then we assume prices are in an uptrend and may eventually break above upper band. RSIs are typically in mid-range when prices are consolidating, therefore no need to measure it.
Exits will happen in two cases, (1) when trailing stop loss hits, or (2) when RSIs signal that the instrument is overbought. No. 1 is self-explanatory. No. 2 happens, when RSI14 reaches above 70 (can be changed), followed by RSI10 catching up and surpassing RSI14.

CRYPTO 3EMA Strategy with Take Profit & Stop Loss based on ATRSimple 3 EMA Strategy with plotted Take Profit and Stop Loss
Entry condition:
- Middle EMA cross above the Slow EMA
- Set take profit and stop loss exit conditions based on ATR Indicator
Exit condition:
- Fast EMA cross below the Middle EMA

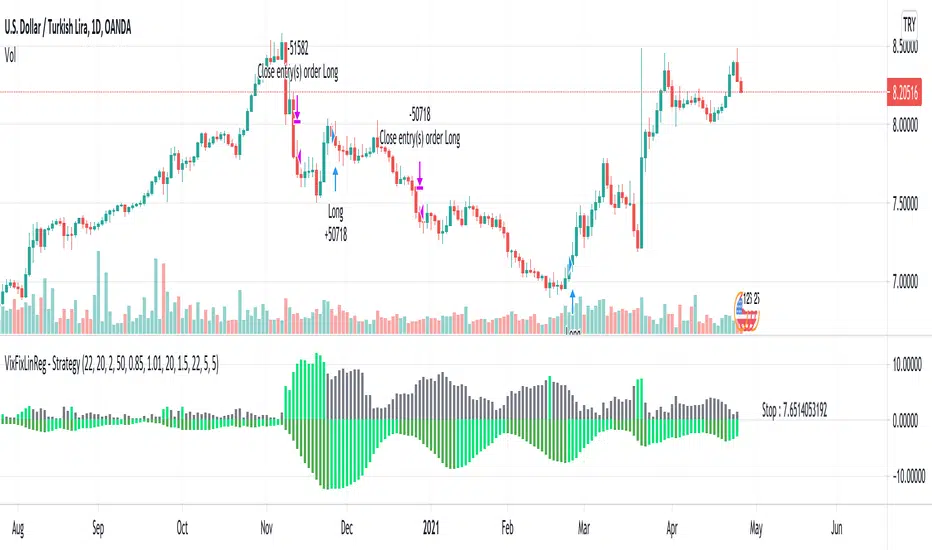
VixFixLinReg-StrategyThis idea came up while discussing about strategies with one of the trading enthusiast from tradingview community.
Strategy basically uses existing script of Vix Fix by Chris Moody:
VixFix is a great indicator for finding the market bottoms. But, sometimes it generates signal too early. But, we can apply linear regression on vix fix to find vix fix top to make timing much better.
Entry condition:
Wait for Vix fix bar to turn lime.
Once vix fix is turned lime, then wait for linear regression (shown below 0) to turn lime from green. This indicates VIX-Fix has started declining.
Go long once above two conditions are satisfied
Exit Condition:
ATR Based Stop
Applied only if linear regression is green - which means VixFix rising.
Note: This is ideal for identifying market bottom. May not yield good results on individual stocks.
Reversal with Bollinger Bands + RSI + ADX + ATR (Upgraded)Hi,
Welcome to my 4th script.
Someone asked me some questions about the Bollinger Band strategy I previously published. When I went back to my published script I couldn't help myself but simply try and make it better. Which I did.
Since I've published that script, I've gained much more knowledge about how Pinescript functions. As well as gaining more and more knowledge about how the markets are structered etc.
In this reversal script we use 4 indicators to determine good entry signals, we determine whether the market is ranging or trending and we still only want to take trades in the direction of the "trend".
Bollinger Bands are used for our entry signal. When price hits either side of the band, we wait for a reverse candlestick before we enter a position.
RSI is used to determine if we're in a trending market or in a ranging market. You can adjust the values in the inputs. You can determine the minimum RSI value and the maximum RSI value.
ADX is used the same way as RSI, you can adjust the value in the inputs. You can determine the minimum ADX value.
Last but not least we use two EMA's, a 200 EMA and 100 EMA. Both are adjustable through the inputs. I used two EMA's because I noticed when using this strategy that we'd enter a new position often after having a bad trade. Using two EMA's might clean up some signals, in my case with EUR/USD on a 15m timeframe, it didn't clean up enough signals.
All the default values are pretty decent but might require some finetuning on a certain instrument. Don't overfit the strategy though, that'll only give you bad signals in the future.
Then we are off to our exit signals.
Initially I wanted to incorporate my previous Bollinger Band exit signals as well, but it was too much of a hassle to make the script work as intended so I left it out. If you want to use those exit signals, just find my other script.
When we're in a position and price crosses the opposite band, we wait for a reverse candlestick before we exit the position.
Additionally we want our losses to be as small as possible, so we use RSI to signal us when the market is, or starts to, trend against us. This is where you use the minimum and maximum exit values. So when RSI crosses over or under that value, it'll exit the position.
Furthermore, we use the ATR indicator to set our stop loss, which is pretty basic stuff. You can adjust the ATR multiplier in the inputs. Disabling "Use Trailing Stop?" is really inadvisable unless you know this script inside out as your only exit signals will be opposite Bollinger Band Cross and RSI overbought / oversold areas.

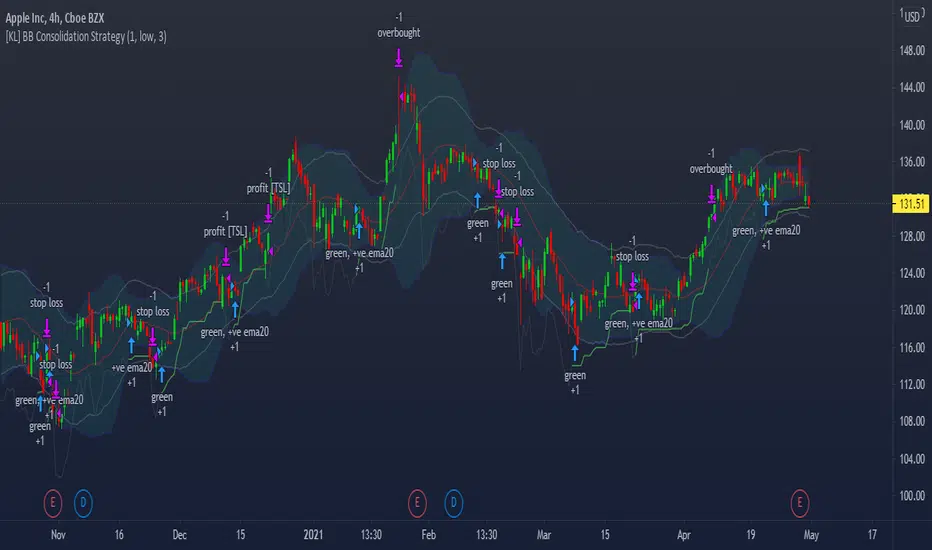
[KL] Bollinger Bands Consolidation StrategyThis strategy will enter into long position based on the volatility of prices implied by indicators of (a) Bollinger bands, and (b) ATR.
Application of Bollinger bands ("BOLL")
Using plain vanilla settings for BOLL (i.e. 20 period moving average, and 2 standard deviations of closing prices), we are interested to know about the shape of the area that is bounded by the upper and lower bands.
In theory, consolidation happens when volatility of price decreases. Visually speaking, this is represented by the narrowing of the upper/lower bands. This strategy considers the narrowing of BOLL bands as the primary indicator for long-entry.
Application of ATRs (as confirmations)
Firstly, to confirm that BOLL bands are narrowing (as mentioned above), the ATR at a potential point of entry is compared against the standard deviation of prices over BOLL's lookback periods. Once again, visualizing the shape of BOLL bands during consolidation, we assume the lines begin to squeeze when the distance between the center line and upper/lower band is less than two current ATRs.
Secondly, this strategy looks into the moving average of ATRs to assure that prices are not too choppy when entering into market. If the moving average of ATR decreases at a point in time such that all the above conditions are met, then we can assert that the volatility of price is decreasing.
Thirdly, ATR is used for determining the size of our trailing stop loss. We will keep the multiplier fixed at two.
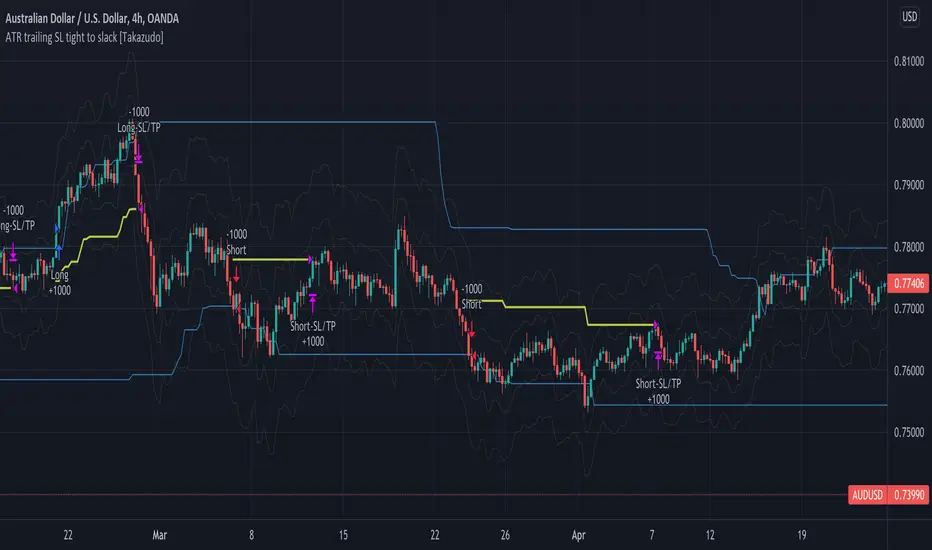
ATR trailing Stop Loss tight to slack [Takazudo]This is a demo of ATR based trailing Stop Loss.
This SL strategy uses 2 types of ATR based SL.
tight SL as initial (ATR * 1.5)
slack SL as trailing (ATR * 4)
When any entry singal occurs by the buy/sell conditions, this SL strategy uses the "tight SL" as the initial SL.
Then the SL will chase the price as trailing SL. However, this strategy uses the "slack SL" in this trailing phase.
So you can set the tight SL first.
Then SL will chase the price as the slack one.
Note: The entry strategy in this script is not intented to win. Check the result. Be careful. Just a module of my strategy.
Trend Surfers - Premium Breakout + AlertsTrend Surfers - Premium Breakout Strategy with Alerts
I am happy today to release the first free Trend Surfers complete Breakout Strategy!
The strategy includes:
Entry for Long and Short
Stoploss
Position Size
Exit Signal
Risk Management Feature
How the strategy works
This is a Trend Following strategy. The strategy will have drawdowns, but they will be way smaller than what you would go through with buy and old.
As a Trend Following strategy, we will buy on strength, when a breakout occurs. And sell on weakness.
The strategy includes a FIX Stoploss determined by an ATR multiple and a trailing Stoploss/Takeprofit also determined by an ATR multiple.
You can also manage your risk by entering the maximum % you are willing to risk on every trade. Additionally, there is an option to enter how many pairs you will be trading with the strategy. This will change your position size in order to make sure that you have enough funds to trade all your favorite pairs.
Use the strategy with alerts
This strategy is alert-ready. All you have to do is:
Go on a pair you would like to trade
Create an alert
Select the strategy as a Trigger
Wait for new orders to be sent to you
Every Entry (Long/Short) will include:
Market Entry (Enter position NOW!)
Stoploss price
Position Size
Leverage
* If you do not wish to use leverage, you can multiply the Position Size by the Leverage. But doing that, you might end up with a position greater than your equity. Trading on Futures is better in order to have accurate risk management.
Exit signals:
When you receive an exit signal, you need to close the position ASAP. If you want to keep your results as close as possible to the backtest results, you need to execute quickly and follow what the strategy is telling you.
Do not try to outsmart the strategy
Leave your emotion out of trading! If you trust the strategy, you will have way better returns than if you try to outsmart it. Follow each signal you receive even if it doesn't seem logical at the moment.
Become a machine that executes. Don't look at fundamentals. Follow the trend! Trust the strategy!
I hope you enjoy it!

KAMA Strategy - Kaufman's Adaptive Moving AverageThis strategy combines Kaufman's Adaptive Moving Average for entry with optional KAMA, PSAR, and Trailing ATR stops for exits.
Kaufman's Adaptive Moving Average is, in my opinion, a gem among the plethora of indicators. It is underrated considering it offers a solution that intuitively makes a lot of sense. When I first read about it, it was a real 'aha!' moment. Look at the top, pink line. Notice how during trending times it follows the trend quickly and closely, but during choppy, non-trending periods, the KAMA stays absolutely flat? Interesting! To trade with it, we simply follow the direction the KAMA is pointing. Is it up? Go long. Is it down? Go short. Is it flat? Hold on.
How does it manage to quickly follow real trends like a fast EMA but ignore choppy conditions that would whipsaw a fast EMA back and forth? It analyses whether recent price moves are significant relative to recent noise and then adapts the length of the EMA window accordingly. If price movement is big compared to the recent noise, the EMA window gets smaller. If price movement is relatively small or average compared to the recent noise, the EMA window gets bigger. In practice it means:
The KAMA would be flat if a 20 point upwards move occurred during a period that has had, on average, regular 20 point moves BUT
the KAMA would point up if a 20 point move occurred during a period that has, on average, had moves of only around 5 points.
In other words, it's a slow EMA during choppy flat / quiet flat periods, and a fast EMA as soon as significant volatility occurs. Perfect!
-----
The Strategy
The strategy is more than just a KAMA indicator. It contains:
KAMA exit (optional)
ATR trailing stop loss exit (optional)
PSAR stop loss exit (optional)
KAMA filter for entry and exits
All features are adjustable in the strategy settings
The Technical Details:
Check out the strategy's 'Inputs' panel. The buy and sell signals are based on the 'KAMA 1' there.
KAMA 1: Length -- 14 is the default. This is the length of the window the KAMA looks back over. In this instance, it c
KAMA 1: Fast KAMA Length -- 2 is the default. This is the tightest the EMA length is allowed to get. It will tend towards this length when volatility is high.
KAMA 1: Slow KAMA Length -- 20 is the default. This is the biggest the EMA length is allowed to get. It will tend towards this length when volatility is low.
KAMA Filter
The strategy buys when the KAMA begins to point up and sells when the KAMA points down. Generally, the KAMA is very good at filtering out the noise itself - it will go flat during noisy/choppy periods. But to add another layer of safety, its author, Perry Kaufman, proposed a KAMA filter. It works by taking the standard deviation of returns over the length of the the 'KAMA 1: Length' I mentioned above and multiplying it by an 'Entry Filter' (1 by default) and 'Exit Filter' (0.5 by default). The entry condition to go long is that the KAMA is pointing up and and it moved up more than 1 x St. Dev. of Returns. The exit condition is when the KAMA is pointing down and it moved down by more than 0.5 x St. Dev. of Returns.
Thanks
Thanks to ChuckBanger, cheatcountry, millerrh, and racer8 for parts of the code. I was able to build upon their good work.
-----
I hope this strategy is helpful to you.
Do you have any thoughts, ideas, or questions? Let me know in the comments or send me a message! I'd be glad to help you out.
If you need an indicator or strategy to be built or customised for you, let me know! I'll be glad to help and it'll probably be cheaper than you think!

MA Candles Supertrend StrategySimple strategy which is derived by below method:
1. Calculate moving average of High, Low, Open and Close and make candles of them.
2. Derive supertrend on the moving average candles.
3. Generate buy and sell signals based on supertrend direction combined with higher timeframe high-low condition

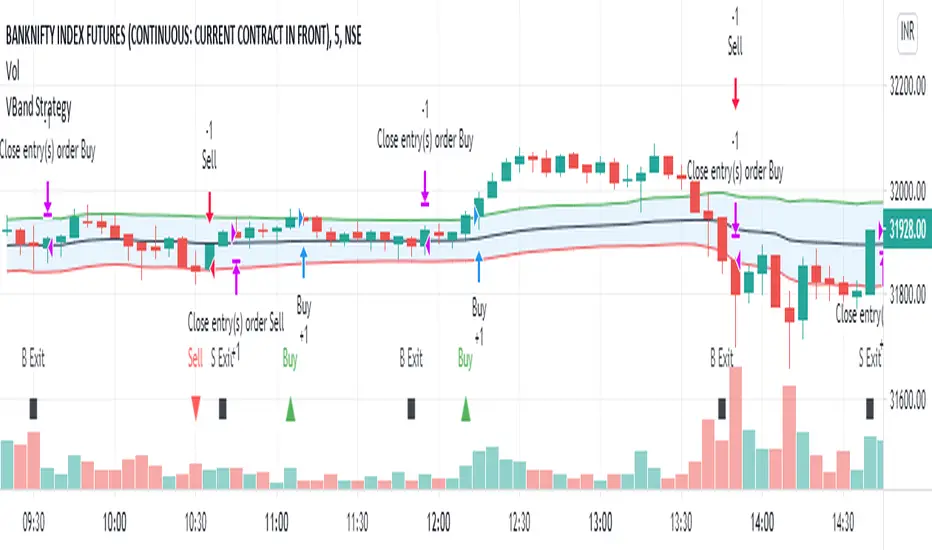
VBand StrategyVBand Strategy is simply used Vwap funcation and atr 14 for find the entry and exit points. This simple Strategy.
Profit MAX MTF HeatMapThis is a powerfull strategy which is made from combining 3 multi timeframes into one for profit max indicator
In this case we have daily, weekly and montly.
Our long conditions are the next ones :
if we have an uptrend on all 3 at the same time, we go long.
If we have a downtrend on all 3 of them at the same time we go short.
For exit, for long, as soon as one of the 3 converts into downtrend we exit the trade.
For exit, for short, as soon as one of the 3 converts into uptrend we exit the trade.
This tool can be used on all types of markets, and can also be changed the time frames.

Daily Open Strategy (DOS)DOS is a mean-reversal strategy that trades against the previous candle direction as long as it has body greater than the PrevRange paremeter.
Best results are obtained in GBP and AUD pairs on daily charts , but of course you can experiment with other assets and timeframes.
Strategy parameters include starting and ending dates, the previous candle range (raw value), the Stop Loss (SL, in pips, 200 = 20 pips) and the Take Profit (TP, in pips too).

MACD Strategy with trailing ATR stopThis is a trend based strategy that uses EMA and SMA intersection for determining the direction of the trend and MACD for the entry signal. At the same time, the strategy uses ATR, which is working as a trailing stop.
The strategy entry will work when the Trend ribbon will turn green and MACD line will crossover the signal line. This strategy also takes into account the pyramiding and allows to enter the second time if the signal will repeat itself.
There are 3 exit points. The first 10% of the position will be closed when the price will increase by 1%. The second portion of 50% will be closed when the price reaches 5% Take profit target. The remaining 40 % of the position will wait for the exit signal which will occur when the price closes below the ATR line.
The strategy is using a fixed amount in dollars, each time the entry occurs the strategy will enter with 100$ in the order.
The strategy can be applied to other crypto assets. However, they will require input changes.
Best of luck with your trading.

2HLA very simple, almost naive strategy, in which you buy on the lowest of the two previous candles and sell at the highest of the two previous candles. You can configure these highest and lowest lenght, in some assets two is too small of a number to make profit. You can also configure to exit the position after X, and I found that 7 (which is a week of working days) is a good number for that.
This is strategy is intended to be used as a swing trade. Your capital needs to be high enough so that it can pay the operaitonal costs, and reach it's target with a reasonable profit.
Since this is a volatility based strategy, assets that are more liquid won't work properly.

Profit Maximizer StrategyFirst I would like to thank to @KivancOzbilgic for developing this indicator.
All the credit goes to him.
I just created a strategy, in order to try to find the perfect parameters, timeframe and currency for it.
I will provide below the same description like he has in the publish of profit maximizer
Profit Maximizer - PMax combines the powerful sides of MOST (Moving Average Trend Changer) and SuperTrend (ATR price detection) in one indicator.
Backtest and optimization results of PMax are far better when compared to its ancestors MOST and SuperTrend. It reduces the number of false signals in sideways and give more reliable trade signals.
PMax is easy to determine the trend and can be used in any type of markets and instruments. It does not repaint.
The first parameter in the PMax indicator set by the three parameters is the period/length of ATR.
The second Parameter is the Multiplier of ATR which would be useful to set the value of distance from the built in Moving Average.
I personally think the most important parameter is the Moving Average Length and type.
PMax will be much sensitive to trend movements if Moving Average Length is smaller. And vice versa, will be less sensitive when it is longer.
As the period increases it will become less sensitive to little trends and price actions.
In this way, your choice of period, will be closely related to which of the sort of trends you are interested in.
We are under the effect of the uptrend in cases where the Moving Average is above PMax;
conversely under the influence of a downward trend, when the Moving Average is below PMax.
Built in Moving Average type defaultly set as EMA but users can choose from 8 different Moving Average types like:
SMA : Simple Moving Average
EMA : Exponential Movin Average
WMA : Weighted Moving Average
TMA : Triangular Moving Average
VAR : Variable Index Dynamic Moving Average aka VIDYA
WWMA : Welles Wilder's Moving Average
ZLEMA : Zero Lag Exponential Moving Average
TSF : True Strength Force
Tip: In sideways VAR would be a good choice
You can use PMax default alarms and Buy Sell signals like:
1-
BUY when Moving Average crosses above PMax
SELL when Moving Average crosses under PMax
2-
BUY when prices jumps over PMax line.
SELL when prices go under PMax line.

Profit Maximizer PMax Strategy - Long-ShortI developed a different strategy perspective for the Profit Maximizer PMax indicator prepared by Kıvanç Özbilgiç.
When you come to the settings section;
- You will see 2 options as Straregy Type. You can test the price and pmax intersections as different strategies.
- I added the Long-Short option for spot traders to calculate the profitability rate correctly. Spot traders should not choose this option.
Here you can set alarms on the original indicator with the parameters you find successful.
Türkçe:
Kıvanç Özbilgiç tarafından hazırlanan Profit Maximizer PMax indikatör için farklı bir strateji bakış açısı geliştirdim.
Ayarlar bölümüne geldiğinizde;
- Straregy Type olarak 2 seçenek göreceksiniz. Fiyat kesişimi ve pmax kesişimlerini, farklı stratejiler olarak test edebilirsiniz.
- Spot işlem yapanlar için karlılık oranını doğru hesaplayabilmeleri için Long-Short seçeneği ekledim. Spot işlem yapanların bu seçeneği seçmemeleri gerekmektedir.
Burada başarılı bulduğunuz parametreler ile orijinal indikatör üzerinde alarmlar kurabilirsiniz.
