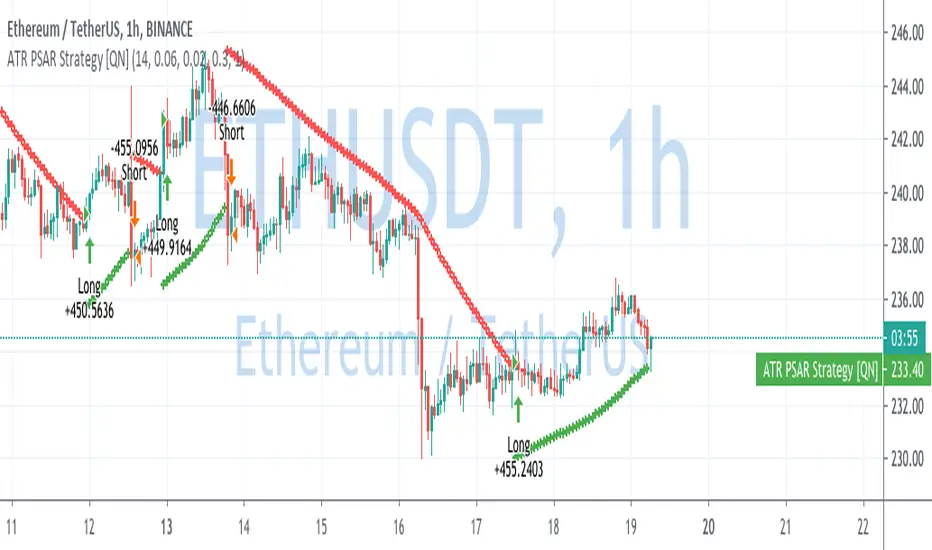
High/low crypto strategy with MACD/PSAR/ATR/EWaveToday I am glad to bring you another great creation of mine, this time suited for crypto markets.
MARKET
Its a high and low strategy, designed for crypto markets( btcusd , btcusdt and so on), and suited for for higher time charts : like 1hour, 4hours, 1 day and so on.
Preferably to use 1h time charts.
COMPONENTS
Higher high and lower low between different candle points
MACD with simple moving average
PSAR for uptrend and downtrend
Trenddirection made of a modified moving average and ATR
And lastly elliot wave oscillator to have an even better precision for entries and exits.
ENTRY DESCRIPTION
For entries we have : when the first condition is meet(we have a succession on higher high or lower lows), then we check the macd histogram level, then we pair that with psar for the direction of the trend, then we check the trend direction based on atr levels with MA applied on it and lastly to confirm the direction we check the level of elliot wave oscillator. If they are all on the same page we have a short or a long entry.
STATS
Its a low win percentage , we usually have between 10-20% win rate, but at the same time we use a 1:30 risk reward ratio .
By this we achieve an avg profit factor between 1.5- 2.5 between different currencies.
RISK MANAGEMENT
In this example, the stop loss is 0.5% of the price fluctuation ( 10.000 -> 9950 our sl), and tp is 15% (10.000 - > 11500).
In this example also we use a 100.000 capital account, risking 5% on each trade, but since its underleveraged, we only use 5000 of that ammount on every trade. With leveraged it can be achieved better profits and of course at the same time we will encounter bigger losses.
The comission applied is 5$ and a slippage of 5 points aswell added.
For any questions or suggestions regarding the script , please let me know.
Average True Range (ATR)

ATR Stop Buy StrategyThis strategy trial is let you to giving sell and buy orders with ATR (average true range) and an coefficent for them. it is my first strategy work, needs to be upgraded. USE IT WITH YOUR OWN RISK. IT IS NOT EVEN GUARANTEED TO WORK.
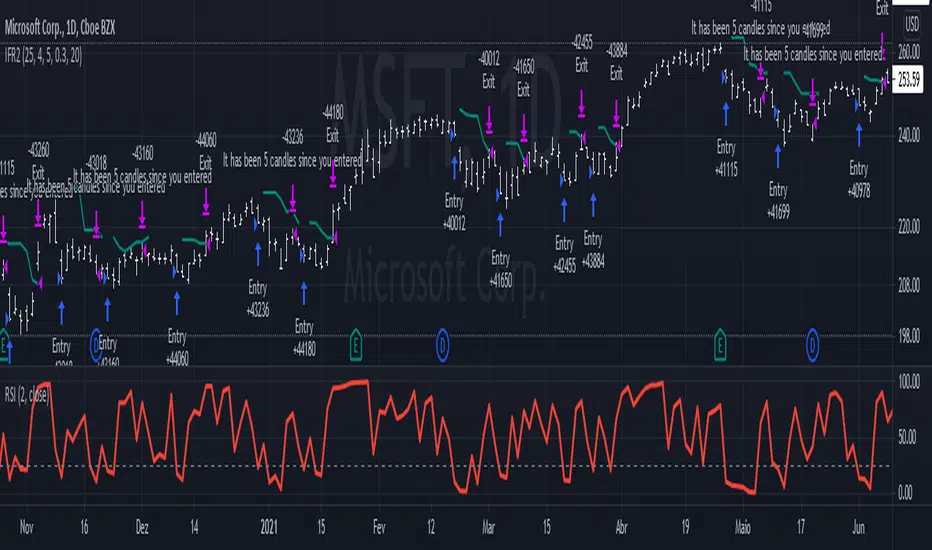
IFR2The IFR2 strategy is based on the RSI indicator.
If the two period RSI is less than the overbought level (25 is the default, but you can configure it to be lower), a long position is placed at the close of the candle. If you are doing it live, you'd have to enter the market ~ 10 minutes before it closes, check the RSI, and buy if it is lower than your overbought level. This generates a discrepancy in the backtesting, but since it is a very small difference, it can be disregarded. Higher overbought levels generate more signals, but they mostly are unreliable. Lower values generates better yields, but they won't occur very often. This strategy is designed to be used in a daily graph, and I don't recommend using it in intraday periods, since you'll make too little money to compensate for the operational cost.
The strategy exits when the high price of two previous candles is reached. If the exit price is higher than the closing price of when you entered, you'll be at a profit, otherwise you'll be at a loss. The exit price is plotted in the graph and it's colors depends on the current open profit: positive values will be green, negative will be red.
This strategy completely disregards the current trend. Long orders will be placed even if you are at a strong down trend. This may seem odd, but you have to keep in mind that this is a volatility based strategy , not a trend following one.
This setup was designed by Alexandre Wolwacz, a.k.a. Stormer.
2 Candles Inside ATR2 agitated candles falling inside ATR range, awaiting possibly a big move.
Buy / Sell signals at combined high / low can be used as order with other as stop loss.
Counter trade, when this minimal stop loss is hit, is also as useful. However, wait till the SL candle closes, before opening position on the other side.
Works quite well on 15 mins chart, with settings of ATR duration 25 and multiplier 0.6. These settings are configurable, so feel free.

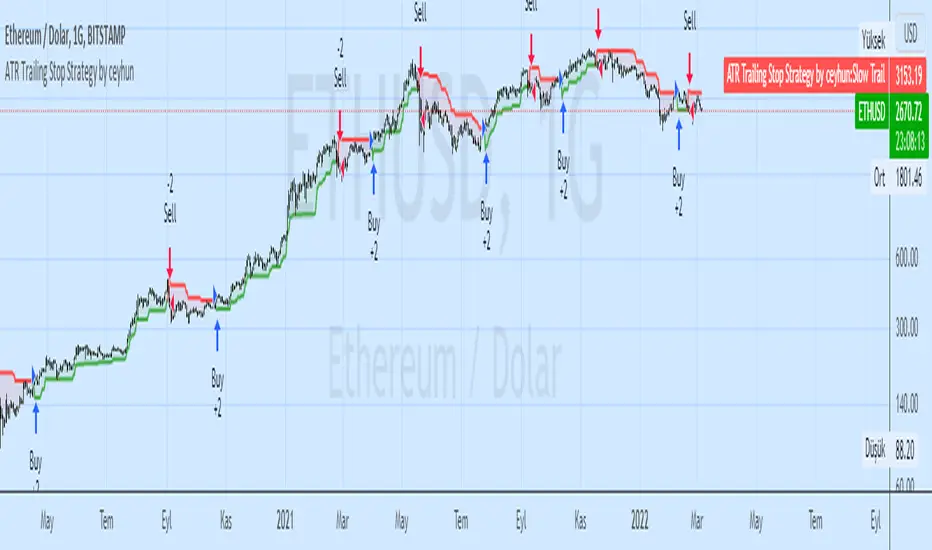
ATR Trailing Stop Strategy by ceyhunSame coding only coloring and strategy version added
//Barcolor
Green = Trail1 > Trail2 and close > Trail2 and low > Trail2
Blue = Trail1 > Trail2 and close > Trail2 and low < Trail2
Red = Trail2 > Trail1 and close < Trail2 and high < Trail2
Yellow = Trail2 > Trail1 and close < Trail2 and high > Trail2
//It gives White color where there is deterioration.
Let's not use InfoPanel in strategy, it would be wrong as it signals the next day.
ATR Trailing Stoploss StrategyI am sharing the strategy version of the indicator used before. It is very simple to use.
These are the settings I use, you can change, test and use as you wish.
Atr Period 5
Highest High Period 10
Multiplier 2.5
It can generate more signals in shorter time frames.
The success rate will be higher in longer time frames.

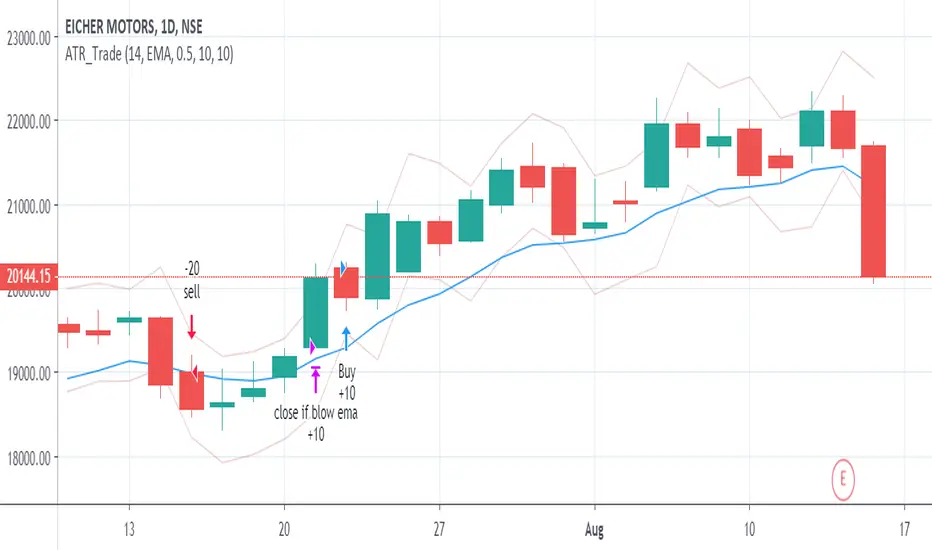
ATR_Trade_strategyATR Based Strategy
Identify the ATR range on Daily Chart.
ATR HIGH= Previous Close +ATR
ATR Low =Previous Close - ATR
Long when Close is above ATR High
Short when Close is below ATR Low
Exit when close moves below EMA(10) OR
a user-selected max loss
ATR Parabolic SAR Strategy [QuantNomad]I created a version of Parabolic SAR when I accelerate it not based on the difference from the extreme point but based on current ATR. So the idea is that for a more volatile market it should move faster.
Performance is calculated based on 25% equity invested and 0.1% commission.
What do you think about it? Does it make sense to do something like that?
Do you have in mind other ways I can accelerate it when the market starts to be more volatile?
Disclaimer
Please remember that past performance may not be indicative of future results.
Due to various factors, including changing market conditions, the strategy may no longer perform as good as in historical backtesting.
This post and the script don’t provide any financial advice.
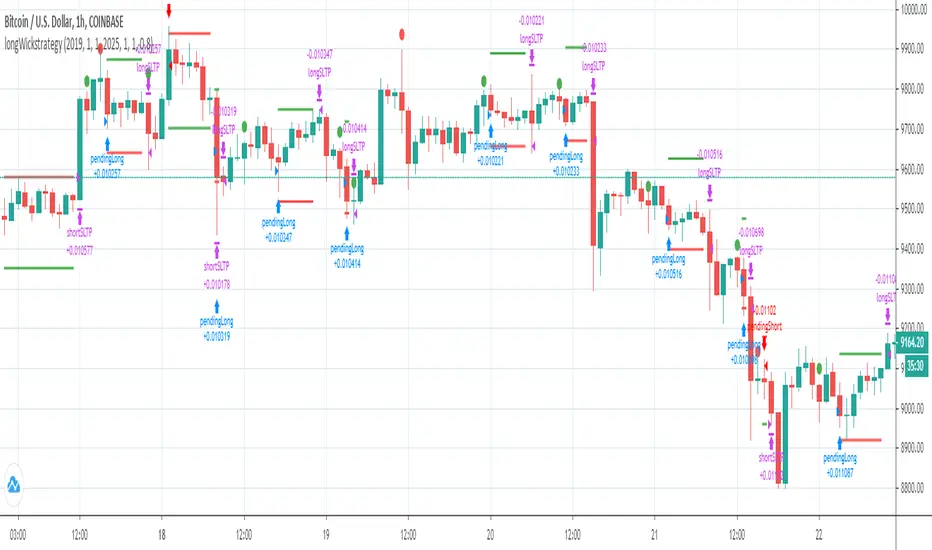
Twin Range Filter Algo@Colinmck used two different ranges to generate signals. Read his release notes to find out what the original script does.
I added one condition which seems to increase performance on 15m BTCUSD as well as 1h BTCUSD and that is ATR with 32 periods being smaller than ATR with 64 periods. I used my script Volatility Optimiser to discover this tendency.
Both buying and selling conditions are same as in @Colinmck's script plus one condition of my own. You can disable my condition.
Target and stop-loss are manually set values in ticks.
Time stop-loss is manually set value in a number of candles. After this number of candles, a position always exits (or should 😇). You can disable it by inserting a very long period. I do not recommend it, because a value of indicator should not be measured in luck and if market starts moving in the direction after 40 periods, the predictive capability of an indicator is questionable.
I used 300/150/17 for 15m BTCUSD chart and 900/30/17 for 1h BTCUSD. I didn't try to optimize any other parameters for these periods.
Since this script relies mostly on volatility for its prediction, I wouldn't recommend using it on its own. Individual approach to the market is recommended. Also, it didn't work on EURUSD when using the same default values and different order management (tp, sl, time sl), so it is probably not as versatile.
Let me know what do you think of this strategy. If you have some ideas about how to make it more reliable, share it in the comments, I might put it to the test. Good luck 🍀

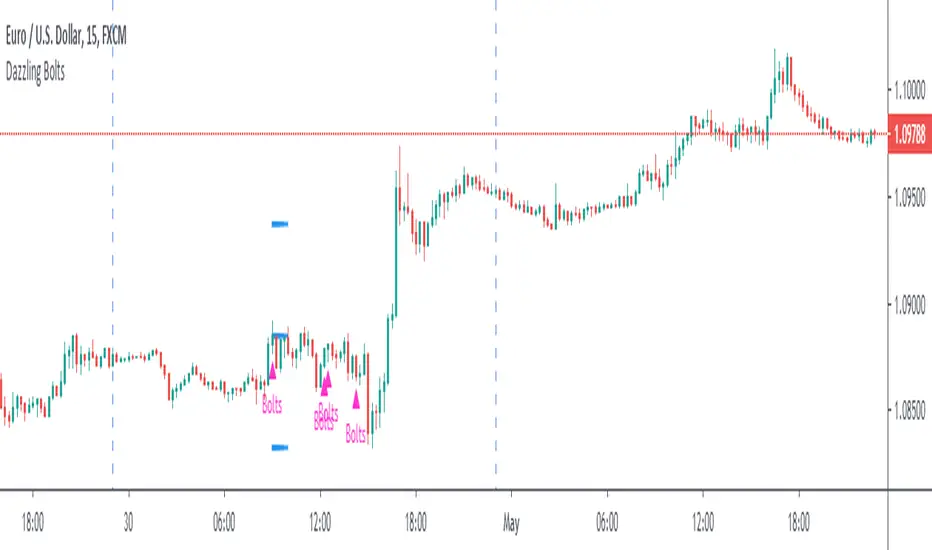
Dazzling BoltsThis is three moving average based strategy focused on trend-following. Targets and stops are set based on ATR. Following image pictures the strategy with all mas plotted:
Buying conditions are:
►A smoothened moving average (red) is above the exponential moving average (yellow)
►An exponential moving average is above simple moving average (black)
►Low five candles ago was still above the exponential moving average
►Low two candles ago reached below the exponential moving average
►Close of the previous candle was above the exponential moving average
►Ema force is disabled or exponential moving average set candles ago (orange) is still above simple moving average now.
If these conditions are met, Dazzling Bolts will always give you a signal. However, it holds only one position at a time and it will not buy again until it is closed or exited.
There are two ways exiting may happen. Smoothened moving average crosses below simple moving average or it reaches value based on your settings of average true range and its multiplier.
Settings 10/76/200/true/50/true/true/5/5 shows perfect results on EURUSD 15m chart but it does not guarantee the results. It is only 62 trades which is barely a useful statistical source. It is also highly optimized which means its settings filters out bad trades that may be bad only because of randomnation rather than set market behaviour. You need to test it on 200 trades + before using.
Trailing SL Strategy [QuantNomad]I'm a big fan of simple strategies.
This one is a very simple one. So it consists only from one Trailing SL. When SL is hit, the position is reversed and SL is tracked for a new position.
You can choose one of 3 types of SL:
% of your price
ATR - it is calculated as current ATR * multiplier
Absolute
As you can see even this simple strategy can show pretty good results.
[LunaOwl] 超級趨勢2 (SuperTrend2)It is very similar to the previous version. I changed the function from study to a strategy, and added the Average true range to RMA again.
I don't know the academic suitability, but using this strategy to trade the Altcoins market may have a good effect.
refer to Binance for 0.1% of fees, starting from Q4 2017.
跟以前的版本變化不大,我將腳本函數從"study"更改為"strategy",然後將平均真實範圍再次用遞迴平均線均化數值。
不知道學術上的適不適合這麼做...但是,直到目前交易小幣現貨市場,效果還算不錯,用用看。
交易手續費參考幣安小幣,0.1%,從2017年第四季開始測。
Updated:
--1. use RMA to reduce ATR noise.
--2. for the highly volatile Altcions market, strategy should focus on reducing noise.
--3. the Street commonly used alpha filtering for Random Walk.
--4. compared to other MAs, the performance is not outstanding, but the advantage is stability.
--5. I choose the 4H time frame to test the Altcoins (ex: ETH).
稍做更新:
--1.平均真實區間利用了遞迴均線減少雜訊
--2.針對高波動率的小幣市場,中期順勢策略應該以減少雜訊為重點
--3.研究國外交易策略後,它們常用平滑因子過濾隨機走勢
--4.績效上和其它平均法比較並沒有突出,但優點是參數變動穩定性
--5.我選擇四小時線回測小幣市場,並且選擇經歷過牛熊市的以太坊
The purpose of publishing Chinese Scripts is to make Pine close to more Chinese user.
發布中文腳本的目的,是希望可以讓 Pine 親近更多中文圈的使用者。


ATR Strategy FOREX for long only with market filterI did a modification and added a market filter and changed to buy only. It showed a remarkable good result by doing so. It make sense, since upptrends and downtrends behave different and a strategy that includes both buying and selling will do poorly in general.

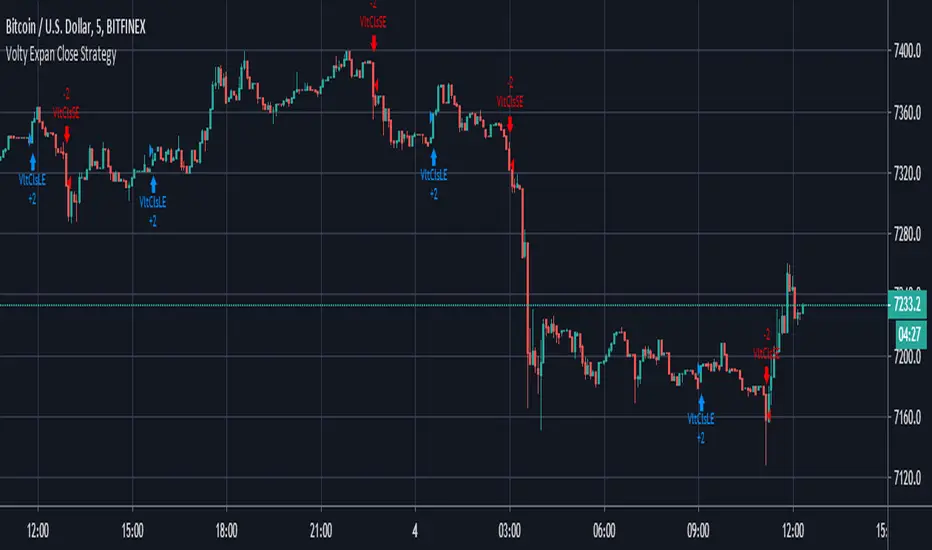
Volty Expan Close Strategy with Backtest Date RangeInput Information
Length Numeric 5 Number of bars used to determine the average true range.
NumATRs Numeric .75 Factor used to calculate a percentage of the average true range, used to
Long and short entry based on a percentage of price movement beyond the average range.
Profitable and simple strategy..
ANN RSI SUPER TREND STRATEGY BY che_traderCreate a strategy for the good indicator created by @RafaelZioni
Which is composed of ANN data taken from
and the super trend shared by www.tradingview.com
Feel free to share and copy this script!
Enjoy!

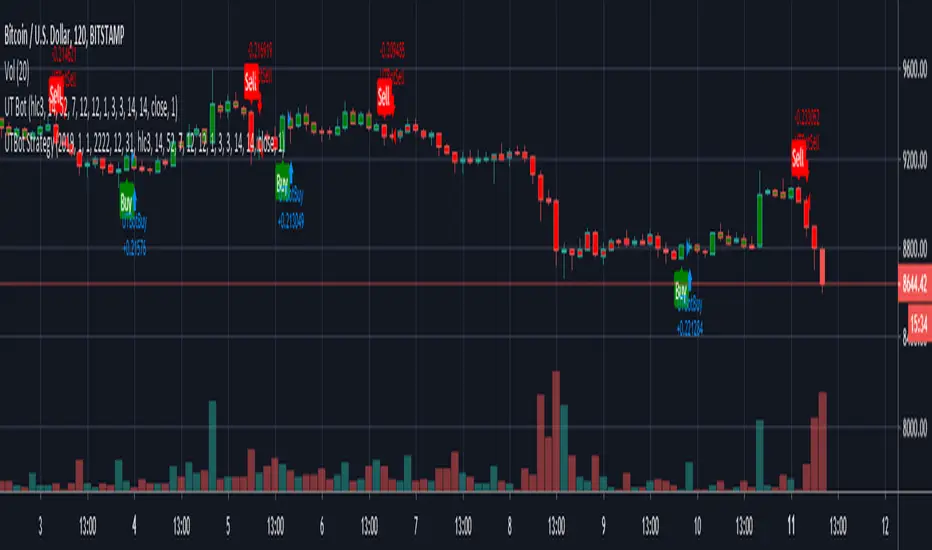
UT Bot StrategyUT Bot indicator was inially developer by @Yo_adriiiiaan
Idea of original code belongs @HPotter
I just took code of Yo_adriiiiaan, cleaned it, deleted all useless pieces of code, transformet to v4 and created a strategy from it.
Also I added an input that allows you to swich to signals from Heiking Ashi. I saw that author uses HA for the indicator and on HA it look much nices then on real candles.
Do not add this strategy to HA candles, use usual candles and this checkbox.
Original script:

Kirk65 UTBot Strategy FixedCredits to @HPotter for the orginal code.
Credits to @Yo_adriiiiaan for recently publishing the UT Bot study based on the original code.
Credits to @TradersAITradingPlans for making UT Bot strategy.
Strategy fixed with time period by Kirk65.
UT Bot works great with 2 hour time frame with Heikin Ashi, but riskier. Use "Once per bar" In alerts with 1.5% stoploss. If the price goes against Alerts, stoploss will save your assets. Wait until next Alert.
4 hour time frame is less risky and less profitable.
Happy trading..
Kirk65
SuperTrend Strategy This is almost the same strategy that Alex Orekhov (everget) sells to unnoticed newbies... The only thing he added was a tool that analyses the better performance of the indicator, that is the difference from his script, and i dont have it here, what i have is what is freely distributed in many communities... But as i follow him for more than 1 year i saw that theese configs. In more than 95% of the time range betweern 7.2-6.8 with the most common settings the 7-7
So i made a description of each part of the code that i WRITED and is free and i am just using the configs that are public in Alex Orekhov (everget) profile. If it is public the configs he use in his charts and he is not the owner of the code right? Also the code is very easy to find in google in the MQL5 community or in a lot of videos in youtube.
He charges $10 for a 4 day trial (LOL) and $100 for this shit.
Here is a strategy that has a correlation with 95% of the time of the Profitable Strategy that he sells.
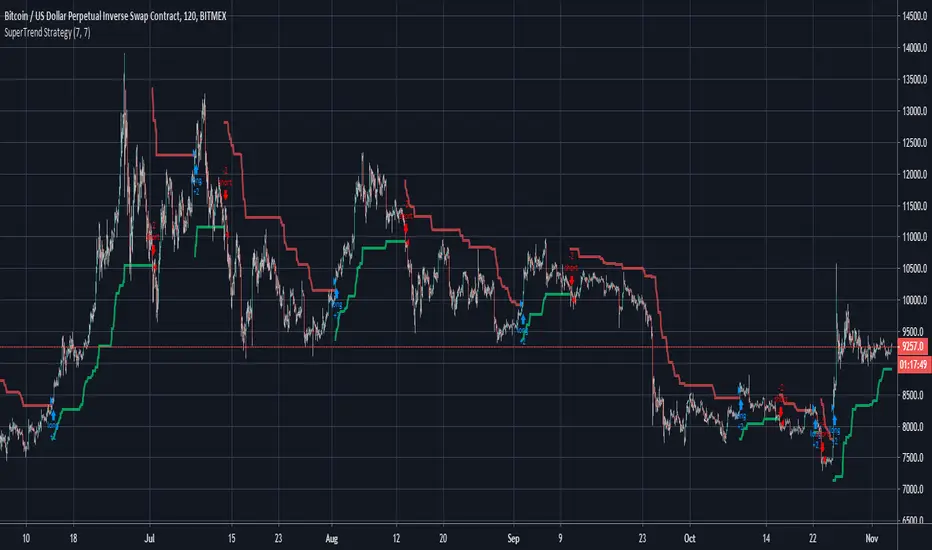
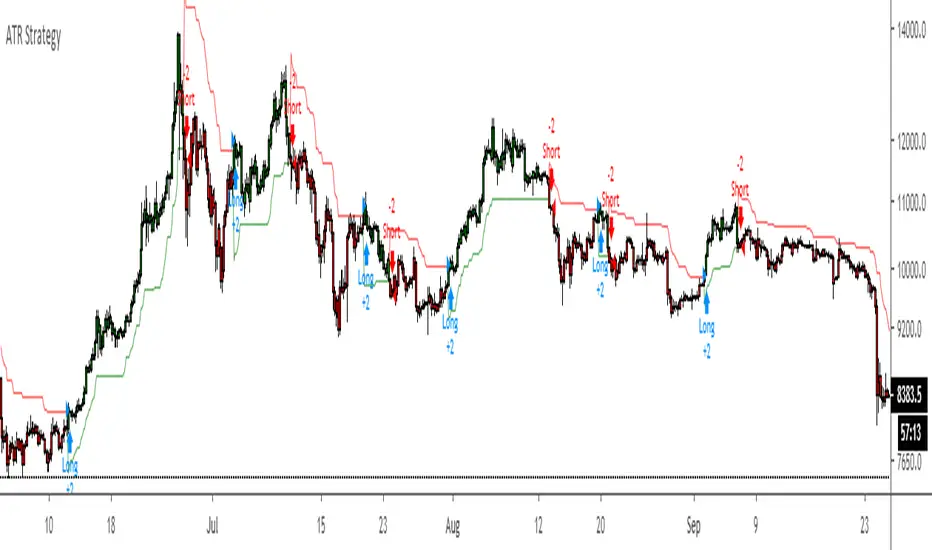
ATR Strategy Back test Original script by HPotter
ATR strategy is profitable.
Buy when it says buy and sell when it says sell.
Simple EMA Long Only StrategySimple EMA long only strategy, using ATR on crossings to minimize fake signals.
