MACD Box V6.3 (Right Labels)Using the dual MACD indicator, identify the range formed by high-volume MACD candlesticks. Then, use fractals formed by three or five candlesticks to identify trends formed by two consecutive fractals.
Jalur dan Saluran

Context Bundle | VWAP / EMA / Session HighLow (v6)
📌 0DTE Context Bundle (v6)
**VWAP • EMA Cloud • Session High/Low (NY / London / Asia)
The **0DTE Context Bundle** is a *decision-making overlay*, not a signal spam indicator.
It’s designed to help traders clearly see **value, trend, and liquidity levels** across **New York, London, and Asia sessions** — all in one clean, customizable tool.
Built for **NQ, ES, Gold, and FX pairs**, with a focus on **5–15-minute execution charts**.
---
## 🔹 What This Indicator Shows
### ✅ VWAP + ATR Bands
* Session VWAP (fair value)
* ATR-based extension bands (1x / 2x)
* Helps identify **overextension, mean reversion zones, and trend pullbacks**
### ✅ EMA 9 / 21 Cloud
* Visual trend and momentum filter
* Custom colors + opacity
* Identifies **trend continuation vs chop**
### ✅ Session High / Low Levels
* **New York RTH**
* **London**
* **Asia (midnight-safe)**
* Optional previous session highs/lows
* Adjustable line styles, widths, colors, and extensions
### ✅ Anchored VWAP (Optional)
* Reset by:
* Daily
* NY session start
* London session start
* Asia session start
* Useful for tracking **session-specific value shifts**
---
## 🔹 How Traders Use It
This indicator is meant to answer:
* *Are we trading at value or extension?*
* *Is the market trending or rotating?*
* *Where is liquidity likely sitting right now?*
Common use cases:
* Trend pullbacks into VWAP or EMA cloud
* Reversal setups at session highs/lows
* Session breakout + retest confirmation
* Overnight context for London and Asia sessions
---
## 🔹 Customization & Flexibility
Every component can be toggled and styled:
* Colors, widths, line styles
* Cloud up/down colors + opacity
* Session visibility and extensions
* VWAP band multipliers and ATR length
Members can adapt it to **their own style**, market, and timeframe.
---
## ⚠️ Disclaimer
This indicator is provided for **educational and informational purposes only**.
It does **not** provide financial advice or trade signals.
Always manage risk and confirm entries with your own strategy.

Ultimate MTF//@version=5
indicator("Ultimate MTF", shorttitle="Ultimate MTF", overlay=true)
// ============== EMA 13 (Court Terme - Accélérateur) ==============
ema13_enabled = input(true, title="Enable EMA 13", group="EMA 13")
ema13_period = input.int(13, title="EMA 13 Period", minval=1, group="EMA 13")
ema13_color = input(color.new(#FF6B35, 0), title="EMA 13 Color", group="EMA 13")
// ============== EMA 21 (Court Terme - Signal) ==============
ema21_enabled = input(true, title="Enable EMA 21", group="EMA 21")
ema21_period = input.int(21, title="EMA 21 Period", minval=1, group="EMA 21")
ema21_color = input(color.new(#004E89, 0), title="EMA 21 Color", group="EMA 21")
// ============== SMA 50 (Moyen Terme - Zone de Vérité) ==============
sma50_enabled = input(true, title="Enable SMA 50", group="SMA 50")
sma50_period = input.int(50, title="SMA 50 Period", minval=1, group="SMA 50")
sma50_color = input(color.new(#F7931E, 0), title="SMA 50 Color", group="SMA 50")
// ============== SMA 200 (Long Terme - Juge de Paix) ==============
sma200_enabled = input(true, title="Enable SMA 200", group="SMA 200")
sma200_period = input.int(200, title="SMA 200 Period", minval=1, group="SMA 200")
sma200_color = input(color.new(#43A047, 0), title="SMA 200 Color", group="SMA 200")
// ============== FUNCTION TO CALCULATE MA ==============
calcMA(period, maType, source) =>
switch maType
"SMA" => ta.sma(source, period)
"EMA" => ta.ema(source, period)
=> ta.ema(source, period)
// ============== CALCULATE MOVING AVERAGES ==============
ema13_value = ta.ema(close, ema13_period)
ema21_value = ta.ema(close, ema21_period)
sma50_value = ta.sma(close, sma50_period)
sma200_value = ta.sma(close, sma200_period)
// ============== PLOT MOVING AVERAGES ==============
plot(ema13_enabled ? ema13_value : na, title="EMA 13", color=ema13_color, linewidth=2)
plot(ema21_enabled ? ema21_value : na, title="EMA 21", color=ema21_color, linewidth=2)
plot(sma50_enabled ? sma50_value : na, title="SMA 50", color=sma50_color, linewidth=2)
plot(sma200_enabled ? sma200_value : na, title="SMA 200", color=sma200_color, linewidth=2)

MTF 5 Moving Averages//@version=5
indicator("Multi-Timeframe 5 Moving Averages", shorttitle="MTF MA x5", overlay=true)
// ============== MOVING AVERAGE 1 ==============
ma1_enabled = input(true, title="Enable MA1", group="Moving Average 1")
ma1_period = input.int(9, title="MA1 Period", minval=1, group="Moving Average 1")
ma1_type = input.string("EMA", title="MA1 Type", options= , group="Moving Average 1")
ma1_color = input(color.new(#FF6B35, 0), title="MA1 Color", group="Moving Average 1")
// ============== MOVING AVERAGE 2 ==============
ma2_enabled = input(true, title="Enable MA2", group="Moving Average 2")
ma2_period = input.int(20, title="MA2 Period", minval=1, group="Moving Average 2")
ma2_type = input.string("EMA", title="MA2 Type", options= , group="Moving Average 2")
ma2_color = input(color.new(#004E89, 0), title="MA2 Color", group="Moving Average 2")
// ============== MOVING AVERAGE 3 ==============
ma3_enabled = input(true, title="Enable MA3", group="Moving Average 3")
ma3_period = input.int(50, title="MA3 Period", minval=1, group="Moving Average 3")
ma3_type = input.string("SMA", title="MA3 Type", options= , group="Moving Average 3")
ma3_color = input(color.new(#F7931E, 0), title="MA3 Color", group="Moving Average 3")
// ============== MOVING AVERAGE 4 ==============
ma4_enabled = input(true, title="Enable MA4", group="Moving Average 4")
ma4_period = input.int(100, title="MA4 Period", minval=1, group="Moving Average 4")
ma4_type = input.string("SMA", title="MA4 Type", options= , group="Moving Average 4")
ma4_color = input(color.new(#1E88E5, 0), title="MA4 Color", group="Moving Average 4")
// ============== MOVING AVERAGE 5 ==============
ma5_enabled = input(true, title="Enable MA5", group="Moving Average 5")
ma5_period = input.int(200, title="MA5 Period", minval=1, group="Moving Average 5")
ma5_type = input.string("EMA", title="MA5 Type", options= , group="Moving Average 5")
ma5_color = input(color.new(#43A047, 0), title="MA5 Color", group="Moving Average 5")
// ============== FUNCTION TO CALCULATE MA ==============
calcMA(period, maType, source) =>
switch maType
"SMA" => ta.sma(source, period)
"EMA" => ta.ema(source, period)
"WMA" => ta.wma(source, period)
=> ta.sma(source, period)
// ============== CALCULATE MOVING AVERAGES (CHART TIMEFRAME ONLY) ==============
ma1_value = calcMA(ma1_period, ma1_type, close)
ma2_value = calcMA(ma2_period, ma2_type, close)
ma3_value = calcMA(ma3_period, ma3_type, close)
ma4_value = calcMA(ma4_period, ma4_type, close)
ma5_value = calcMA(ma5_period, ma5_type, close)
// ============== PLOT MOVING AVERAGES ==============
plot(ma1_enabled ? ma1_value : na, title="MA1", color=ma1_color, linewidth=2)
plot(ma2_enabled ? ma2_value : na, title="MA2", color=ma2_color, linewidth=2)
plot(ma3_enabled ? ma3_value : na, title="MA3", color=ma3_color, linewidth=2)
plot(ma4_enabled ? ma4_value : na, title="MA4", color=ma4_color, linewidth=2)
plot(ma5_enabled ? ma5_value : na, title="MA5", color=ma5_color, linewidth=2)

Fixed 5 Point Levels 21 Lines Stable by Pie789The 500-point lines (upper and lower) don't need to be drawn manually. Simply define the center point and adjust it afterwards to create a 500-point frame.

[iQ]PRO Grand Unified Theory Bands+PRO Grand Unified Theory Bands+ (GUT+)
Welcome to the pinnacle of market state analysis. The PRO Grand Unified Theory Bands+ is not just an indicator; it is a multi-dimensional analytical engine designed to synthesize complex mathematical disciplines into a singular, actionable visual interface.
By merging Quantum Signal Processing, Chaos Theory, and Adaptive Cycles, this tool provides a high-fidelity view of market structure that remains invisible to standard retail indicators.
### The Science of Precision
The GUT+ framework operates on a proprietary sequence of six specialized computational layers, ensuring that every signal is filtered for noise and synchronized with the current market rhythm.
Non-Linear Time Warping: Utilizing advanced Laguerre geometry to smooth price action without the catastrophic lag associated with traditional moving averages.
Haar Wavelet Decomposition: We strip away the "market noise" using multi-level wavelet transforms, isolating the core trend from chaotic price fluctuations.
Discrete Fourier Analysis (DFT): The system continuously scans for the dominant market cycle, ensuring the bands expand and contract based on real-time frequency rather than static lookback periods.
State Estimation (Kalman Physics): An adaptive tracking algorithm that predicts the most likely "true" price position by minimizing the recursive variance between signal and noise.
Feigenbaum Bifurcation Logic: Derived from Chaos Theory, our volatility bands use universal constants to identify "bifurcation points"—critical levels where price is mathematically forced to make a directional decision.
MESA Adaptive Engine: Incorporating Hilbert Transforms and MAMA/FAMA logic to track phase transitions, allowing the tool to distinguish between trending and cyclical market environments.
### Key Features & Visual Intelligence
PRO GUT+ translates complex data into a simplified color-coded system, allowing you to read the market state at a glance:
Visual Element Market Interpretation
Golden Yellow Zone Strong Bullish Expansion: Momentum and Trend are perfectly aligned.
Electric Fuchsia Zone Strong Bearish Contraction: Aggressive selling pressure is dominant.
Deep Sea Blue Reversal/Retracement Warning: Systems are diverging; a trend shift is imminent.
Neon Green Flash Breakout Pending: Volatility is compressed to a critical threshold (The "Squeeze").
Circles (Bifurcation) Mathematical Extremes: High-probability exhaustion points.
⚡ Unified Signal Logic
The "Unified Buy/Sell" labels represent the rare alignment of the Laguerre Smoothing, MESA Phase Analysis, and Fourier Cycle Alignment. When these systems reach confluence, the indicator identifies high-conviction entry and exit zones.
### The PRO Data Suite
The real-time dashboard (top right) provides a deep-dive into the current "DNA" of the asset, including:
Dominant Fourier Cycle: The current rhythmic heartbeat of the market.
MESA/Hilbert Periods: Real-time cycle length for adaptive precision.
Market State Engine: A proprietary classification (Neutral, Strong Bull, Breakout Ready, etc.) powered by our internal logic.
### Usage & Access
This tool is part of the MarketMakerIQ Professional Suite. It is designed for traders who require institutional-grade data processing to stay ahead of retail lag.
Optimized For: All timeframes (Scalping to Position Trading).
Asset Classes: Forex, Crypto, Indices, and Equities.
Access: This is a Closed-Source, Invite-Only script.
Note: To maintain the integrity of our proprietary models and prevent market saturation, access is restricted to authorized members of MarketMakerIQ.

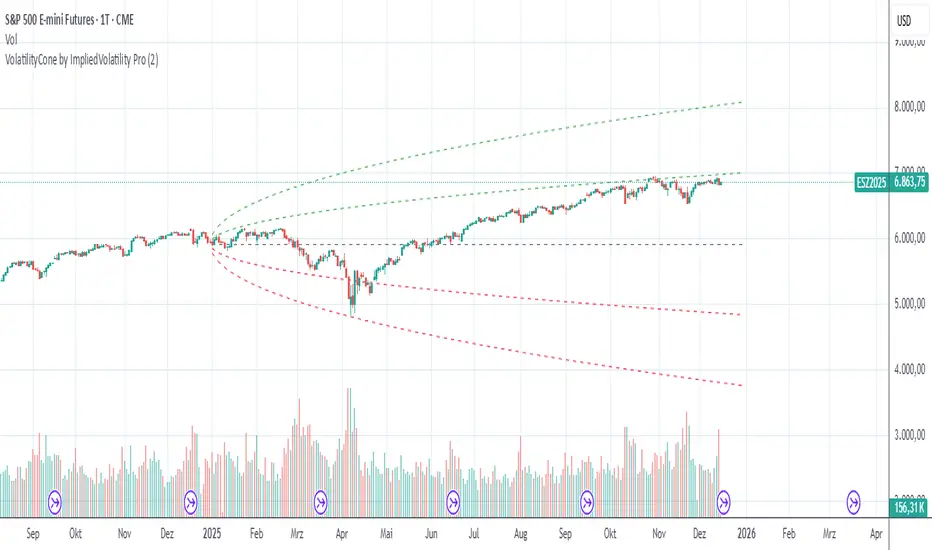
VolatilityCone by ImpliedVolatility ProVolatilityCone by ImpliedVolatility Pro
VolatilityCone by ImpliedVolatility Pro is a forward-looking volatility projection tool that visualizes expected price ranges based on implied volatility.
It draws a volatility cone starting from a user-defined date and projects statistically expected price boundaries into the future using standard deviation theory.
🔍 What does this indicator do?
This indicator calculates and plots price ranges that represent ±1, ±2, and ±3 standard deviations from a starting price, based on implied volatility.
The result is a cone-shaped projection that shows where price is statistically likely to move over time.
In addition, the indicator calculates a Z-Score, showing how far the current price deviates from the expected mean in volatility terms.
📐 Key Features
→ Forward projection based on implied volatility
→ Supports up to 3 standard deviation levels
→ Optional display of half standard deviation levels
→ Manually enter implied volatility or automatically fetch IV from another symbol (e.g. VIX)
→ Custom Start Date
→ The cone starts exactly at the selected date
→ Ideal for earnings, events, or cycle-based analysis
→ Displays the statistical mean price
→ Z-Score indicates how extreme the current price is relative to the cone
📊 How to Use
Price inside the cone
→ Normal volatility behavior
Price near ±1σ
→ Typical volatility range
Price near ±2σ or ±3σ
→ Statistically stretched or extreme conditions
Positive Z-Score
→ Price trading above the mean
Negative Z-Score
→ Price trading below the mean
This makes the indicator useful for:
→ Volatility analysis
→ Mean reversion strategies
→ Risk assessment
→ Event-based forecasting
→ Options-related analysis
⚙️ Notes & Disclaimer
This indicator is not a prediction tool, but a statistical projection
It assumes volatility follows a square-root-of-time model
Best used as a context tool, not as a standalone trading signal
AlgosPoint G&MPoint Breaking 2025 (MB&GB Breaking Point Pro)
What It Does:
A comprehensive TradingView indicator that combines multiple technical analysis tools to identify key market breakout points, support/resistance levels, and trading opportunities. It integrates Volume Profile analysis, AlphaTrend signals, and custom risk assessment metrics.
Key Features:
Volume Profile Analysis: Displays Point of Control (POC), Value Area High/Low (VAH/VAL), and volume distribution
Support & Resistance Detection: Automatically identifies key price levels based on volume or price action
AlphaTrend Signals: Generates BUY/SELL signals with visual labels on chart
Volume Spike Detection: Highlights unusual volume activity indicating potential exhaustion or breakout
High Volatility Alerts: Marks periods of increased market volatility using ATR
Risk Assessment Dashboard: Real-time panel showing:
Long/Short percentages (RSI-based)
Stop levels for both directions
Bot activity percentage
Csocy Signal status (Safe/Undecided/Risky)
How to Use:
Add to Chart: Apply indicator to any timeframe (works best on 15m-4H)
Configure Settings: Adjust parameters in grouped sections:
📊 General Settings (lookback periods)
🎯 Support & Resistance (line styles/colors)
💥 Volume Spike (threshold sensitivity)
⚡ High Volatility (ATR multiplier)
📈 Volume Profile (display options)
🔥 AlphaTrend (signal sensitivity)
Read Signals:
BUY label = Potential long entry when AlphaTrend crosses up
SELL label = Potential short entry when AlphaTrend crosses down
Dashboard colors: Green = bullish, Red = bearish, Yellow = neutral
Set Alerts: Built-in alerts for price crosses, volume spikes, and signal confirmations
Risk Management: Use displayed stop levels and Csocy Signal status to manage position sizing
Best For:
Day traders and swing traders
Crypto, Forex, and Stock markets
Identifying high-probability breakout zones
Volume-based trading strategies

Daily High Breakout Strategy v2Long trade signal strategy, connects via API key to any exchange, can be used as an indicator. Based on breakout, rebound from daily highs.

Macro-Filtered Volatility Breakout (MVB)策略簡介:
這是一套專門針對高 Beta 值資產(如 ETH, SOL 等山寨幣)設計的趨勢跟隨系統。我們解決了傳統突破策略在山寨幣市場中「假突破(False Breakout)」過多的痛點。
核心邏輯:
市場體制過濾(Regime Filtering): 加密貨幣市場具有高度的相關性。本策略引入比特幣(BTC)作為**「宏觀市場指標」**,只有當 BTC 處於確立的多頭趨勢時,才允許執行山寨幣的做多信號。這有效規避了「大盤崩盤時,小幣假突破」的系統性風險。
動態波動率通道: 我們不使用固定價格止損,而是採用肯特納通道(Keltner Channels)。這利用 ATR(平均真實波幅)動態調整進出場區間:在市場平靜時通道收窄以敏銳捕捉啟動點,在劇烈波動時通道放寬以避免被雜訊洗出場。
風控特徵:
系統性避險: 透過 BTC 趨勢濾網,在熊市或大盤回調期間自動空手,降低回撤。
獲利奔跑(Let Profits Run): 採用基於波動率的移動止損(Volatility Trailing Stop),在大趨勢中能吃到完整的魚身。
免責聲明:
以上策略分享僅供學術研究、回測實驗與邏輯參考,並不代表對未來獲利的保證。 過往的回測績效不代表未來的行情表現。本文內容不構成任何投資建議。加密貨幣交易具有高度風險,使用者應自行評估風險承受能力並自負盈虧,本人不承擔任何因使用此策略而產生的資金損失。
Strategy Overview
This is a trend-following system specifically designed for high-beta assets, such as altcoins like ETH, SOL, and similar cryptocurrencies. The strategy addresses a key weakness of traditional breakout systems in altcoin markets—the high frequency of false breakouts.
Core Logic
Market Regime Filtering
The cryptocurrency market exhibits strong cross-asset correlation. This strategy uses Bitcoin (BTC) as a macro market indicator. Long signals on altcoins are only allowed when BTC is in a confirmed bullish trend, effectively avoiding the systemic risk of altcoin false breakouts during broader market downturns.
Dynamic Volatility Channels
Instead of fixed-price stop losses, the strategy employs Keltner Channels, which adapt dynamically using ATR (Average True Range).
During low-volatility conditions, the channel narrows to sensitively capture early trend initiation.
During high-volatility environments, the channel widens to prevent premature exits caused by market noise.
Risk Management Features
Systematic Risk Avoidance
By applying BTC trend filtering, the strategy automatically stays in cash during bear markets or major market pullbacks, significantly reducing drawdowns.
Let Profits Run
A volatility-based trailing stop is used to maximize profit capture during strong directional trends, allowing positions to benefit from the full trend structure.
Disclaimer
The strategy presented above is for academic research, backtesting experiments, and logical reference only. It does not constitute a guarantee of future performance. Past backtest results are not indicative of future outcomes. This content does not represent any investment advice. Cryptocurrency trading involves substantial risk, and users should assess their own risk tolerance and assume full responsibility for any gains or losses. The author bears no liability for any financial losses incurred from the use of this strategy.

Chartology Strategy+🔍 Chartology Strategy+
This tool provides a comprehensive way for users to analyze trend levels and access other Matrix features across selected tickers and timeframes. Results can be tailored by strategy, with the option to filter displayed tickers based on custom user‑defined rules.
Bullish & Bearish Entry Signal (Safe & Scalping).
Entry Level, SL, T-SL & Two TP Levels (Based on Possible Movement).
Dashboard Table for Easy Presentation of All Levels.
Timeframe Scanner for Current Signal (Trend) on Different Timeframes.
Gap Up & Gap Down for Untraded Price Marking.
Institutional Candles for High Volume and Big Price Movement.
Neutral Candle for Low Volume and Small Price Movement.
Supply Demand (Based on Swing High & Low).
Mega Trend Band (Based on HMA) for Overall Trend.
🟢 Bullish & Bearish Entry Signals
Shows the expected direction of the symbol. It shows Bullish and Bearish direction mark on Chart. Entry Level is Closing of the Candle.
Input Settings
Signal Type: Safe
Appears after a proper trend confirmation.
Low frequency, fewer signals, but more reliable.
Best for swing traders who want strong confirmation before entering.
Signal Type: Scalping
Appears frequently during small downward moves.
High frequency, quick signals for short-term trades.
Best for intraday
Traders who want multiple opportunities in small movements.
🎯 Entry Level, SL, T-SL & TP Levels
Generated based on price movement and trend range.
Levels on Chart
Entry Level: Closing price of the candle where the signal appears.
SL (Stop Loss): Maximum risk allowed for the trade.
TSL (Trailing SL): Dynamic SL to reduce risk and lock profits.
Level 01: First TP level with 1:1 risk-reward ratio. Used for partial booking.
Level 02: Final TP level for full exit.
Input Settings
Levels: You can Increase or Decrease Level Amount for the Level 2.
Risk: You can Increase or Decrease Stop Loss (SL).
📊 Dashboard Table for Easy Presentation of All Levels.
Displays all key levels and metrics in one place:
Metrics
Symbol Name Shows the name of the current chart (e.g., NIFTY, BANKNIFTY).
Bar Age Displays the How many candles (Bars) before Latest signal appears.
Entry Shows the entry level where the latest bullish or bearish signal was generated.
Level 1 (TP1) First target level, based on 1:1 risk-reward ratio. Used for partial booking to secure profits.
Level 2 (TP2) Final target level where you can exit the remaining position.
SL (Stop Loss) Shows the maximum risk limit for the trade. Helps you control losses.
MTM (Mark to Market) Shows the difference between CMP and Entry Level. Helps track how far price has moved since entry.
P&L (Profit & Loss) Shows the difference between Entry and Target Level achieved. Helps measure actual gain or loss.
Date & Time Displays when the latest bullish or bearish signal was generated. Helps check how old or fresh the signal is.
Timeframe Scanner or Current Signal (Trend) on Different Timeframes. Shows the current signal across multiple timeframes.
Row 1 Fixed signals for 1M and 3M.
Row 2 Any 2 Custom Timeframes chosen in input settings.
Traders use this to confirm signals across different timeframes before entering trades. Example If the Day trend is bullish but the 15M chart shows bearish, many traders avoid that trade.
🚦 Gap Up & Gap Down for Untraded Price Marking.
Marks untraded price zones where price may react.
Gap Up & Down Flag Mark
Gap Up: Bullish Bias, Marked Green flag, plotted when candle opens above previous high.
Gap Down: Bearish Bias, Marked as Red flag, plotted when candle opens below previous low.
Input Settings
Enable / Disable from Chart
Threshold: Minimum gap size Threshold to detect
🟡 Institutional Candles for High Volume and Big Price Movement
Indicate strong price movement with high volume.
Marking
Displayed as Yellow Body Candles
Helps identify zones where big players are active.
Input Settings
Enable / Disable from Chart
Body %: Compare of Open & Close with High & Low
Size %: Compare Total Candle Size from Past Range
Volume %: Compare Total Candle Volume from Past Range
⚪ Neutral Candle for Low Volume and Small Price Movement
Shows low volume and minimal price movement.
Marking
Displayed as Hollow Body Candles
Traders usually avoid trading during these candles.
Input Settings
Enable / Disable from Chart.
Candle %: Compare Size of candles.
Volume %: Compare Volume of Candles from Previous Range.
🟥🟩 Supply Demand Zones (Based on Swing High & Low).
Based on swing highs and lows to identify possible reversals.
Zones
🟥Supply Zone: Near swing high, marked with Light Red Zone.
🟩Demand Zone: Near swing low, marked with Light Green Zone.
Input Settings:
Bars Left: How many past Bars Swing will Calculate.
Bars Right: After How many Bars, Zone will plot.
Max Zones: Number of Supply or Demand Zone want to plot on Chart
Delete Breaked Zones: Want to see Disappeared Zone, Uncheck it.
Extend Right: Want to see till End of the Chart, Uncheck it.
📈 Mega Trend Band (Based on HMA) for Overall Trend
Based on HMA (Hull Moving Average) to show overall trend and Help in Filters out trades against the main trend.
Working
Price above band → Bullish trend
Price below band → Bearish trend
Input Setting
Enable / Disable from Chart
HMA Period Setting: 45
👓 How to Use All together for Better Confidence.
🔍Watch for the New Entry icon on the chart.
Find New Signals with help of Automated Alerts.
Check Entry Level, SL, Level 1 and Level 2 (TP2).
Verify Date & Time → how fresh the signal is. Signal not too old.
🧭 Signal is not Self Sufficient for Good Accuracy. So, we suggest a few rules.
Cross‑Check Current Signal with Timeframe Scanner. Trade only when smaller timeframe aligns with bigger trend. (e.g., If Day = Bullish ▲ but 15M = Bearish ▼, avoid entry. Trend may not be stronger.)
Validate with Market Context of Gap. (e.g., If new signal came on Gap Up / Gap Down, avoid entry. Price may reverse.)
Zone Awareness Use Supply Demand zones to refine entries/exits and avoid false signals. (e.g., Entry: If any zone is available between Entry and Level 01, Avoid trade until Zone breaked, Exit: If Zone create between the trade, modify SL according to T-SL and wait.
Trend Filter of overall direction. (e.g., If Mega Trend Band Bullish and Trend is Bearish, Avoid the Trade.)
🕵🏻 Quick Checklist Before Trade
Bullish or Bearish signal?
Dashboard Table shows fresh entry?
SL defined and acceptable risk?
Timeframe Scanner aligned?
No Neutral candle interference?
Institutional candle or Gap supports move?
Supply/Demand zone not against trade?
✅ All Okay - Go for the ENTRY
Set a Proper Entry Point
Always respect SL, Good Trader Never avoid it.
Book partial profits at Level 1, It secure your Trade.
Keep Modifying your SL, According to T-SL Level.
On Level 2, Exit remaining All position for full profit.
📊 Healthy Trading Tips
Risk Small: Never risk more than 1–2% per trade.
Size Smart: Adjust position size to volatility and account size.
Diversify: Don’t put all money in one asset/sector.
Plan Ahead: Set entry, exit, and stop‑loss before trading.
Trade Less: Focus on quality setups, avoid overtrading.
Use Both Analyses: Combine technical charts with fundamental news/events.
Control Emotions: Stick to strategy, avoid fear/greed.
Journal Trades: Record reasons, outcomes, and lessons.
Stay Informed: Track economic calendars and global events.
Take Breaks: Step away after wins/losses to reset.
🎯 Advanced Discipline
Partial Exit: Book profits in stages (e.g., 50% at 1:1, 50% at Final Level).
Check News: Avoid trading during major announcements.
No Tweaks: Don’t change plan mid‑trade; wait for SL/TP.
Fixed Rules: Trade with fixed risk, fixed gains.
No Averaging Losses: Close bad trades, don’t add more.
Keep Learning: Evolve strategy with market changes.
Believe: Trust your plan and process.
Backtest: Practice setups until they’re second nature.
Daily Routine: Pre‑market Preparation, post‑market review.
Optimize Setup: Clean workspace, fast platform, no distractions.
Track Metrics: Win rate, average reward, expectancy, time of day, setup performance.
Trader Identity: Follow rules; money is a byproduct.
Liquidity Check: Avoid low‑volume instruments.
Respect Trend: Trade with momentum, not against it.
Avoid Over‑Leverage: Keep leverage low, avoid margin unless planned.
Risk Disclaimer
This content, including any tools, software, datafeeds, indicators, or scanners, is provided strictly for charting, educational, informational, and paper‑trading purposes only. It does not constitute investment advice, buy/sell recommendations, or real‑money trading strategies.
Not Advisors: We are not registered as investment advisors or research analysts.
Charting Only: Use is limited to testing strategies and evaluation; any application to real trading is at the user’s sole risk.
No Liability: No liability is accepted for financial loss, trading loss, or damages arising from use of the tools or data.
Data Limitations: Market data may be delayed, inaccurate, or incomplete. Past or hypothetical performance is not indicative of future results.
Signals Disclaimer: Automated signals are for evaluation only and should not be treated as accurate or real trading instructions.
High Risk: Trading and investing involve substantial risk and can result in losses beyond the initial capital.
Independent Judgment: Users must exercise independent judgment and consult licensed professionals before making financial decisions
⚠️ Final Note: Trading is speculative and may not be suitable for all investors. Use only risk capital and never invest money you cannot afford to lose.
✅ Always remember🧠 my 3R Rule💡: If the money💰 is yours then, RISK⚖️, REWARD🏆 and REGRET😔 are solely yours. 🔥

Market Compression & Entropy VectorOverview
This indicator measures market energy states and directional bias using concepts from information theory. It detects when markets are "coiling" (compression) versus "expanding" (decompression), and predicts early pivot points before they fully form.
Core Concepts
Compression-Decompression (0-1 scale)
Compression (blue): Low volatility, narrow ranges. Energy building for breakout.
Decompression (orange): High volatility, trending. Energy releasing.
Entropy Vector (-1 to +1)
Derived from buy/sell pressure using Shannon entropy:
Positive: Bullish bias (buyers dominating)
Negative: Bearish bias (sellers dominating)
Near zero: Indecision
Early Pivot Detection
Predicts reversals using 5 confluence factors:
Entropy vector crossing zero
Momentum exhaustion (rate of change reversal)
Compression exit (breakout from consolidation)
Price-entropy divergence
Extreme entropy readings
Signals
Signal Meaning
BUY Exiting compression with bullish entropy
SELL Exiting compression with bearish entropy
TOP (diamond) High probability of downward reversal
BTM (diamond) High probability of upward reversal
Key Settings
Pivot Sensitivity (1-10): Higher = more pivot signals
Pivot Score Threshold (30-90): Minimum score to trigger pivot marker
Compression/Decompression Thresholds: Define phase boundaries
Info Table
Displays real-time metrics including compression score, entropy vector, directional bias, and pivot prediction scores for tops/bottoms.
Best Use
Wait for compression phase (blue background)
Watch entropy vector for directional bias
Enter when pivot signal aligns with entropy direction
Use decompression phase for trend-following
Tags: entropy, compression, pivot detection, reversal, momentum, volatility

Delta Price Range BandsThis indicator uses the historical price delta range analysis method, perhaps known to some as HPDR thanks to YouTuber Krown.
To test the method and it's usability, I programmed my own version and put some more features into it, like a preview median price feature.

Triple VWAP: Anchored# Triple VWAP: Anchored + Last 2 Sessions
## 📊 Overview
**Triple VWAP** is a professional-grade Volume Weighted Average Price (VWAP) indicator designed for serious traders who need multi-timeframe volume analysis on a single chart. This indicator combines three powerful VWAP calculations: a custom **Anchored VWAP** from any historical date, a real-time **Current Session VWAP**, and **Previous Session VWAP** reference levels—all with configurable standard deviation bands.
Perfect for intraday traders, swing traders, and institutional-level analysis on Indian markets (Nifty, BankNifty) and global instruments.
***
## ✨ Key Features
### 🎯 Three Independent VWAP Calculations
**📍 Anchored VWAP (Long-term Reference)**
- Anchor VWAP from any specific date and time (year, month, day, hour, minute)
- Ideal for tracking price action from significant market events, earnings, or trend reversals
- Maintains accumulation from your chosen anchor point throughout the entire timeframe
**📅 Current Session VWAP (Real-Time)**
- Automatically resets at the start of each trading day
- Calculates dynamically as new bars form during the session
- Shows institutional trading levels and intraday fair value
**📆 Previous Session VWAP (Reference Levels)**
- Displays yesterday's final VWAP as horizontal reference lines
- Helps identify support/resistance zones from prior session
- Useful for gap analysis and opening range strategies
### 📐 Standard Deviation Bands
Each VWAP calculation includes optional standard deviation bands:
- **±1 SD** - Identifies normal price deviation zones
- **±2 SD** - Marks extreme price movements (high probability reversal zones)
- **±3 SD** - Ultra-extreme levels (rare price extensions)
Configure which SD levels to display for each VWAP type independently.
### 🎨 Customizable Visual Settings
- **Independent Color Schemes**: Assign unique colors to each VWAP type and its SD bands
- **Adjustable Line Widths**: Configure VWAP and SD line thickness (1-5 for VWAP, 1-3 for SD)
- **Plot Styles**: Previous session plots use cross-style for clear differentiation from real-time plots
- **Background Zones**: Optional colored zones when price extends beyond ±2 SD levels
- **Session Labels**: Automatic date labels marking each VWAP anchor point
### 📊 Information Dashboard
Real-time statistics table displaying:
- Current VWAP values for all three calculations
- Live standard deviation values
- ±1 SD levels for quick reference
- Distance from price to each VWAP (percentage format)
- Session tracking counter
- Color-coded proximity indicators
***
## 🔧 How to Use
### For Intraday Trading
1. **Current Session VWAP** acts as dynamic support/resistance—price above VWAP indicates bullish bias, below indicates bearish bias
2. Use **±1 SD bands** for profit targets and stop-loss placement
3. **±2 SD touches** often signal mean reversion opportunities
4. **Previous Session VWAP** provides overnight gap reference levels
### For Swing Trading
1. **Anchored VWAP** from significant events (breakouts, earnings, trend changes) shows institutional cost basis
2. Price trading consistently above/below anchored VWAP confirms trend strength
3. SD band rejections provide high-probability entry zones
### For Multi-Timeframe Analysis
1. Combine all three VWAPs to identify confluence zones
2. When current session VWAP aligns with previous session and anchored VWAP, expect strong support/resistance
3. Monitor distance percentage to gauge overextension
***
## ⚙️ Input Parameters
**📍 Anchored VWAP Configuration**
- `Enable Anchored VWAP` - Toggle on/off
- `Year, Month, Day, Hour, Minute` - Set your custom anchor point (requires confirmation)
**📅 Session VWAP Toggles**
- `Enable Current Session VWAP` - Toggle real-time daily VWAP
- `Enable Previous Session VWAP` - Toggle yesterday's reference VWAP
**General Settings**
- `VWAP Source` - Choose calculation source (default: HLC3)
- `Show ±1/2/3 SD` - Enable/disable each standard deviation level
**Visual Customization**
- Individual color pickers for each VWAP type and SD bands
- Line width adjustments
- `Show VWAP Labels` - Date labels at anchor points
- `Show Info Table` - Statistics dashboard toggle
- `Show SD Zones` - Background coloring beyond ±2 SD
***
## 💡 Trading Applications
✅ **Mean Reversion Trades**: Enter when price touches ±2 SD with reversal confirmation
✅ **Trend Following**: Trade in direction when price holds above/below VWAP
✅ **Institutional Levels**: Anchored VWAP reveals where large players accumulated positions
✅ **Gap Trading**: Use previous session VWAP to gauge gap fill probability
✅ **Volume Profile Analysis**: VWAP represents fair value based on actual volume traded
✅ **Support/Resistance Confluence**: Multiple VWAP alignment creates high-probability zones
***
## 🎓 Understanding VWAP
VWAP is the average price weighted by volume—representing the true average price paid by all market participants during a specific period. Unlike simple moving averages, VWAP gives more weight to price levels with higher trading volume, making it particularly valuable for:
- Institutional traders executing large orders
- Algorithmic trading systems
- Identifying fair value and overextended prices
- Minimizing market impact on large trades
***
## 📈 Chart Setup Recommendations
**Best Timeframes**: 1-minute to 15-minute charts for intraday; 1-hour to 4-hour for swing trading
**Compatible Markets**: Stocks, Indices (Nifty 50, Bank Nifty), Futures, Forex, Crypto
**Session Settings**: Works with standard daily sessions; automatically detects trading days (not calendar days)
***
## 🚀 What Makes This Indicator Unique
Unlike standard VWAP indicators that only show current session data, **Triple VWAP** provides:
- **Multi-session analysis** on a single chart without clutter
- **Historical anchoring** capability for event-driven analysis
- **Professional-grade statistics** dashboard
- **Independent customization** for each VWAP type
- **Optimized calculations** for real-time performance
***
## ⚠️ Important Notes
- **Anchored VWAP** requires manual date input (use significant market events like breakouts, earnings, trend reversals)
- **Session detection** based on daily timeframe changes—works on all chart timeframes
- **Previous Session VWAP** displays as static horizontal lines (reference only, not recalculated)
- **Standard Deviations** calculated using volume-weighted variance formula
- Works best on instruments with **consistent volume data**
***
## 📝 Credits & License
This indicator is published under **TradingView House Rules**. Code is original and follows Pine Script v6 best practices for performance and maintainability.
***
## 🤝 Support & Feedback
If you find this indicator valuable, please:
- ⭐ **Like** this publication
- 💬 **Comment** with your feedback or questions
- 🔔 **Follow** for updates and new releases
***
**Disclaimer**: This indicator is for educational and informational purposes only. Past performance does not guarantee future results. Always use proper risk management and combine with your own analysis before making trading decisions.
***

IED [Harmonic Volatility Edition]IED-H
IED-H (Harmonic Volatility Edition) is a professional mean-reversion and exhaustion detection engine designed to identify institutional stress zones, volatility extremes, and harmonic reversals using a geometry-based statistical framework.
This indicator does not chase trends or breakouts.
Instead, it focuses on detecting when price deviates excessively from its equilibrium and begins to lose efficiency.
⸻
🔬 Core Concept
IED-H measures price deviation from a dynamic trend baseline and projects it into harmonic volatility bands derived from natural square-root ratios:
• √2 → Pulse (normal deviation)
• √3 → Stretch (institutional stress)
• √5 → Extreme (critical exhaustion)
These levels adapt dynamically to market volatility and are not fixed thresholds.
⸻
⚙️ Key Features
• Harmonic Volatility Geometry
Dynamic √2 / √3 / √5 bands scaled by statistical volatility.
• Responsive Wave Engine
Smoothed deviation wave (HMA / RMA modes) for early exhaustion detection.
• Equilibrium Noise Filter
Automatically ignores weak, low-energy oscillations around balance.
• Persistence Logic
Requires prior presence inside overbought/oversold zones to avoid false signals.
• Candle Validation
Signals are confirmed using wick structure and true volatility (ATR-based).
• Harmonic Score (Debug Mode)
Quantifies how deeply price penetrates harmonic stress levels.
• Institutional Visualization
Optional on-chart boxes highlighting validated harmonic reaction zones.
⸻
🎯 What This Indicator Is Designed For
✔ Mean-reversion trades
✔ Exhaustion & volatility climax detection
✔ Trap zones and institutional reaction areas
✔ Advanced traders who value signal quality over signal quantity
⸻
🚫 What This Indicator Is NOT
✘ Not a trend-following system
✘ Not a breakout indicator
✘ Not designed for momentum chasing
✘ Not a multi-purpose “all-in-one” tool
IED-H is a precision instrument, not a Swiss-army knife.
⸻
🧠 Best Practice
For optimal results, use IED-H within a broader trading framework, preferably alongside:
• Higher-timeframe trend context
• Market structure or session logic
• Risk-controlled execution rules
⸻
⚠️ Disclaimer
This indicator is for educational and analytical purposes only.
It does not constitute financial advice.
Always manage risk and test thoroughly before live trading.

Supply & Demand - Trading Vidhyalaya (Free)A powerful script that automatically plots Supply and Demand zones on your chart. Designed to help traders identify potential reversal areas with precision.
Free Version Capabilities:
Works exclusively on the Daily (1D) Timeframe.
Includes Wick & Strong validation logic.
📍 Pinpoint accurate reversals.
🔔 Real-time alerts for Daily zones.
📉 "Touched" zone logic to keep your chart clean.
Want to use this on Intraday Charts? The Premium version supports ALL Timeframes (1m to Monthly) and includes Multi-Timeframe (MTF) overlay capabilities.

_Mean_RAWAn indicator based on the “ mean reversion ” strategy.
Works best with the EURUSD 4h pair. Different time frames can be used for other pairs.
The pyramiding feature does not make significant changes; it is not an important parameter.
It definitely does not repaint, especially if you trade on candle closes using the per bar close type alarm.
Green label -> 🟢 buy
Red label -> 🔴 sell
Yellow label -> 🟡 close
Your suggestions regarding the indicator are important to me.

Ribbon Cross Strategy This strategy uses a simple moving-average ribbon crossover system with a customizable entry filter. You can choose whether trades trigger near the fast or slow average, allowing flexibility in capturing early or confirmed trend moves.
It’s best suited for index trading on intraday timeframes , helping identify short-term trend reversals and continuations with clear visual cues and backtestable logic.

VWMA CloudA volume-weighted moving average (VWMA) cloud consisting of fast and slow VWMAs. The lines are dynamically colored based on their relative positions, forming a visual cloud that highlights bullish and bearish trends.
A normal moving average (SMA or EMA) weights prices equally (or by recency) and ignores volume, so it reacts the same regardless of how much trading occurred. A volume-weighted moving average (VWMA) weights each price by its trading volume, so high-volume moves shift the average more and low-volume moves shift it less. This makes VWMA more representative of where the market is actually trading and filters out weak, low-participation moves.

Supfabio Break-Return BandsSupfabio Break-Return Bands (B3 & B4 • 3-Candle Confirmation)
Supfabio Break-Return Bands is a volatility-based price action indicator built on top of a Two-Pole smoothing filter combined with ATR-derived dynamic bands.
It is designed to highlight price exhaustion, rejection, and potential reversal zones, with a strong emphasis on structural confirmation rather than immediate breakouts.
Core Concept
The indicator plots four volatility bands (Band 1 to Band 4) above and below a smoothed Two-Pole filter.
Signals are intentionally restricted to the outer bands, where price behavior is statistically more likely to show:
Volatility expansion
Liquidity grabs (stop runs / false breaks)
Strong rejection or mean-reversion behavior
Signal Logic
Band 4 (Primary Extreme Zone)
BUY and SELL signals are generated when:
Initial trigger (first candle)
Price either crosses the Band 4 level or
Touches and rejects the band (wick / pin behavior)
Confirmation on the 3rd candle (t + 2)
The confirmation candle:
Must not touch the same band again
Must close on the correct side of the band
Confirms that the initial break or pin was rejected
This delayed confirmation helps filter false breakouts and impulsive entries.
Band 3 (Secondary Setup)
On Band 3, signals are intentionally more selective:
Pin / rejection only
No direct cross signals
Uses the same 3-candle confirmation logic
This allows Band 3 signals to act as deeper pullback or early exhaustion setups.
Confirmation Mechanism
The script uses an internal state-based logic to:
Track the exact bar where the trigger occurred
Confirm signals only on the correct third candle
Prevent duplicate or consecutive signals from the same setup
Ensure pin-based triggers are not missed
Visual Elements
Main Two-Pole filter plotted as a thick continuous line
Volatility bands plotted with progressive line thickness
Band line styles (dotted / dashed) can be customized manually in the Style tab
Clear BUY and SELL labels plotted directly on the confirmation candle
Optional candle coloring based on filter direction
Alerts & Automation
Built-in alertcondition() for BUY and SELL
Alerts are suitable for webhook automation
Compatible with external systems and trading bots
Intended Use
This indicator is suitable for:
Reversal and exhaustion analysis
Mean-reversion strategies
Liquidity and rejection-based setups
Manual trading or automated execution
Intraday and higher-timeframe analysis
Notes
This script is intended as an analytical tool, not as a standalone trading system.
Signals should be used in combination with market structure, trend context, and proper risk management.

OC Chain_ROC_RSI15-minute indicator that detects a 3-candle “inside” chain where each candle’s open & close remain within the previous candle’s open-close range. Plots horizontal Open/Close levels on candles when ROC(2) moves beyond a configurable ±threshold, and highlights candles when RSI is strong (>55) or weak (< user set level, e.g., 30–32). Adjustable ROC/RSI settings and line extension options.


Long Bollinger Bands StrategyLong Bollinger Bands Strategy (XAUUSD) — Lower Band Reversal + 4-Step Scaling + Daily DD Guard
Long Bollinger Bands Strategy is a long-only Bollinger Bands reversal/mean-reversion strategy designed mainly for XAUUSD. It looks for a bearish push below the Lower Band followed by a bullish reclaim on candle close, then optionally scales in up to 4 entries (E1–E4) as price pulls back.
1) Risk Management & Position Sizing
The strategy includes a USD-based risk input: Risk per setup (USD).
It automatically calculates position size using the average SL distance across the 4-entry structure, then distributes size across entries with built-in weighting.
BackTest Lot checkbox:
OFF (default): uses normalized sizing (qty divided by 100)
ON: uses raw qty for backtesting workflows
2) SL/TP Management (Locked SL + Optional Range TP)
Stop Loss (SL): based on SL distance (pips from entry) from E1.
Take Profit (TP):
If TP (pips) > 0: fixed pip TP from E1
If TP (pips) = 0: TP is based on the signal candle range (high–low)
SL Lock: once the stop is tightened, it never loosens again (only moves in a protective direction) until the trade closes.
3) Daily Drawdown Protection
Tracks equity by day and stops opening new positions once Max daily drawdown (USD) is reached for that day.
4) Notes / Disclaimer
This strategy does not use volume, RSI, fundamentals, news filters, or session filters. Users should apply discretion and consider confirmations from other tools and market context. Results depend on symbol settings, spread, commission, and volatility regime. Always forward-test before using in live trading.
Designed for XAUUSD. The script uses an internal pip conversion (pipSize = 0.1) consistent with common gold quoting; verify your broker’s pip definition for best alignment.
5) Suggested Usage
Best used during volatile conditions or after a clear lower-band sweep and reclaim.
Consider pairing with trend filters or higher-timeframe bias.
6) Release Notes
Initial release: Long-only BB reclaim logic with 4-step scaling
Added: SL/TP lock logic and visual SL/TP lines
Added: Daily drawdown guard and backtest lot toggle OANDA:XAUUSD
