Sideways Strategy DMI + Bollinger Bands (by Coinrule)Markets don’t always trade in a clear direction. At a closer look, most of the time, they move sideways. Relying on trend-following strategies all the time can thus lead to repeated false signals in such conditions.
However, before you can safely trade sideways, you have to identify the most suitable market conditions.
The main features of such strategies are:
Short-term trades, with quick entries and quick exits
Slightly contrarian and mean-reversionary
Require some indicator that tells you it’s a sideways market
This Sideways DMI + Bollinger Bands strategy incorporates such features to bring you a profitable alternative when the regular trend-following systems stop working.
ENTRY
1. The trading system requires confirmation for a sideways market from the Directional Movement Index (DMI) before you can start opening any trades. For this purpose, the strategy uses the absolute difference between positive and negative DMI, which must be lower than 20.
2. To pick the right moment to buy, the strategy looks at the Bollinger Bands (BB). It enters the trade when the price crosses over the lower BB.
EXIT
The strategy then exits when the move has been exhausted. Generally, in sideways markets, the price should revert lower. The position is closed when the price crosses back down below the upper BB.
The best time frame for this strategy based on our backtest is the 1-hr. Shorter timeframes can also work well on certain coins that are more volatile and trade sideways more often. However, as expected, these exhibit larger volatility in their returns. In general, this approach suits medium timeframes. A trading fee of 0.1% is taken into account. The fee is aligned to the base fee applied on Binance, which is the largest cryptocurrency exchange.
Bitcoin (Mata Wang Kripto)

Three EMAs Trend-following Strategy (by Coinrule)Trend-following strategies are great because they give you the peace of mind that you're trading in line with the market.
However, by definition, you're always following. That means you're always a bit later than your want to be. The main challenges such strategies face are:
Confirming that there is a trend
Following the trend, hopefully, early enough to catch the majority of the move
Hopping off the trade when it seems to have run its course
This EMA Trend-following strategy attempts to address such challenges while allowing for a dynamic stop loss.
ENTRY
The trading system requires three crossovers on the same candle to confirm that a new trend is beginning:
Price crossing over EMA 7
Price crossing over EMA 14
Price crossing over EMA 21
The first benefit of using all three crossovers is to reduce false signals. The second benefit is that you know that a strong trend is likely to develop relatively soon, with the help of the fast setup of the three EMAs.
EXIT
The strategy comes with a fixed take profit and a volatility stop, which acts as a trailing stop to adapt to the trend's strength. That helps you get out of the way as soon as market conditions change. Depending on your long-term confidence in the asset, you can edit the fixed take profit to be more conservative or aggressive.
The position is closed when:
The price increases by 4%
The price crosses below the volatility stop.
The best time frame for this strategy based on our backtest is the 4-hr. Shorter timeframes can also work well, although they exhibit larger volatility in their returns. In general, this approach suits medium timeframes. A trading fee of 0.1% is taken into account. The fee is aligned to the base fee applied on Binance, which is the largest cryptocurrency exchange.

Optimised RSI strategy for Reversals (by Coinrule)The most common way to use the RSI to spot a good buy opportunity is to check for values lower than 30. Unfortunately, the RSI can remain in oversold territory for long periods, and that could leave you trapped in a trade in loss. It would be appropriate to wait for a confirmation of the trend reversal.
In the example above I use a short-term Moving Average (in this case, the MA9) coupled with an RSI lower than 40. This combination of events is relatively rare as reversal confirmations usually come when RSI values are already higher. As unusual as this setup is, it provides buy-opportunities with much higher chances of success.
The parameters of this strategy would be:
ENTRY: RSI lower than 40 and MA9 lower than the price
TAKE PROFIT and STOP-LOSS with a ratio of at least 2. That means that if you set up a take profit of 3%, your stop-loss shouldn’t be larger than 1.5%.
The advantage of this approach is that it has a high rate of success and allows you the flexibility of setting up the percentages of the take profit and stop-loss according to your preferences and risk appetite.

BTC Coinbase Premium TrendBTC Coinbase (institutional trader) vs. Binance (retail trader) Premium
Positive values: Coinbase trading at a premium (institutions more bullish than retail)
Negative values: Coinbase trading at a discount (institutions more bearish than retail)
Bitcoin trend RVI and Emastrategy with two emas and rvi.
Only long positions when fast ema above slow ema when rvi gives entry.
Only short positions when slow ema above fast ema when rvi gives entry.

Cryptogrithm's Secret Momentum and Volatility IndicatorThis indicator is hard-coded for Bitcoin, but you may try it on other asset classes/coins. I have not updated this indicator in over 3 years, but it seems to still work very well for Bitcoin.
This indicator is NOT for beginners and is directed towards intermediate/advanced traders with a sensibility to agree/disagree with what this indicator is signalling (common sense).
This indicator was developed back in 2018 and I has not been maintained since, which is the reason why I am releasing it. (It still works great though! At the time of this writing of May 2022).
How to use:
Terms:
PA (Price Action): Literally the candlestick formations on your chart (and the trend formation). If you don't know how to read and understand price action, I will make a fast-track video/guide on this later (but in the meanwhile, you need to begin by learning Order-Flow Analysis, please google it first before asking).
CG Level (Cryptogrithm Level/Yellow Line): PA level above = bullish, PA level below = bearish
CG Bands (Cryptogrithm Bands): This is similar to how bollingers work, you can use this the same was as bollinger bands. The only difference is that the CG bands are more strict with the upper and lower levels as it uses different calculations to hug the price tighter allowing it to be more reactive to drastic price changes (earlier signals for oversold/overbought).
CG Upper Band (Red Upper Line): Above this upper bound line means overbought.
CG Middle Band (Light Blue Line): If PA trades above this line, the current PA trend is bullish continuing in the uptrend. If PA trades below this line, the current PA trend is bearish continuing in the downtrend. This band should only be used for short-term trends.
CG Lower Band (Green Lower Line): Below this lower bound line means oversold.
What the CG Level (yellow line) tells you:
PA is trading above CG Level = Bullish
PA is trading below CG Level = Bearish
Distance between CG Level and price = Momentum
What this means is that the further away the price is from the CG Level, the greater the momentum of the current PA trend. An increasing gap between the CG Level and PA indicates the price's strength (momentum) towards the current upward/downward trend. Basically when the PA and CG Level diverge, it means that the momentum is increasing in the current trend and when they converge, the current trend is losing momentum and the direction of the PA trend may flip towards the other direction (momentum flip).
PA+CG Level Momentum:
To use the CG Level as a momentum indicator, you need to pay attention to how the price and the CG level are moving away/closer from each other:
PA + CG Level Diverges = Momentum Increasing
PA + CG Level Converges = Momentum Decreasing
Examples (kind of common sense, but just for clarity):
Case 1: Bullish Divergence (Bullish): The PA is ABOVE and trending AWAY above from the CG Level = very bullish, this means that momentum is increasing towards the upside and larger moves will come (increasing gap between the price and CG Level)
Case 2: Bearish Convergence (Bearish): - The PA is ABOVE the CG Level and trending TOWARDS the CG Level = bearish, there is a possibility that the upward trend is ending. Look to start closing off long positions until case 1 (divergence) occurs again.
Case 3: Neutral - The PA is trading on the CG Level (no clear divergence or convergence between the PA and CG Level) = Indicates a back and forth (tug of war) between bears and bulls. Beware of choppy price patterns as the trend is undecisive until either supply/liquidity is dried out and a winner between bull/bear is chosen. This is a no trade zone, but do as you wish.
Case 4: Bearish Divergence (Bearish): The PA is BELOW and trending AWAY BELOW from the CG Level = very bearish, this means that momentum is increasing towards the downside and larger downward moves will come (increasing gap between the price and CG Level).
Case 5: Bullish Convergence (Bullish): - The PA is BELOW the CG Level and trending TOWARDS the CG Level = bullish, there is a possibility that the downward trend is ending and a trend flip is occuring. Look to start closing off short positions until case 4 (divergence) occurs again.
CG Bands + CG Level: You can use the CG bands instead of the PA candles to get a cleaner interpretation of reading the momentum. I won't go into detail as this is pretty self-explanatory. It is the same explanation as PA+CG Level Momentum, but you are replacing the PA candles with the CG Bands for interpretation. So instead of the PA converging/diverging from the CG Level, the Upper and Lower Bound levels are converging/diverging from the CG level instead.
Convergence: CG Level (yellow line) trades inside the CG bands
Divergence: CG Level (yellow line) trades outside the CG bands
Bullish/Bearish depends on whether the CG Band is trading below or above the CG level. If CG Band is above the CG Level, this is bullish. If CG Band is below the CG level, this is bearish.
Crosses (PA or CG Band crosses with CG level): This typically indicates volatility is incoming.
There are MANY MANY MANY other ways to use this indicator that is not explained here and even other undiscovered methods. Use some common sense as to how this indicator works (it is a momentum indicator and volatility predictor). You can get pretty creative and apply your own methods / knowledge to it and look for patterns that occur. Feel free to comment and share what you came up with!

Crypto Correlation Strategy based on Technical Ratings This is a swing trading crypto correlation strategy, based initially on technical ratings but adapted to the entire crypto market environment , by using as a source of calculations the candle values from CRYPTOCAP:TOTAL.
So since TOTAL, is the sum of all the crypto currencies, its going to be our leader. We will get the entries and exits , internally from it and input them into the crypto coins(more than 80-90% of the usdt perpetual pairs are following the same direction but with a higher volatility), and with this in general is going to give us as much better risk/reward than just by trading 1 coin alone.
So this means that all coins will enter and exit at the same time forom a trade. With this, since sometimes we have sudden big changes in the price form one side to another, is going to break a little this effect and since the initial movements were bigger, it would make us lose less. At the same time it can also make us lose more if the changes happen to soon.
One of the things of this particular idea is we dont have to worry about particular optimizations for each asset/coin.
This scenario has been adapted for 30min timeframe, using 0.1% comission per entry and 0.1% comission for exit from the trade.
I have tested so far with most USDT Perpetual Pairs from binance, and it seems to give good results with most of the pairs.
If you have any question please let me know !

Maddrix_club III (strategy)Maddrix club III (STRATEGY) is an advanced trading algorithm that goes long and short in spite of the market condition. It aims to capture large moves. It is the fruit of over a thousand hours of work, trials, errors, research, etc.
The STUDY version is also posted.
There are 5 main variables to adjust the indicator:
Framework length – Use this to establish the environment. Shorter length = volatile environment. Longer length = steadier.
Framework multiplier – Use this to adjust the environment to the asset. Lower value for less volatile price action and higher value for very volatile price action.
Search timeframe – Use this to lookback for a fractal . In theory, the longer the lookback the more reliable the fractal recognition.
Trigger line – Use this to adjust the trigger level. In theory, the lower the trigger the more signals you get.
Threshold – Use this to filter the signals. The higher the threshold, the less signal you get.
The best way to go about changing the settings, is to start off the default value. I’d do a monthly check-in playing with few of them and readjusting based on results from the exchange.
They are different, as this one can show you the equity curve.
It works on many markets as long as there is sufficient activity to create patterns and repetition.
You will notice a slight difference between the strategy calculation and the algo calculation (built in the algo) - this is because the exits are not exactly at the same levels. I left this on purpose, so that you can see that even with a little slippage, overall this is positive.
Very good results have been observed on the 15 min time frame though it technically works on all timeframe (5 min for example, 1 hour also). On the example above ETHUSDT – 15 min, the back test shows consistency in the results for the last 2 years. The theory behind it is based on probabilities, human emotions, and repetition in market patterns.
Results have also shown great adaptability, meaning the total profits don’t change considerably when we play with settings. This is very good because even if you try to fine tune a set of settings to the past, the probability that it keeps working in the future is rather high.
Very important note: the calculations DO NOT take into account any fee or slippage that you always experience on the exchanges.
The indicators only uses real time data, therefore it can’t repaint.
There are absolutely no guarantees about this algorithm and past results are not indicative of future performance.
Fees, slippage and API delay: for any algorithm you will use (from me or others), please keep in mind that fees add up, slippage and delay creates differences between algo theory and reality. We can put in place systems to circumvent that, but we will always have them.

VMC Oracle This is Oracle. It is a momentum driven indicator with behind-the-scenes filters designed to best indicate the oversold and overbought points on most assets. Oracle partially uses a regression equation displayed in line format with a predetermined spacing to indicate different support and resistance points within the last 100 bars. When used in combination with the smoothed oscillator and moving averages it becomes a powerful tool in your box. It is important to keep in mind that because this indicator is always looking at the last 100 bars the user will need to use the “replay” function on Tradingview for the best manual back-testing to the triggers as possible. It should become clear that when its in the red zone above the ‘zero’ line that the potential for downward movement is greater. The bottom or below ‘zero’ green zone indicates a potential time to buy.
In addition to the regression lines, the indicator is supplied with a basic moving average application involving cross analysis. The two lines in cooperation help the user determine when the overall trend is shifting. As an example, when the overall trend may be indicating a bearish market or downtrend it may be beneficial to consider any of Oracle’s triggers that may be opposite more closely. Some of the alerts will trigger in what appears to be opposite trending areas such as a buy trigger when the averages indicate a bearish period. When this happens, it is up to the user utilize other confirmation type tools to assist in the decision of the oracle triggers. The reason for this is that Oracle is designed to predict the change in the market before or during a peak or through area on the graph. The success can be large but this can reduce the automatic trigger’s success in which loss management must be executed.
The custom alert function built in is designed to automate the visual comparisons of the two items above. By considering trend, immediate resistance and support lines, and momentum we can help visually indicate the points of possible exhaustion in either direction.
When setting up the alert it's as simple as a new alert creation and selecting the VMC Oracle Indicator in the top drop down. After that its as simple as selecting Long Alert or Short alert. As with any tool it is recommended to understand the asset being traded and providing yourself with the best risk management rules to minimize unfavorable movements.

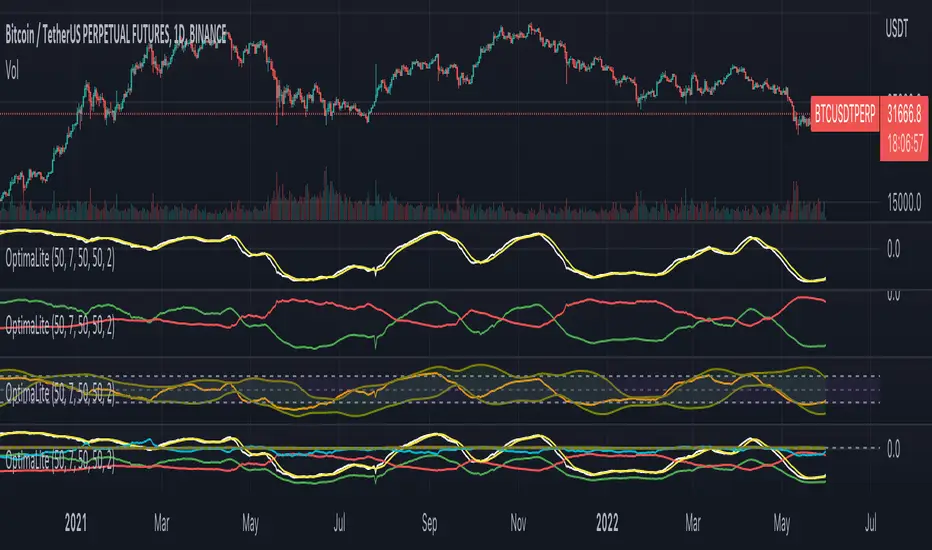
OptimaLiteThe OptimaLite algorithm performs the calculation of the integrated profits and losses for all the buyers and sellers that they have for the given “Calculation period” back in history for every time point. The idea is based on the principle of the accumulation and distribution of the capital among the market participants leading to the price trend change.
The indicator consists of the several components (signal lines):
1) “Return” – the main signal that reflects the integrated profits and losses delta (the “Return” moving average is added)
2) “Profit” and “Loss” – integrated profits and losses correspondingly
3) “Return Normalized” – the normalized “Return” for a given period of time
4) “Return High Frequency” – the “Return” signal compensated with the short-term fluctuations by RSI
How to use the indicator:
– Highs and lows of the indicator are associated with the overbought and oversold conditions points correspondingly.
– Crosses of the moving average with the main indicator line are associated with the trend change
– Divergencies between the indicator and price highs or lows can be used as signals for the trend reversal
– “Profit” and “Loss” signal lines intersections indicate the bulls/bears take over the market
Adjustments:
The periods of the calculation, averaging and normalization are the main parameters that could be tuned in order to optimize the indicator performance. Generally, the default values are sufficient for the nominal performance thought. But the best combination of those parameters is specific for each asset and timeframe, so it recommended to optimize them.
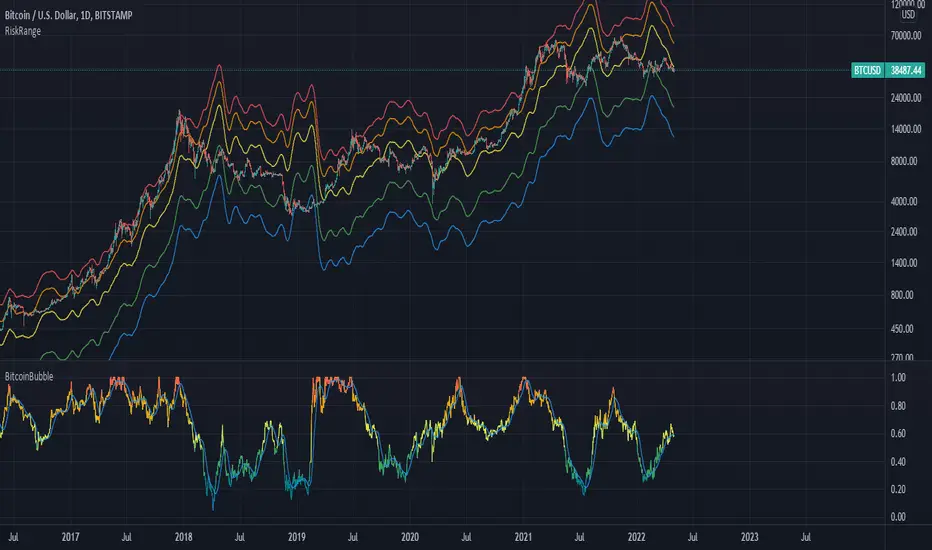
Bitcoin Risk RangeThis is an extension of the original 'Bitcoin Bubble' indicator I previously made, but shows the necessary price required to reach a range of bitcoin's bubble level in the short term. I recommend using this metric with a daily timeframe to have an adequate amount of data.
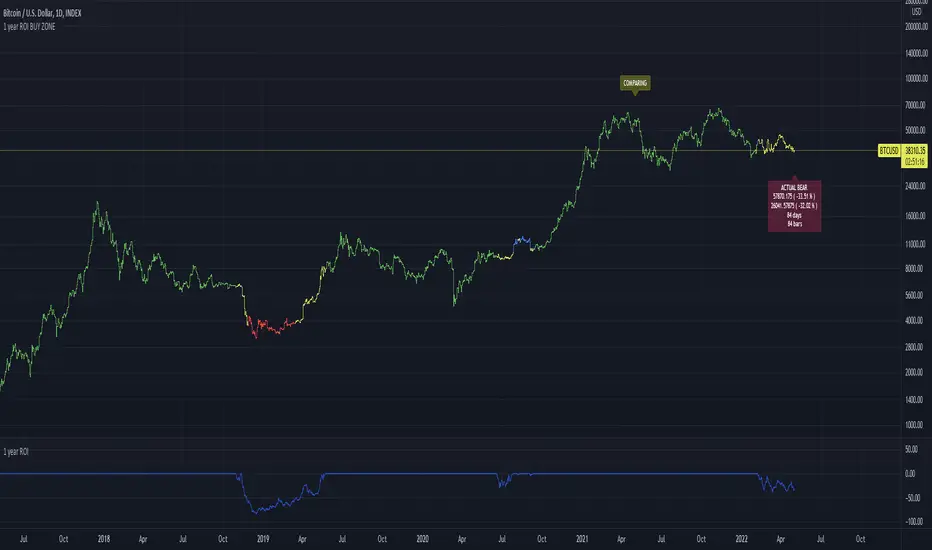
1 year ROI BUY ZONEThis indicator is comparing price with price 1 year ago. This will generate ROI which could be positive or negative.
If ROI switches from negative to positive or vice versa it will generate zone
This zone could have minimum days to filter false signals
Buy signal could be added when ROI reaches some value ( -65% for example)
Stochastic Moving AverageHi all,
This Strategy script combines the power of EMAs along with the Stochastic Oscillator in a trend following / continuation manner, along with some cool functionalities.
I designed this script especially for trading altcoins, but it works just as good on Bitcoin itself and on some Forex pairs.
______ SIGNALS ______
The script has 4 mandatory conditions to unlock a trading signal. Find these conditions for a long trade below (works the exact other way round for shorts)
- Fast EMA must be higher than Slow EMA
- Stochastic K% line must be in oversold territory
- Stochastic K% line must cross over Stochastic D% line
- Price as to close between slow EMA and fast EMA
Once all the conditions are true, a trade will start at the opening of the next
______ SETTINGS ______
- Trade Setup:
Here you can choose to trade only longs or shorts and change your Risk:Reward.
You can also decide to adjust your volume per position according to your risk tolerance. With “% of Equity” your stop loss will always be equal to a fixed percentage of your initial capital (will “compound” overtime) and with “$ Amount” your stop loss will always be 'x' amount of the base currency (ex: USD, will not compound)
Stop Loss:
The ATR is used to create a stop loss that matches current volatility. The multiplier corresponds to how many times the ATR stop losses and take profits will be away from closing price.
- Stochastic:
Here you can find the usual K% & D% length and overbought (OB) and oversold (OS) levels.
The “Stochastic OB/OS lookback” increase the tolerance towards OB/OS territories. It allows to look 'x' bars back for a value of the Stochastic K line to be overbought or oversold when detecting an entry signal.
The “All must be OB/OS” refers to the previous “Stochastic OB/OS lookback” parameter. If this option is ticked, instead of needing only 1 OB/OS value within the lookback period to get a valid signal, now, all bars looked back must be OB/OS.
The color gradient drawn between the fast and slow EMAs is a representation of the Stochastic K% line position. With default setting colors, when fast EMA > slow EMA, gradient will become solid blue when Stochastic is oversold and when slow EMA > fast EMA, gradient will become solid blue when Stochastic is overbought
- EMAs:
Just pick your favorite ones
- Reference Market:
An additional filter to be certain to stay aligned with the current a market index trend (in our case: Bitcoin). If selected reference market (and timeframe) is trading above selected EMA, this strategy will only take long trades (vice-versa for shorts) Because, let’s face it… even if this filter isn’t bulletproof, you know for sure that when Bitcoin tanks, there won’t be many Alts going north simultaneously. Once again, this is a trend following strategy.
A few tips for increased performance: fast EMA and D% Line can be real fast… 😉
As always, my scripts evolve greatly with your ideas and suggestions, keep them coming! I will gladly incorporate more functionalities as I go.
All my script are tradable when published but remain work in progress, looking for further improvements.
Hope you like it!

Fukuiz Octa-EMA + Ichimoku (Strategy)This strategy is based EMA of 8 different period and Ichimoku Cloud which works better in 1hr 4hr and daily time frame.
#A brief introduction to Ichimoku #
The Ichimoku Cloud is a collection of technical indicators that show support and resistance levels, as well as momentum and trend direction. It does this by taking multiple averages and plotting them on a chart. It also uses these figures to compute a “cloud” that attempts to forecast where the price may find support or resistance in the future.
#A brief introduction to EMA#
An exponential moving average ( EMA ) is a type of moving average (MA) that places a greater weight and significance on the most recent data points. The exponential moving average is also referred to as the exponentially weighted moving average . An exponentially weighted moving average reacts more significantly to recent price changes than a simple moving average ( SMA ), which applies an equal weight to all observations in the period.
#How to use#
The strategy will give entry points itself, you can monitor and take profit manually(recommended), or you can use the exit setup.
EMA (Color) = Bullish trend
EMA (Gray) = Bearish trend
#Condition#
Buy = All Ema (color) above the cloud.
SELL= All Ema turn to gray color.

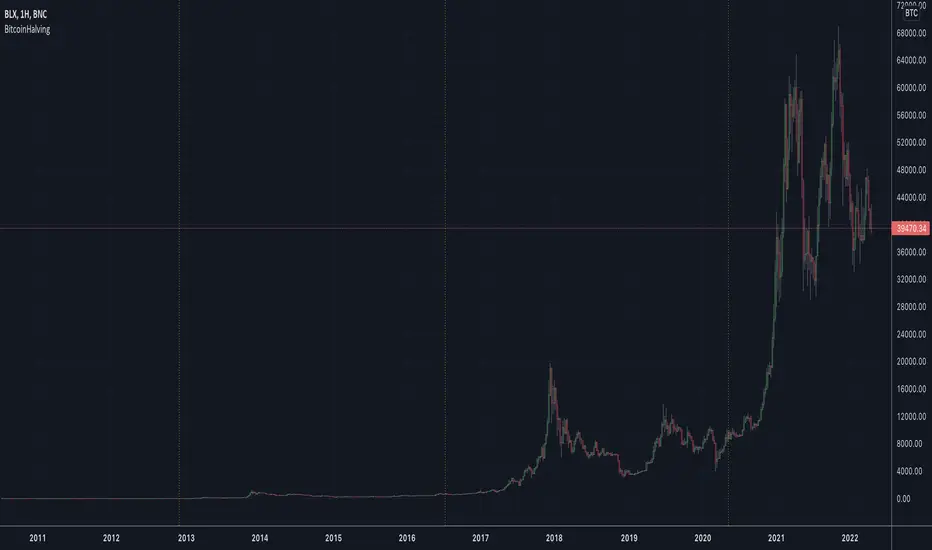
BitcoinHalvingLibrary "BitcoinHalving"
Displays where Bitcoin's halvings have been
getDates() List of Bitcoin halving dates
Returns: array with timestamp dates
isHalvingDay() Checks if the current day is a halving day
Returns: bool
super SSL [ALZ]This script is designed and optimized for MULTI TIME
by Ali Zebardast (ALZ)
1.in part of ssl
Original Version credits to Mihkel00
Actual Version i just set alerts and change the parameters for BTCUSDT 1min Chart.
He designed for daily time. I tried to optimize 1 min time-frame .
And fix the errors with OTT
"This script has a SSL / Baseline (you can choose between the SSL or MA), a secondary SSL for continiuation trades and a third SSL for exit trades.
Alerts added for Baseline entries, SSL2 continuations, Exits.
Baseline has a Keltner Channel setting for "in zone" Gray Candles
Added "Candle Size > 1 ATR" Diamonds from my old script with the criteria of being within Baseline ATR range."
2.in part of Range
two Filter Buy and Sell for 3min
Wait For Bar close
ssl2 :Be under the candle for buy
and The bar color must confirm the order of purchase (Blue)
3.in part of OTT
when candles close over HOTT, means an UPTREND SIGNAL
and to Fuchia when candles begin closing under LOTT line to indicate a DOWNTREND SIGNAL.
FLAT ZONE is highlighted also to have the maximum concentration on sideways market conditions.
There are three quantitative parameters in this indicator:
The first parameter in the OTT indicator set by the two parameters is the period/length.
OTT lines will be much sensitive to trend movements if it is smaller.
And vice versa, will be less sensitive when it is longer.
As the period increases it will become less sensitive to little trends and price actions.
In this way, your choice of period, will be closely related to which of the sort of trends you are interested in.
The OTT percent parameter in OTT is an optimization coefficient. Just like in the period
small values are better at capturing short term fluctuations, while large values
will be more suitable for long-term trends.
The final adjustable quantitative parameter is HIGHEST and LOWEST length which is the source of calculations.
Credits go to:
SSL Hybrid www.tradingview.com
HIGH and LOW OTT : www.tradingview.com
Range Filter www.tradingview.com

[MACLEN] TRUE RANGEThis is a true range (TR) based strategy with weighted moving average (WMA) smoothing to remove noise.
In addition, it includes a risk management strategy using 4 "safes" in the same operation to always seek to make a profit.
This is for evaluation only, and it is not recommended to use with real money.
It is a work in progress. I read your comments.

The Brain Trust Presets Strategies [BTC / ETH] [PrismBot] [Lite]This strategy contains 9 different timeframe strategies (2 strategy types with pre-adjusted filter options for the different timeframes) tailored to BTC ( Bitcoin ) and ETH ( Ethereum ) on Binance. While I've listed these prebuilt strategies for specific timeframes, they are versatile enough to be checked and tested on other timeframes, and exchanges as well. I have been careful to avoid any curvefitting or overfitting. Included is useful default order settings, but we wanted to ensure you, the user, has control over the order settings for your own equity and trading.
These strategies are created, tailored, tested, and actively used by me.
It is up to you to do your own due diligence when testing these strategies on your exchange, and for your use, and PrismBot bears no responsibility for losses from the use of these strategies.
These strategies employ a variety of methods. Notable inclusions are other live strategies of mine including but not limited to:
ADX + MACD
RSI
Consolidations
Bull Bear Power
Volume Calculations
Open Interest Data
All of these setups include trend trading methods intended to maximize profitability in strong trending markets, and filters deployed to prevent failures in consolidation, though nothing is failproof.
You can control your leverage, quantity calculations, and other order settings. However, all other strategy input parameters are controlled by the strategy selectors.
Some strategies use 1.5 to 1 Risk to Reward ratio while others use 1:1.
How we execute trades for each strategy:
For 10m and 45m
we use a variety of settings for a Normalized MACD and ADX indicator. The thesis is we detect Normalized MACD crossovers at specific values and only allow trading of the strategy when the ADX is above a specific value.
For 15m, 1H, and 45m
we utilize the RSI crossovers of overbought and oversold and use the RSI moving average to filter trades. The thesis is we detect overbought for long and oversold for short.
For each strategy we use additional filters such as Bull Bear Power, Volume Flow, and Open Interest calculations to simply validate a trade.
Automatic Mode
In automatic mode, we detect your timeframe and current coin chart to decide one of the strategies from our database. If you want to manually select a different strategy or try the strategies on different cryptocurrencies, you can disable automatic mode entirely.

MACD of Aggregated Buy/Sell Pressure - InFinitoModified & Updated script from MARKET VOLUME by Ricardo M Arjona @XeL_Arjona that Includes Aggregated Volume
Aggregation code originally from Crypt0rus
***The indicator can be used for any coin/symbol to aggregate volume , but it has to be set up manually***
***The indicator can be used with specific symbol data only by disabling the aggregation option, which allows for it to be used on any symbol***
- Calculated based on Aggregated Volume instead of by symbol volume . Using aggregated data makes it more accurate and allows to compare volume flow between different kinds of markets (Spot, Futures , Perpetuals, Futures+Perpetuals and All Volume ).
- As well, in order to make the data as accurate as possible, the data from each exchange aggregated is normalized to report always in terms of 1 BTC . In case this indicator is used for another symbol, the calculations can be adjusted manually to make it always report data in terms of 1 contract/coin.
Buy to Sell Convergence / Divergence by @XeL_Arjona:
"It's a simple adaptation of the popular "Price Percentage Oscillator" or MACD but taking Buying Pressure against Selling Pressure Averages, so given a Positive oscillator reading (>0) represents Bullish dominant Trend and a Negative reading (<0) a Bearish dominant Trend. Histogram is the diff between RAW Volume Pressures Convergence/Divergence minus Normalized ones (Signal) which helps as a confirmatory."
Things to look for:
- Divergences: This indicator can very useful to spot tops and bottoms through divergences

Buy/Sell Aggregated Delta Pressure - InFinitoModified & Updated script from MARKET VOLUME by Ricardo M Arjona @XeL_Arjona that Includes Aggregated Volume , Delta Buy/Sell Pressure
Aggregation code originally from Crypt0rus
***The indicator can be used for any coin/symbol to aggregate volume , but it has to be set up manually***
***The indicator can be used with specific symbol data only by disabling the aggregation option, which allows for it to be used on any symbol***
- Calculated based on Aggregated Volume instead of by symbol volume . Using aggregated data makes it more accurate and allows to compare volume flow between different kinds of markets (Spot, Futures , Perpetuals, Futures+Perpetuals and All Volume ).
- As well, in order to make the data as accurate as possible, the data from each exchange aggregated is normalized to report always in terms of 1 BTC . In case this indicator is used for another symbol, the calculations can be adjusted manually to make it always report data in terms of 1 contract/coin.
- Buy/Sell Pressure: Smoothens the buy and sell volume into a signal for each. Which makes it easier to identify Buy and Sell Volume Flow.
- Buy/Sell Delta Pressure: Calculates the difference between Buy & Sell Pressure and plots a Delta signal that shows who is in control currently.
- Buy/Sell + Delta Pressure: Displays both Buy & Sell Pressure and Delta pressure. This can help to visualize who is in control but also how much pressure there is on each side.
- A Moving Average can be plotted to the Delta pressure. This, with confluence, can give great entries/exits
Things to look for:
- Divergences: If price keeps moving in one direction but the pressure to that side decreases it can be inferred that the move might slow down soon or revert. As well if pressure to one side increases but price does not react to it, it signals that the other side is stronger.
- MA/Zero Crossovers: Delta Pressure Crossover of its moving average or the 0 Line can indicate direction changes prematurely

FieryTrading Long-Term Bitcoin Investor ToolDear community,
Today I want to present you one of my favorite scripts for long-term Bitcoin trading. I'm publishing this script because I think it will help traders to become more profitable in the long-term. Consequently, this script is targeted at long-term investors only, since it can take years before the price goes from the green area to the red area.
To use this script correctly you will need to use the BTCUSD index from Tradingview. Search "Bitcoin Index" in your symbol search bar, top result. Use daily candles on a logarithmic scale.
This scripts consists of two price bands, green and red. The green band has historically been a great area for the accumulation of BTC, whilst the red area has historically been a great area for exiting BTC. You could say that if the price is in (or below) the green bands BTC is undervalued, with the opposite being true for the red bands.
If you wish to add alerts to this script, simply click on the alert button > condition=Fierytrading BTC Tool. You can add alerts when the price enters the green area (Buy Area Cross) or red area (Sell Area Cross).
This simple script has historically proven to be very efficient at identifying bottoms (accumulation) and tops (distribution). Be aware that the usability of this script is not guaranteed in the future.

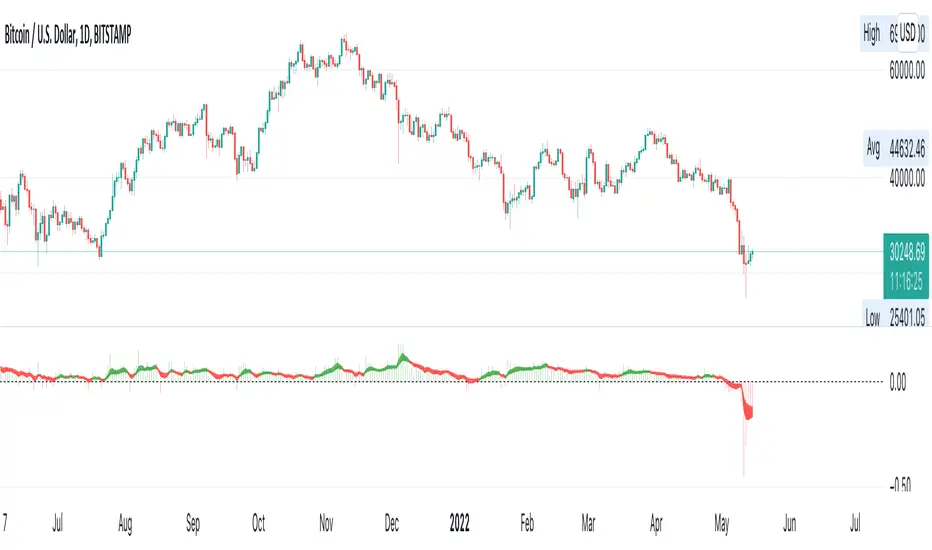
SOPR Candles OscillatorThe Spent Output Profit Ratio (SOPR) is computed by dividing the realized value (in USD) divided by the value at creation (USD) of a spent output. Or simply: price sold / price paid. This metric was created by Renato Shirakashi.
The indicator provides insight into macro market sentiment, profitability and losses taken over a particular time-frame. It reflects the degree of realized profit for all coins moved on-chain.
SOPR is measured by taking the ratio between the fiat value at the time of UTXO creation, and the fiat value when the UTXO is spent.
In this indicator, I have essentially created an index that measures SOPR value on any given day. This is visually displayed as an oscillator.
SOPR values greater than 0 implies that the coins moved that day are, on average, selling at a profit (price sold is greater than the price paid).
SOPR value less than 0 implies that the coins moved that day are, on average, selling at a loss (price sold is less than the price paid).
You have the ability to see the SOPR of BTC , ETH and LTC. You can also smooth the SOPR using an EMA or SMA of your choice. I have added colored bars to the chart to make it easier to visualize SOPR and it's relation to price action.
Thank you to both TradingView and Glassnode for adding all the on-chain data.

Aggregated Money Flow Index - InFinitoModified Version of In-Built Money Flow Index Indicator. Aggregated Volume is used for it's calculation + a couple of other features.
Aggregation code originally from Crypt0rus
***The indicator can be used for any coin/symbol to aggregate volume , but it has to be set up manually***
***The indicator can be used with specific symbol data only by disabling the aggregation option, which allows for it to be used on any symbol***
- Calculated based on Aggregated Volume instead of by symbol volume . Using aggregated data makes it more accurate and allows to compare volume flow between different kinds of markets (Spot, Futures , Perpetuals, Futures+Perpetuals and All Volume ).
- As well, in order to make the data as accurate as possible, the data from each exchange aggregated is normalized to report always in terms of 1 BTC . In case this indicator is used for another symbol, the calculations can be adjusted manually to make it always report data in terms of 1 contract/coin.
- Added Moving Average ( SMA , EMA , WMA , RMA, VWMA ) that can be plotted to the MFI
- Added 10/90 level and 45/55 range level
Things to look for:
- Divergences: Can be a very good reversal signal
- MA crossovers & Oversold/Overbought levels crossover: With proper confluence, entering a position at MA crossover and exiting at oversold/overbought levels can give very good swing setups (Or scalps on LTF)
- Center range retests: Once in a trend, retesting the middle range can give very good entries and confirmations of the trend
- Confluence of the latter: In combination, if more than one of these occur at the same time it can give more clarity regarding the current state of the market.
