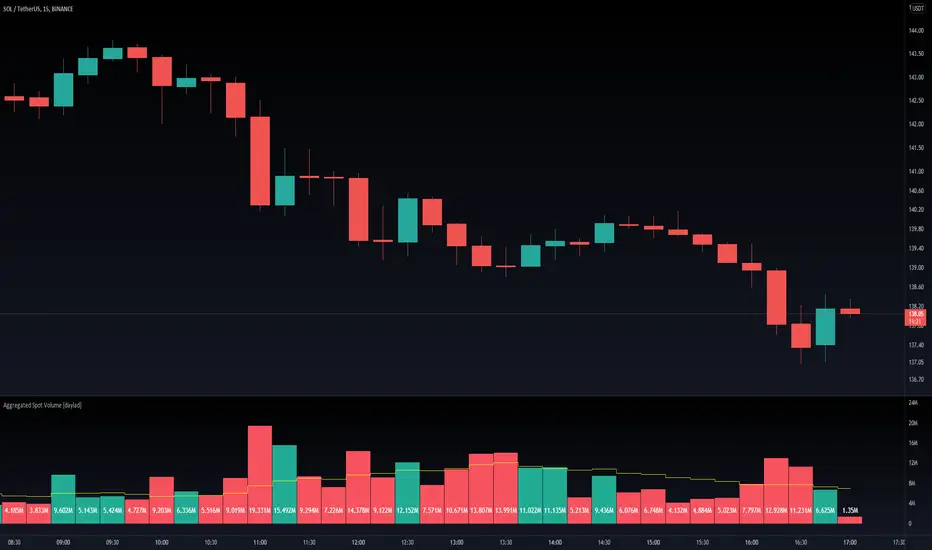
Aggregated Spot Volume [daylad]Works with any crypto chart! Automatically pulls and aggregates trading volume for the top stop pairs.
No need to manually update symbols, this indicator will detect if there is a matching symbol and add it.
Pulls data for the following pairs (when available):
COINBASE: + symbol + USD
COINBASE: + symbol + USDT
COINBASE: + symbol + EUR
BINANCE: + symbol + USDT
BINANCE: + symbol + BUSD
BINANCEUS: + symbol + USD
OKEX: + symbol + USDT
OKEX: + symbol + USDK
FTX: + symbol + USD
HUOBI: + symbol + USDT
BITFINEX: + symbol + USD
KRAKEN: + symbol + USD
KUCOIN: + symbol + USDT
CURRENCYCOM: + symbol + USD
POLONIEX: + symbol + USDT
UPBIT: + symbol + KRW
BITHUMB: + symbol + KRW
EXAMPLE -- If you are looking at the BINANCE:ADAUSDT chart, the indicator will automatically aggregate the volume from COINBASE:ADAUSD, COINBASE:ADAUSDT...etc... BINANCE:ADAUSDT...etc... BITHUMB:ADAKRW. If an exchange does not have a specific pair, then that pair returns 0 (does not add to the total).
If you have any questions feel free to ask. Happy trading!
Bitcoin (Mata Wang Kripto)
(D7R) BAKKT Bitcoin FuturesBAKKT Bitcoin Quarterly Contract Futures Price with 3 different display modes: (Percentage, Delta, Absolute).
This information can be used to understand when futures are trading at relative strong/weak premium or discount against each other.
This information can either be used for cash-n-carry arbitrage, inter-exchange arbitrage, hedging or directional price speculation.

(D7R) CME Bitcoin FuturesCME Bitcoin Quarterly Contract Futures Price with 3 different display modes: (Percentage, Delta, Absolute).
This information can be used to understand when futures are trading at relative strong/weak premium or discount against each other.
This information can either be used for cash-n-carry arbitrage, inter-exchange arbitrage, hedging or directional price speculation.

MA Bollinger Bands + RSI This script uses the standard deviation of a given moving average along with an RSI direction.
When: rsi crossover neutral line + price crossover lower deviation boundary => long
When: rsi crossunder neutral line + price crossunder upper deviation boundary => short

BTC Futures BasisShows various basis percentages in a table and plots historical basis. Also has an alert function for backwardation events. Useful for tracking bullish/bearish sentiment in BTC futures markets.
*Currently displays March and June futures for the following exchanges: Bitmex, Binance, Deribit, Okex, and FTX
Also displays CME Continuous Next Contract. All of the symbols are customizable.
-----------
Market-wide backwardation usually occurs during a heavy sell-off (such as a liquidation cascade).
**For getting alerts of backwardation events, I recommend creating an alert on the 1 minute chart with the condition "Any alert() function call". Alert level is customizable as well.
-----------
*NOTE!! : Futures contracts expire (obviously), so the contract symbols will need to be updated periodically. I will try to keep them updated going into the future.
**NOTE2!! : The alert() function does not track the CME contract. This is to avoid false triggers.

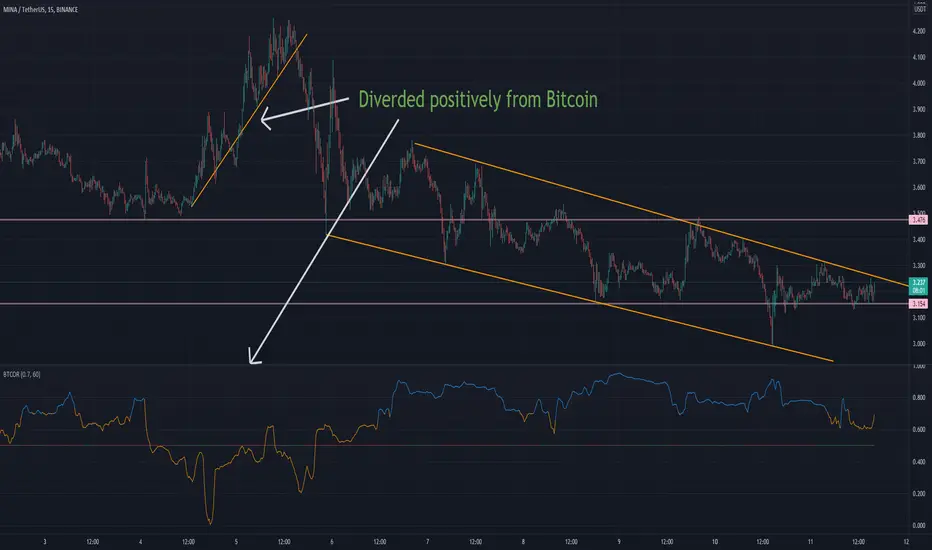
BTC-CORRELATIONShows Bitcoin correlation with the selected asset. Threshold can be adjusted between 0 and 1 for adjusting the level for which color changes to orange that is diverged while blue color is correlated. The fixed 0.5 value line changes color with red Bitcoin falling and green Bitcoin rising.
Bitcoin Movement vs. Coin's Movement MTFThis script tracks the percent change of Bitcoin vs. the percent change of the coin on the chart. Crypto markets are usually affected greatly by Bitcoin swings so being able to see if the given coin is trending above or below Bitcoin is useful market data. All choices made with this script are your own! Thanks.

CRC.i Bollinger Bands ®This script is yet another variant of the famous Bollinger Bands® TA tool used to track price volatility as it deviates from the mean of a security using standard deviations (positive &negative). Built for my own personal preferences. But perhaps you might like it, too.
Includes
+ Chart Lines: price, upper and lower bands
+ User Options: SMA length, stdev value
+ Heads up Display (HUD) with TARGET's and other related stats
Bugs? Comments? Requests? Ping me @calmrat

Bitcoin Logarithmic Growth Curves (Gab's Crypto) High Deviation (RED regression band) suggests the highest possible point of a market cycle.
- Lower Deviation (GREEN regression band) suggests the lowest possible point of a market cycle.
- Mid Deviation (YELLOW regression band) suggests the halfway point of the cycle.
- Fibonacci Retracement levels are implemented on top of the data model to predict and determine different milestone , key resistance/support and levels.

Average Total Price From BottomThis is an indicator to help determine where the bottom of the market is currently based on the average close of the previous cycle. This is an idea from @Jay_DCA on YouTube and I thought it would be fun to code. Enjoy!
How to use:
Specify the date at which the bottom of the markets occurred. I added two extra cycle inputs for future usability. So, when the current bottom is found of this bull cycle, make sure to change the date in Bottom 3.

ROC vs BTCThis is a modification of my Rate of Change Percentile script, used to compare the current ticker (e.g. Altcoins) to BTC.
Essentially we are looking at (Current Ticker ROC percentile) vs (Bitcoin ROC percentile).
In other words, we are using the ROC value of both the current ticker and BTC, and ranking each based on their previous ROC.
We compare the rankings to gauge the relative overperformance or underperformance of the current ticker vs BTC.
The blue line is BTC, the columns are the current ticker.
Green columns above the blue line indicate positive ROC and current ticker has higher ROC ranking than BTC.
Red columns below the blue line indicate negative ROC and current ticker has a higher ROC ranking than BTC.
*** PLEASE LEAVE A LIKE AND FOLLOW IF YOU ENJOY THE SCRIPT ***
Any questions, comments or feedback I'd love to hear from you below!

Glassnode BTC SOPR ToolkitSOPR stand for Spent Output Profit Ratio. It’s a Bitcoin on-chain metric that shows whether Bitcoin spent outputs (UTXO’s) are being realized in profit or loss. It’s calculated by dividing realized value by the value at creation (price sold / price paid).
The SOPR metric traditionally uses a baseline of 1 instead of 0. For the purposes of the script, I've changed the baseline to 0.
SOPR signals > 0 show the overall market is transaction at a profit.
SOPR signals < 0 show the overall market is transacting at a loss.
SOPR servers as a great short/mid-term indicator.
SOPR Toolkit Features
- Smoothed SOPR
- SOPR Spikes
Smoothed SOPR
By default, ‘Smoothed SOPR’ is shown which applies a smoothing function to SOPR. This helps to visualize the broader SOPR trend.
Smoothed SOPR is calculated by taking the difference between positive and negative SOPR values.
SOPR is split into separate arrays based on if it's above or below the baseline A moving average is then applied to each array, then subtracted to get the difference.
You can also change whether or not a SMA, EMA, or Volume Weighted Simple/Exponential moving average is used. The VWMA is calculated using Glassnode’s BTC Total Transfer Volume metric.
SOPR Spikes
Shows relevant SOPR spikes.
SOPR spikes is calculated by applying a Bollinger Band to SOPR. Only values spike outside the bands are shown.
Adjust the StdDev to show more/less relevant spikes.
Enjoy :)

Universal logarithmic growth curves, with support and resistanceLogarithmic regression is used to model data where growth or decay accelerates rapidly at first and then slows over time. This model is for the long term series data (such as 10 years time span).
The user can consider entering the market when the price below 25% or 5% confidence and consider take profit when the price goes above 75% or 95% confidence line.
This script is:
- Designed to be usable in all tickers. (not only for bitcoin now!)
- Logarithmic regression and shows support-resistance level
- Shape of lines are all linear adjustable
- Height difference of levels and zones are customizable
- Support and resistance levels are highlighted
Input panel:
- Steps of drawing: Won't change it unless there are display problems.
- Resistance, support, other level color: self-explanatory.
- Stdev multipliers: A constant variable to adjust regression boundaries.
- Fib level N: Base on the relative position of top line and base line. If you don't want all fib levels, you might set all fib levels = 0.5.
- Linear lift up: vertically lift up the whole set of lines. By linear multiplication.
- Curvature constant: It is the base value of the exponential transform before converting it back to the chart and plotting it. A bigger base value will make a more upward curvy line.
FAQ:
Q: How to use it?
A: Click "Fx" in your chart then search this script to get it into your chart. Then right click the price axis, then select "Logarithmic" scale to show the curves probably.
Q: Why release this script?
A: - This script is intended to to fix the current issues of bitcoins growth curve script, and to provide a better version of the logarithmic curve, which is not only for bitcoin , but for all kinds of tickers.
- In the public library there is a hardcoded logarithmic growth curve by @quantadelic . But unfortunately that curve was hardcoded by his manual inputs, which makes the curve stop updating its value since 2019 the date he publish that code. Many users of that script love using it but they realize it was stop updating, many users out there based on @quantadelic version of "bitcoin logarithmic growth curves" and they tried their best to update the coordinates with their own hardcode input values. Eventually, a lot of redundant hardcoded "Bitcoin growth curve" scripts was born in the public library. Which is not a good thing.
Q: What about looking at the regression result with a log scale price axis?
A: You can use this script that I published in a year ago. This script display the result in a log scale price axis.

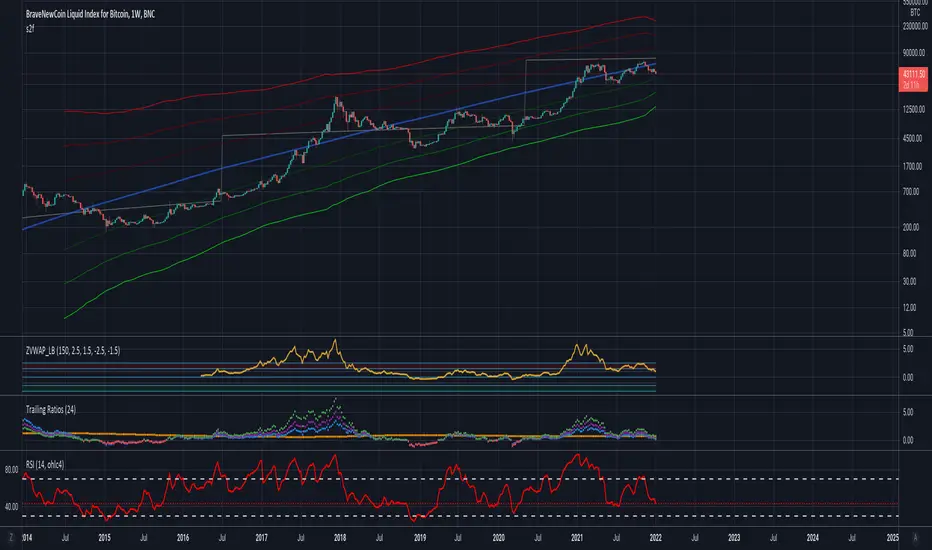
BTC Golden Bottom with Adaptive Moving AverageIntroduction:
This study uses Adaptive Moving Average with 1 year of length to plot on all time history Index Calculated by Tradingview . All previous $BTC bear runs bottomed on this curve which makes it important enough. Use this only on " "
Default Values:
AMA length is 1 year
Minor length is 50
Major length is 100

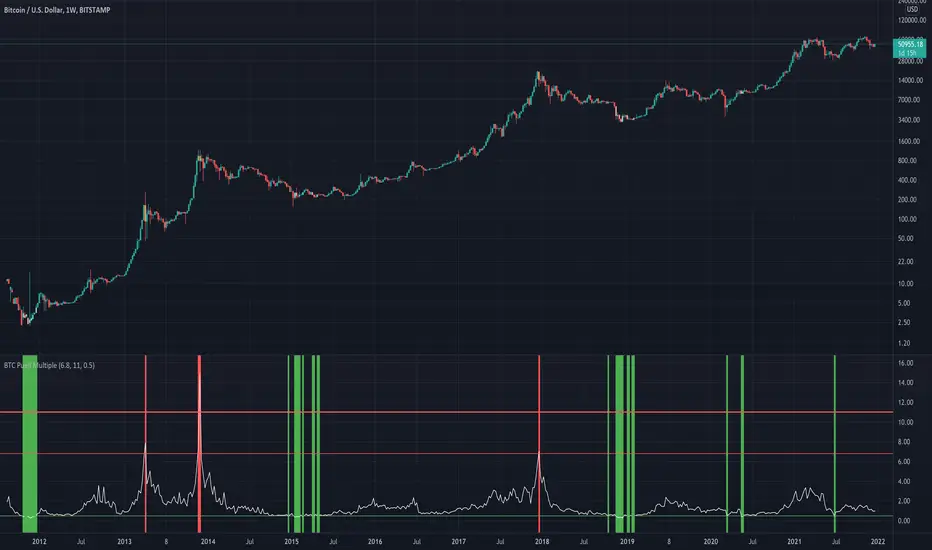
BTC Puell Multiple with alert functionThe Puell Multiple examines the fundamentals of mining profitability and the way they shape market cycles. It is calculated by taking a ratio of daily coin issuance (in USD) and the 365 moving average of daily coin issuance (in USD).
Interpretation of the Puell Multiple can generally be considered in the following framework:
high values indicate that current miner profitability if high compared to the yearly average. As such, the incentive for miners to liquidate their treasuries is high and greater sell pressure may be expected.
Low values indicate that current miner profitability is low compared to the yearly average. As such, income stress may become a factor, and some miners may need to start reducing hash-power by switching off rigs. This increases the hash-share of remaining miners who can then sell fewer coins to cover their operations, reducing their impact on liquid supply.
Halving events will drop the current coin issuance by 50% relative to the preceding year creating an immediate halving of the Puell Multiple also. The effect on miner profitability will thus be as per the point on low values above.
Crypto Market Sentiment B [Morty]The Crypto Market Sentiment B indicator uses perpetual contracts premium to show the fear & greed mood of the Crypto market.
When the market is showing greed at relative highs, it is often a good selling point.
Markets in a panic mood with stable coins flowing back into cryptocurrencies are often bottom reversal points.
Berish divergence of the indicator may signal a major negative price move.
Crypto Market Sentiment Indicator A and Indicator B can be used together.
Here is the link of Indicator A.

Crypto Market Sentiment A [Morty]The Crypto Market Sentiment A indicator shows stablecoin flows of the Crypto market.
It can be used to look at the general trend of stablecoins activity.
When the market is showing greed at relative highs, it is often a good selling point. There will be a market sell-off and investors are expecting the value of their crypto investment to decline, they may rotate into stablecoins as a safe haven, whilst giving them the quick flexibility of deploying capital back into the crypto market easily.
Markets in a panic mood with stable coins flowing back into cryptocurrencies are often bottom reversal points.
Crypto Market Sentiment Indicator A and Indicator B can be used together.
Here is the link of Indicator B.

Bitcoin IV C/FIllustrating Cap-Floor bands based on statistical calculations using the implied volatility of Bitcoin.
Calculation criteria can be chosen in range 1day-365days.

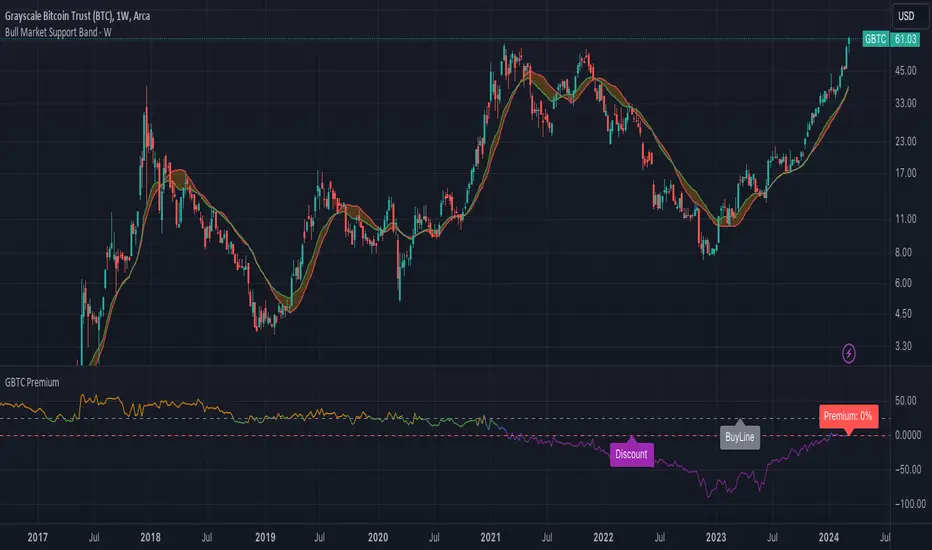
GBTC PremiumCalculates the historical and current premium/discount for a share of Grayscale GBTC vs. Bitcoin spot price.
BTC Strategy - EternalThis is a summary of how this strategy works.
- Momentum, Volatility detection:
1. First of all detects market momentum
2. Uses volume indicators to make sure of the movement existence
- Trade execution:
3. Uses crossovers of some MAs
4. After crossovers, waits for trend analysis indicators signals to trigger the order
- Take profit & Stop loss:
5. Calculates SL and TP using a formula (combined of volume , MAs and others)
* This is just a simple representation of how this strategy works, It's coded in about a 2000 lines script.
As you can see, it has a great performance, 71.59% win rate in 989 trades so it's a very confident result.
This strategy works best on Bitcoin / TetherUS • BINANCE
No setting is needed to be applied by you, you'll just simply add the script and receive alarms.
Alarms are included opening of the trade, TP and SL touch.

Triple CSWhat this indicator does:
This indicator will be scanning for ranges of extremity.
It measures multiple underlying factors in the financial markets like measuring levels of strength using RSI, momentum using Stochastics and extreme ranges using Bollinger Bands.
What is "extreme range" criteria: ranges above 70 or below 30 on RSI and Stoch are considered extreme, as well as moments of extreme volatility exceeding overbought and oversold levels on BBs.
All monitored data is to be plotted in a horizontal row, providing information about oversold, overbought and mid-range market conditions. This data will either meet the criteria simultaneously and plot a Red or Green indication or it will miss one or more requirements, plotting Gray indications.
This indicator is a real-time indicator, meaning it's updating live and due to this tracking in real-time, indications not yet 'printed' can give false readings. For performance purposes, it is best practice to allow all indication plots to 'print', meaning if a plot ever changes in color, it's best to allow that candle to fully close , ticking to 0:00 before confirming the accuracy of the indicator's findings.
How it works:
This indicator scans multiple sources of data simultaneously. When appropriate conditions within a trading range are met, the indicator will update it's color.
The indicator will plot Gray , Green , and Red indications which can be explained below.
-
Grey plots : No indication of full extremity, meaning one or more conditions being tracked has not met requirements, suggesting price is likely in mid-range.
-
Green plots : Extremity level lows have been simultaneously met, data indicates extreme oversold conditions are likely present.
-
Red plots : Extremity level highs have been simultaneously met, data indicates extreme overbought conditions are likely present.
What market will this indicator work on?
Stocks > Forex > Crypto
All the above are supported by this indicator.
Charts with more history have more data for the indicator to utilize. (Lack of data can result in poor performance.)
- This indicator performs best on 4H, 12H, D, and W timeframes, although you can use this indicator on any timeframe TradingView supports.
This indicator was created to find ranges of extreme trade which can help traders be more confident in their timing with the market.
Trading can be difficult, let an algorithm scan the market and monitor for early signs of volatility changes.
Past performance does not guarantee future results. Please do your due diligence when placing trades.

60-Day Accumulated Increasing RateIs this Bitcoin bull run still driven by new investors and new funds? Definitely. That’s why the 60-day accumulative increasing rate is so important and it can even determine everything. The only thing that can be trusted is the math. In history, each capital inflow uptrend bull run has ended once the 60-day accumulative increasing rate reached a high level and when the short-term euphoric investors push BTC price to rise at a fast speed and use up all kinds of leverages. At that point, there’s no time for new investors and new funds to flow in, thus the cryptocurrency market will crash from the global top.
In that sense, the crashes on 4th September, 2017 and 19th May, 2021 didn’t end the bull run, instead,they lengthened the bull run span.The last bull run cycle (2017) might have ended prematurely when BTC reached $10,000, recording 150% accumulated increase over 60 days. Then BTC won’t be pumped up to $20,000 if the course wasn’t interrupted by September 4th, 2017 incident.
Technical analysts(they are far from trustworthy, full of bollocks) call the correction of BTC: “consolidation or wipeout”, just like that diabetes is called as Liver Qi Stagnation, weight lossing, being thirsty and other symptoms. It’s quite fun to watch so many people explaining it in a false concept. Everyone knows what the maths is. That’s enough.
PS: This indicator can only be applied to Bitcoin daily chart!
