Scalping Dips On Trend (by Coinrule)Coinrule's Community is an excellent source of inspiration for our trading strategies.
In these months of Bull Market, our traders opted mostly on buy-the-dips strategies, which resulted in great returns recently. But there has been an element that turned out to be the cause for deep division among the Community.
Is it advisable or not to use a stop-loss during a Bull Market?
This strategy comes with a large stop-loss to offer a safer alternative for those that are not used to trade with a downside protection.
Entry
The strategy buys only when the price is above the Moving Average 50 , making it less risky to buy the dip, which is set to 2%.
The preferred time frame is 1-hour.
The stop-loss is set to be quite loose to increase the chances of closing the trade in profit, yet protecting from unexpected larger drawdowns that could undermine the allocation's liquidity.
Exit
Stop loss: 10%
Take Profit: 3%
In times of Bull Market, such a trading system has a very high percentage of trades closed in profit (ranging between 70% to 80%), which makes it still overall profitable to have a stop-loss three times larger than the take profit.
Pro tip: use a larger stop-loss only when you expect to close in profit most of the trades!
The strategy assumes each order to trade 30% of the available capital and opens a trade at a time. A trading fee of 0.1% is taken into account.
Bitcoin (Mata Wang Kripto)

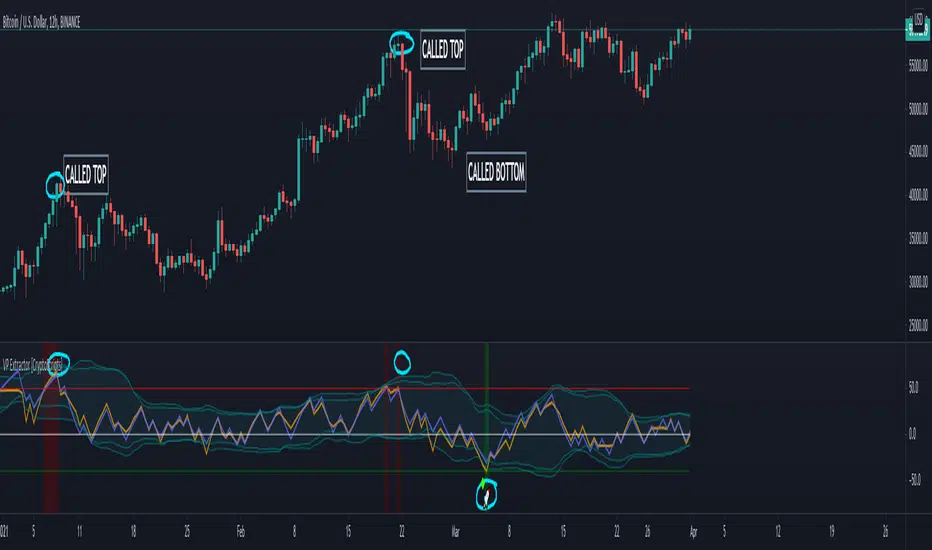
VP Extractor By CryptoScriptsThe VP Extractor is a combination of the Volume Extractor and Price Extractor. There was a lot of coding involved in this one and it involves a Volume/Price Oscillator derived from various volume/price metrics combined with Bollinger Bands and Overbought/Oversold levels. This indicator is unique because it not only measures the standard deviations whenever the oscillator crosses outside the BBs but it does so at ranges that are most advantageous for the trader to identify KEY buy/sell levels (as shown above). I'll break down each signal below and how to best take advantage of them so you can get the best entries and capture the most profit per trade.
*This indicator works best on the Binance or Bybit exchange for crypto but also works for stocks and forex. It's best used on small-medium timeframes such as the 5min, 15m, 1h, 4h, 8hr, or 12h. It tends to give more false signals on the 1D timeframes and higher.
Red Alarm - this signal indicates that the volume and/or price oscillators are overbought and/or crossing outside of the bollinger bands . This is a STRONG sell signal but should still be combined with support/resistance levels and confirmed with other indicators.
Red Diamond - this signal indicates that the volume and price oscillators are crossing outside of the bollinger bands above the 20 level but is not yet overbought. This is a potential sell signal but should still be combined with support/resistance levels and confirmed with other indicators.
Red Shaded Area - this indicates the volume and price oscillators are overbought. This is a potential sell signal but should still be combined with support/resistance levels and confirmed with other indicators.
Rocket - this signal indicates that the volume and/or price oscillators are oversold and/or crossing outside of the bollinger bands . This is a STRONG buy signal but should still be combined with support/resistance levels and confirmed with other indicators.
Green Diamond - this signal indicates that the volume and price oscillators are crossing outside of the bollinger bands below the 20 level but is not yet oversold. This is a potential buy signal but should still be combined with support/resistance levels and confirmed with other indicators.
Green Shaded Area - this indicates the volume and price oscillators are oversold. This is a potential buy signal but should still be combined with support/resistance levels and confirmed with other indicators.
Input Options
Show 80 Levels - This checkbox will create a red zone and green zone for the 60-80 levels on the indicator. This is useful if the volume and price oscillators reaches one of these levels, you can be sure it's going to reverse soon and can have more confidence if it crosses outside of the BBs in addition to that.
VEO Length - This changes the height of the oscillator and will change how your signals flash (more or less often). Use this if you find you're getting too many signals or not enough. I find this is best at 21 but feel free to test out what works for you depending on your timeframe.
PEO Length - This changes the height of the oscillator and will change how your signals flash (more or less often). Use this if you find you're getting too many signals or not enough. I find this is best at 21 but feel free to test out what works for you depending on your timeframe.
Moving Average Volume Source - This is currently set to None but you can change it to Exponential, Hull, or Simple moving average . I found that None works best but feel free to test out the different options.
Moving Average Length - Changing this length will do nothing to your chart if None is selected for the Moving Average Volume Source, therefore you will most likely keep this setting default at 9.
Alerts
I've set alerts on this indicator for each icon (Red Alarm, Red Diamond, Overbought, Rocket, Green Diamond, Oversold). I HIGHLY recommend setting the alerts for Candle Close so that you can be sure the signal is confirmed.
You may notice that the indicator can give multiple signals back-to-back or be overbought/oversold for multiple candles. When this happens, it's best to look at other indicators such as the RSI , MFI Pro, etc to nail the best entry and have confluence with your decision. With that said, having multiple signals back-to-back can also be an indication that the move is close to happening.
This indicator is a strong indicator by itself but works best when combined with my other indicators just as the Whales Buy-Sell and the MFI Pro as well as the RSI, and MACD i.e taking a trade when all indicators are showing overbought, "Buy", "Sell", etc. Measuring volume and price action is an extremely important aspect of trading and one I believe should not be overlooked. I hope I made everything as clear as possible and please let me know if I didn't.
PM me to obtain access and please let me know if you have any questions!
Extreme Money [Crypto Trading FR]Extreme Money aims to smooth out market fluctuations and predict trend changes.
The algorithm shows the turning points in the market and uses multiple filters to present the best potential turning points. Although this is its core functionality, Extreme Money also incorporates a series of popular other indicators (see below) allowing full identification of trends on the chart.
The tool aims to calculate market strength and then show potential turning points in the market signalled with small circles. Once the trend confirmation has changed, the algorithm signals a circle, giving the trader the potentially desired entry with an audible or pop-up alert if needed. The more circles there are when setting up the entry, the greater the chances of a trend reversal.
This algorithm can be used on all time intervals, as well 5, 15 or 30 minutes but it is particularly recommended on the 1H, 2h and 4H intervals for maximum efficiency. The indicator works as well for swing-trading as for intra-day trading: whatever the time interval selected, it filters potential entries with great precision.
The algorithm can also be used with any cryptocurrency or currency pairs from traditional markets, the parameters of the algorithm can be customized and adapted without difficulty.
Extreme Money also includes 8 indicators assembled in a single script, which can be activated or deactivated manually:
1) Algo (main indicator)
2) EMA
3) Hull
4) Trend
5) Pivots
6) Trend line
7) VWAP Line
8) RSI Swing
Benefits :
- Notifies the trader of potential entries
- Color coded entries for buying and selling
- Creates cluster signals at potential turn points
- Aims to avoid market noise
- Used on all types of timefames
- Analyze the current market trend
- Assists in Predicting Market Turn Points
- Cryptocurrency, FX, stock indices and gold trades
- Maximize profits
- Analyzed market strength and weakness

Bitcoin Perpetual SwapsThis script track most important Bitcoin Perpetual Swaps vs SPOT (Coinbase).
When strong green color emerge implies that Swaps are trading at premium to spot.
When strong red color emerge implies that Swaps are trading at discount to spot.
These information is useful because it give leading information towards where funding rates are heading.
When trading at premium it will push towards Positive Funding Rates (Longs pay Shorts)
When trading at discount it will push towards Negative Funding Rates (Shorts pay Longs)
It's can also be used to give identify potential local tops or bots when values get too extreme.

Volume RSI Crypto This is a special version RSI, in this case , I am using the volume, which is measuring the speed and change of volume to the price both up and down size.
Volume RSI attempts to gauge price trend changes via changes in bullish and bearish movements.
Its formula is :
VoRSI = 100 - 100 / (1 + VoRS)
where VoRS is Volume Relative Strength over specified period which is calculated as a ratio between averages of Up-Volumes and Down-Volumes:
VoRS = (Average Up-Volume) / (Average Down-Volume)
The logic for this strategy is simple
We entry long when we have a crossover with the Overbought level and we entry short when we have a crossunder with oversold level.
If you have any questions, please let me knw !

Simple BTC scalper 1minThis is a simple but effiecient 1 min scalper for BTC pairs
Its made of EMA 200 and Stochastic RSI.
Rules are simple :
For long we check that close is above the EMA and that stochastic crosses on the 20 level.
For short we check that close is below the EMA and that stochastic crosses above the 80 level.
We exit long when we enter short, and viceversa for short.
If there are any questions, please let me know !

BTC/usd BTC/usdt Volume & AltcoinsMarketcap dominance BithanosIndex introduction:
Function 1 of this indicator:Display the average trading volume of the 8 major BTC spot exchanges.
Bitcoin trading volume select BTC /USD
VOLBITSTAMP
VOLCOINBASE
VOLGEMINI
VOLKRAKEN
Bitcoin trading volume select BTC /USDT
VOLHUOBI
VOLBINANCE
VOLOKEX
VOLBITFINEX
Average trading volume = ( BTC /USD trading volume aggregation + BTC /USDT trading volume aggregation) / 8
This indicator function 2:Display BTC /USD trading volume as a percentage of total trading volume .
BTC /USD trading volume ratio = BTC /USD trading volume aggregation / ( BTC /USD trading volume aggregation + BTC /USDT trading volume aggregation)*100%
This indicator function 3:Displays the percentage of the market value of altcoins in the total market value of the cryptocurrency market.
Market value of altcoins = total market value of altcoins / total market value of cryptocurrencies * 100%
Glossary:
"MA length volume moving average period"
"Adopt Vol MA Enable Volume Moving Average"
"Vol average BTC combin shows the average trading volume of the 8 largest BTC spot exchanges"
"Adopt Btc /Usd Vol% Enable Btc /Usd Vol %"
"Adopt ALTS marketcap% enabled altcoin market cap"
"EmaBoll for Vol% / Marketcap% The Bollinger Bands based on Ema's mid-rail can be used for the volume ratio or the market value ratio"
本指标功能1:显示8大BTC现货交易所均摊成交量。
比特币成交量选取 BTC /USD
VOLBITSTAMP
VOLCOINBASE
VOLGEMINI
VOLKRAKEN
比特币成交量选取 BTC /USDT
VOLHUOBI
VOLBINANCE
VOLOKEX
VOLBITFINEX
均摊成交量 = (BTC/USD 成交量聚合 + BTC /USDT 成交量聚合)/ 8
本指标功能2:显示BTC/USD 成交量 占总成交量百分比。
BTC /USD 成交量占比 = BTC /USD 成交量聚合 / (BTC/USD 成交量聚合 + BTC /USDT 成交量聚合)*100%
本指标功能3:显示 山寨币市值 占据 加密货币市场总市值 百分比。
山寨币市值 占比 = 山寨币总市值 / 加密货币总市值 * 100%
名词解释:
" MA length 成交量均线周期"
"Adopt Vol MA 启用成交量均线"
"Vol average BTC combin 显示8大BTC现货交易所均摊成交量"
"Adopt Btc /Usd Vol % 启用Btc/Usd成交量占比"
"Adopt ALTS marketcap % 启用山寨币市值占比"
"EmaBoll for Vol% / Marketcap% 基于Ema中轨的布林带 可用于成交量占比 或 市值占比"

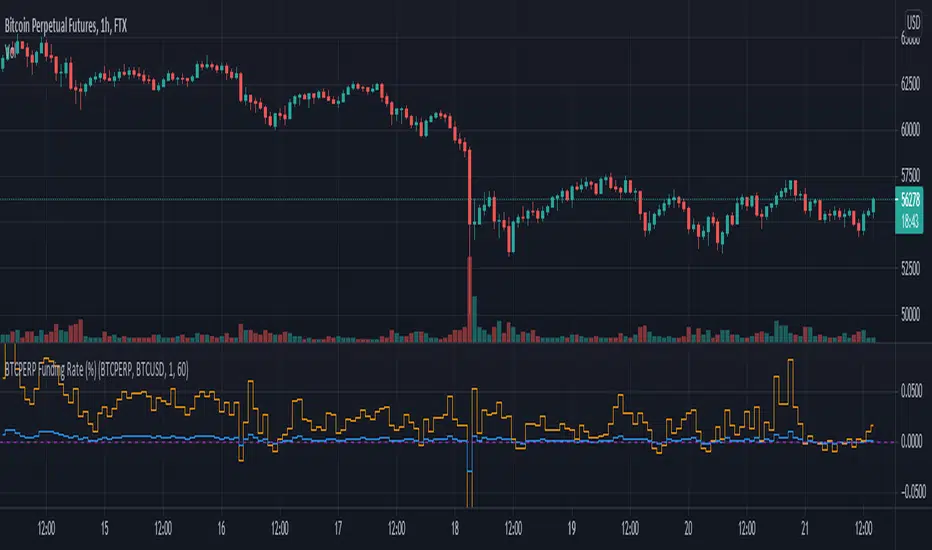
Funding Rate for FTX:BTCPERP (estimated) v0.1 Original credits goes to @Hayemaker, and @NeoButane for the TWAP portions of this script
By @davewhiiite, 2021-03-27
Version 0.1
Summary: The funding rate is the interest charged / credited to a perpetual futures trader for taking a long or short position. The direction of the funding rate is used as an indicator of trader sentiment (+ve = bullish; -ve = bearish), and therefore useful to plot in real time.
The FTX exchange has published the calculation of their funding rate as follows:
TWAP((future - index) / index) / 24
The formula here is the same, but expresses it in the more common % per 8hr duration:
funding = TWAP((future / index) - 1) * (8 / 24) * 100
For reference: future refers to the FTX bitcoin futures contract price (FTX:BTCPERP) and index is the spot price of bitcoin on the exchange (FTX:BTCUSD)
Additional notes:
Probably best to add to the indicator to a new pane, or as secondary axis
Plot this in combination with FTX:BTCPERP or FTX:BTCUSD, or chart of your choice to complement your bitcoin dashboard
Compare to funding rates published on ViewBase
questions? Ask me!
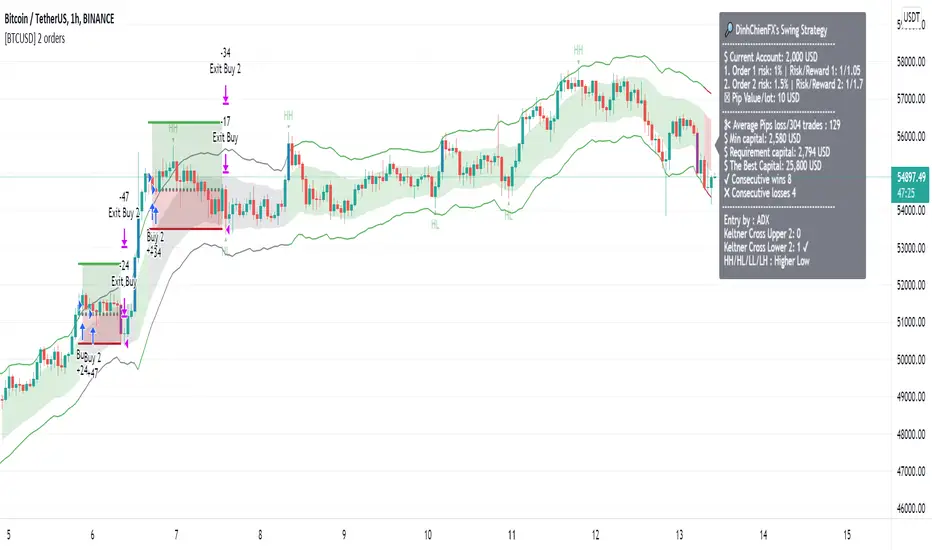
[BTCUSD] DinhChienFX [2 orders]* Historical statistics from 2018:
* Strategy will enter 2 orders, Order 2 will appear only when there is Order 1:
- Percent profitable of 1st order: 64.76%.
- Percent profitable of 2nd order: 49.86%.
- Average percent profitable: 57.31%.
- 14 consecutive wins.
- 4 consecutive losses.
Order 1: risk / reward ratio 1/1 used to determine if this rule is effective or not?
Order 2: Appears when there is order 1, Use take-profit and take-loss level of order 1 at Fibonacci 75%.
. * 1st Order conditions:
- Buy: When the ADX index cuts up to 45, check earlier if the closing price has cut up and is above the Upper 2 line, enter the Buy order.
- Sell: when the ADX indicator cuts up to 45, check before that if the closing price has cut down and is above Lower 2 then enter a Sell order.
* How to enter Order 2: When order 1 appears, there are always Stoploss and Takeprofit levels. Draw Fibonacci from take-profit and take-loss prices, Fibonacci retracement level = 75%
----------------
1. Trend identification:
- Channel Keltner:
... Uptrend: when the closing candlestick cuts up and is above the Keltner channel, the Upper Line 2
... Down trend: when the candle closes and falls above the Keltner Line Lower 2
2. Rules of entry:
- Channel Keltner:
... Buy: Candlestick closing price cuts up and above the Keltner Upper 2.
... Sell: The closing price of the candle cuts down and is lower than the Keltner Below 2.
ADX indicator:
... Buy: The ADX value crossed to 45 and the close of the candle was higher than Keltner Upper 2.
... Sell: ADX value cuts to 45 and the close of the candle is lower than Keltner Below 2.
3. Stoploss and Profit = atr (20) * 2.
Volume Extractor By CryptoScriptsThe Volume Extractor is an indicator I've been working on for awhile that involves a Volume Oscillator derived from various volume metrics combined with Bollinger Bands and Overbought/Oversold levels. This indicator is unique because it not only measures the standard deviations whenever the oscillator crosses outside the BBs but it does so at ranges that are most advantageous for the trader to identify KEY buy/sell levels (as shown above). I'll break down each signal below and how to best take advantage of them so you can get the best entries and capture the most profit per trade.
*This indicator works best on the Binance or Bybit exchange for crypto but also works for stocks and forex. It's best used on small-medium timeframes such as the 15m, 1h, 4h, 8hr, or 12h. It tends to give more false signals on the 1D timeframes and higher.
Red Alarm - this signal indicates that the volume oscillator is overbought AND is crossing outside of the bollinger bands . This is a STRONG sell signal but should still be combined with support/resistance levels and confirmed with other indicators.
Red Diamond - this signal indicates that the volume oscillator is crossing outside of the bollinger bands above the 20 level but is not yet overbought. This is a potential sell signal but should still be combined with support/resistance levels and confirmed with other indicators.
Red Shaded Area - this indicates the volume oscillator is overbought. This is a potential sell signal but should still be combined with support/resistance levels and confirmed with other indicators.
Rocket - this signal indicates that the volume oscillator is oversold AND is crossing outside of the bollinger bands . This is a STRONG buy signal but should still be combined with support/resistance levels and confirmed with other indicators.
Green Diamond - this signal indicates that the volume oscillator is crossing outside of the bollinger bands below the 20 level but is not yet oversold. This is a potential buy signal but should still be combined with support/resistance levels and confirmed with other indicators.
Green Shaded Area - this indicates the volume oscillator is oversold. This is a potential buy signal but should still be combined with support/resistance levels and confirmed with other indicators.
Input Options
Show 80 Levels - This checkbox will create a red zone and green zone for the 60-80 levels on the indicator. This is useful if the volume oscillator reaches one of these levels, you can be sure it's going to reverse soon and can have more confidence if it crosses outside of the BBs in addition to that.
VEO Length - This changes the height of the oscillator and will change how your signals flash (more or less often). Use this if you find you're getting too many signals or not enough. I find this is best at 21 but feel free to test out what works for you depending on your timeframe.
Moving Average Volume Source - This is currently set to None but you can change it to Exponential, Hull, or Simple moving average . I found that None works best but feel free to test out the different options.
Moving Average Length - Changing this length will do nothing to your chart if None is selected for the Moving Average Volume Source, therefore you will most likely keep this setting default at 9.
Alerts
I've set alerts on this indicator for each icon (Red Alarm, Red Diamond, Overbought, Rocket, Green Diamond, Oversold). I HIGHLY recommend setting the alerts for Candle Close so that you can be sure the signal is confirmed.
You may notice that the indicator can give multiple signals back-to-back or be overbought/oversold for multiple candles. When this happens, it's best to look at other indicators such as the RSI , MFI Pro, etc to nail the best entry and have confluence with your decision. With that said, having multiple signals back-to-back can also be an indication that the move is close to happening.
This indicator is a strong indicator by itself but works best when paired with my Price Extractor indicator i.e taking a trade when both indicators are displaying overbought/oversold or crossing outside of the bollinger bands . Measuring price action is an extremely important aspect of trading and one I believe should not be overlooked. I hope I made everything as clear as possible and please let me know if I didn't.
PM me to obtain access and please let me know if you have any questions!

Lash Out OscillatorPurpose of this Script
The Lash Out Oscillator (LOO) is designed to indicate local tops and bottoms of the considered asset when the price considerably 'lashes out', based on normalized price deltas. It also features divergences that can be used for trading. The LOO is mainly used for Ethereum (ETH) and Bitcoin (BTC), but can in theory be used for every asset. Customization of the input settings is then needed to match the boundaries well to the historic price data. The default parameters are tuned for Ethereum.
Settings
Default input settings are tuned for Ethereum (ETH/USD) on Kraken on daily (D) timeframe.
Generally best used on daily (D) timeframe. You might also want to test the 4-hourly (4H) timeframe.
After applying the indicator to the chart, one typically has to zoom into the oscillator as the raw price delta is also plotted (in blue) which often overshadows the oscillator in magnitude.
For all other assets besides Ethereum, the oscillator and boundary values have (very likely) to be adjusted.
All individual pieces can be hidden from the chart (especially important as one might want to hide the blue raw price delta as it could disturb the process of tuning the oscillator due to automatic zoom-outs).
Input Settings for Bitcoin
Aside from Ethereum (default settings), I provide the following settings which can be used for Bitcoin (BNC:BLX) on daily (D) timeframe:
Averaging Length: 20
Donchian Length: 40
Donchian Scaling: 0.2
Fixed Red High: 6.1
Fixed Red Low: 2.3
Fixed Green High: -2.3
Fixed Green Low: -6.1
Still, feel free to tune the LOO to your liking.
Differences to Classic Oscillators as e.g. Relative Strength Index (RSI)
Classic oscillators as the RSI feature fixed limit values (e.g. 0 to 100 for the RSI) and are therefore (as the name says) very relative (you cannot reliably guess tops or bottoms just from the RSI value). The LOO features non-fixed limit values (they can theoretically go to infinity, but are in practice very well contained within some range), leading to less relativity and more absolute behaviour, which is beneficial in spotting local tops and bottoms. Just as the RSI, the LOO shows (bullish and bearish) divergences on the chart, which can be used for refined trading.
Interpretation
Given are two boundary types:
Fixed boundary areas
Donchian channels
Normally one should look out for the LOO to hit the red or green fixed boundary areas. Although the range is in theory infinite, the fixed areas give good hints when a local top could be hit, at least for the Ethereum case. For additional trades one can look for the LOO to hit the Donchian channels. Note that these areas/channels have to be adjusted by hand for all other assets besides Ethereum. General trading ideas are:
After the red (green) area is hit, a short- to mid-term (depends on market phase) short/hedge (long) trade might be in order.
During full bullruns (bearmarkets), the LOO can extend a bit more into the red (green) area. Here look out for bearish (bullish) divergences to possibly enter mid-term trades.
After the upper (lower) Donchian channel is hit, a short/hedge (long) trade could be wagered.
Alerts
Alerts are built-in that trigger when the LOO crosses into the red or green fixed boundary regions.
Access
For access to this indicator please contact me via DM on TradingView or on Twitter (linked on my TradingView profile and in my signature).

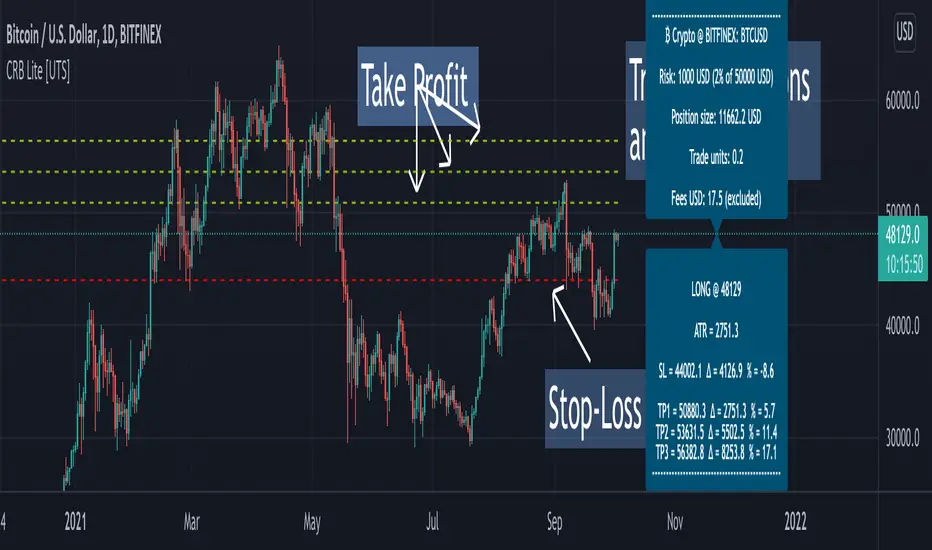
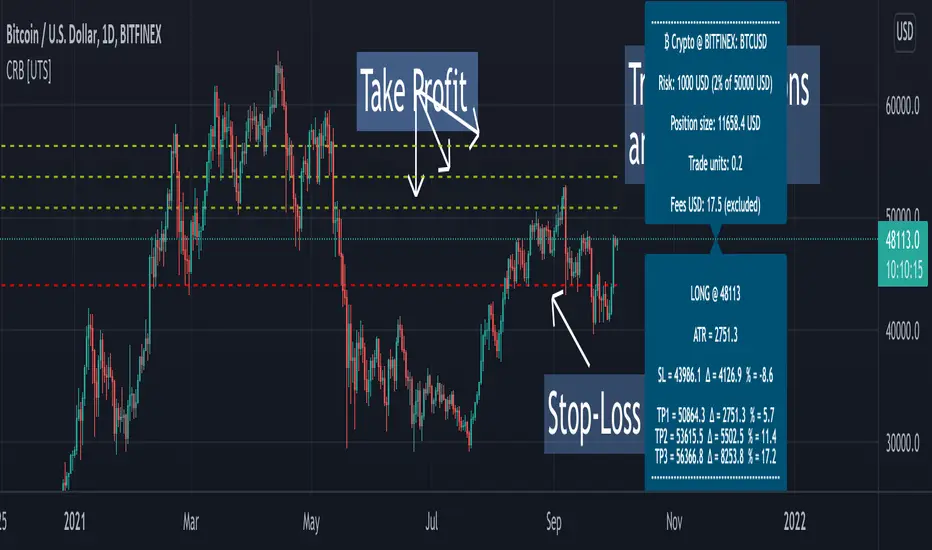
Crypto Risk Buddy - Lite: Position Size, SL & TP System [UTS]
Crypto Risk Buddy - Lite
Position Size, Stop Loss & Take Profit System
The ultimate system to calculate trading risk on crypto assets.
The 'Lite' version is limited to BTC as base currency.
₿ Cyptocurrencies
Position Sizing
De-risk possible drawdown by calculating a proper position size.
Define your risk percent based on your net value
Freely define your account currency
Trade any asset by the customizable Base / Quote currency factor
Calculate trading fees
Show all information on a customizable data screen
Stop Loss
Minimize trade risk by calculating your stop-loss.
Percent, Value and Delta display from current price
ATR based (Average True Range, modifiable)
Custom SL value possible
Adjustable
Two visual representations on chart
Automatically and real-time calculated on screen
Take Profit
Multiple take-profit levels to ensure not giving back to the market.
Up to 3 take profit levels to define
ATR based (Average True Range, modifiable)
Custom TP values possible
Easily customizable
Two visual representations on chart
Automatically and real-time calculated on screen
Currencies
Choose an account currency and calculate your risk for every trading pair.
USD
EUR
GBP
AUD
CAD
CHF
HKD
JPY
NOK
NZD
RUB
SEK
SGD
TRY
ZAR
BTC (crypto)
ETH (crypto)
USDT (crypto)
BUSD (crypto)
USDC (crypto)
Crypto Risk Buddy: Position Size, SL & TP System [UTS]
Crypto Risk Buddy
Position Size, Stop Loss & Take Profit System
The ultimate system to calculate trading risk on crypto assets.
₿ Cyptocurrencies
Position Sizing
De-risk possible drawdown by calculating a proper position size.
Define your risk percent based on your net value
Freely define your account currency
Trade any asset by the customizable Base / Quote currency factor
Calculate trading fees
Show all information on a customizable data screen
Stop Loss
Minimize trade risk by calculatig your stop-loss.
Percent, Value and Delta display from current price
ATR based (Average True Range, modifiable)
Custom SL value possible
Adjustable
Two visual representations on chart
Automatically and real-time calculated on screen
Take Profit
Multiple take-profit levels to ensure not giving back to the market.
Up to 3 take profit levels to define
ATR based (Average True Range, modifiable)
Custom TP values possible
Easily customizable
Two visual representations on chart
Automatically and real-time calculated on screen
Currencies
Choose an account currency and calculate your risk for every trading pair.
USD
EUR
GBP
AUD
CAD
CHF
HKD
JPY
NOK
NZD
RUB
SEK
SGD
TRY
ZAR
BTC (crypto)
ETH (crypto)
USDT (crypto)
BUSD (crypto)
USDC (crypto)
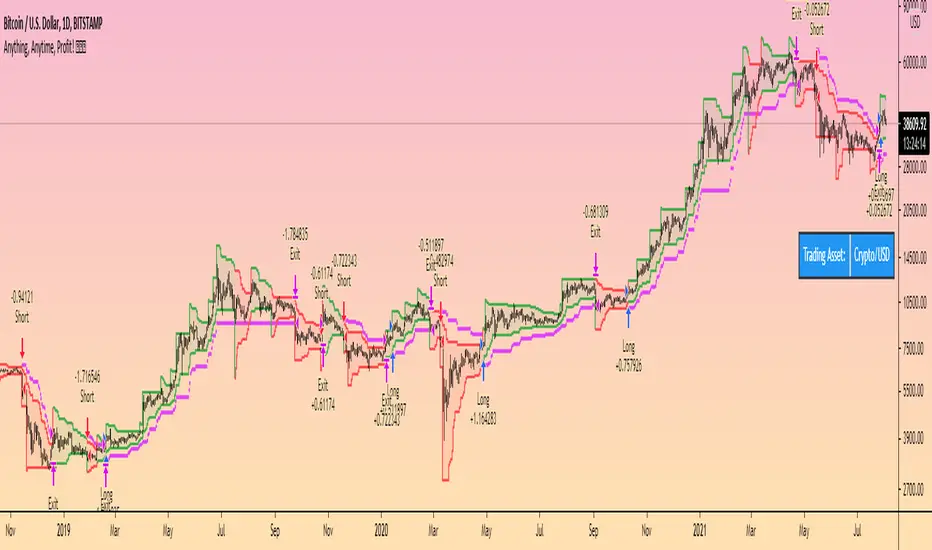
Bull Market Trend Following StrategyThis Bull Market Trend Following Strategy is perfect for long or short term Crypto or traditional market trading and investing.
It is based mainly on the ATR indicator and will therefore adapt to any market conditions and volatility.
It has a number of variable options to try and maximise gains, including stop loss and take profit points, and the ability to wait for pullbacks.
Please let me know if you find any optimal settings, and don't hesitate to ask any questions I'm always happy to help.
Thanks a lot.
Bitcoin Bullrun ATHFind Bitcoin's next ATH before bearmarket.
This indicator, which successfully indicated the 3 previous tops, has been modified and improved.
Its precision is the most accurate on the 2h timeframe.
3 features:
- A visual percentage gauge will show the next potential high of the current bull run when it reaches 100%
- Possibility to add an alert when the gauge reaches 100%. To do this, go to the tradingview alert menu and instead of the ticker, choose "Bitcoin Bullrun ATH" (Don't forget to set the timeframe on 2h or less.)
- Possibility to choose if you want to see or not the tips/gauge/percentage only.
Welcome and have a good bull run.

[astropark] Volume AnalyzerDear Followers,
today another awesome Analysis Tool, that you can use for day scalping: Volume Analyzer !
This indicator
works on every market, pair and timeframe
lets you see analysis of a different timeframes using the resolution parameter
has an optional trend colored background (I suggest to disable it if you use a different resolution)
integrates a tape profit strategy based on RSI (you can config it and enable/disable it)
lets you setup alarms on bull/bear signal as well as on TP RSI-based signals
I prefer to use this indicator in my day trading on low timeframes , like 5m - 15m - 1h, as you can have access to a more detailed volume information, but it works on high timeframes too as you can see in examples at the bottom of the description.
I truly think that Volume says a lot about future price action, as stated in my Cumulative Volume Delta (CVD) indicator, which you can find here below:
In this indicator, I'm much more interested in the bullish or bearish effect of volume generated by traders and following price action.
Be sure to understand that at current status this is not a complete automated strategy, but an analysis tool which aims to give you a positive bias, a profitable hedge in your trading journey.
As I always say, all tools are great if you use them correctly: this is not the "Holy Grail", so always use proper money and risk management strategies.
This indicator quite often calls bottoms and tops , most of the times it announces a coming reversals , sometimes it fails too of course.
Check this screenshot to have a clear idea of what I'm talking about:
You are supposed to discard signals of the same type that comes later and at a worse price (related to the trend) or you can use to re-fill your still-open position, using it as a re-entry.
You are supposed to act at first signals and average up/down if price goes against you when a new bear/bull signal appears at a better price.
Here it is another element you must consider: price action can deny a reversal stated by volume analysis .
In these cases, you must apply a stop loss in your trade and reverse your position. Don't average up/down your entry.
The reason in this screenshot below:
As you can see, the local downtrend was broken, as it was a simple pullback, previous bull trend was restored and price went up a lot!
The indicator here detected bears rejecting the run-up as much violently as they could, but that was a pullback, nothing more than that: main bull trend was still intact.
Another important advice: don't be greedy, always remember to take profits ! Avoid turning a winning trade into a losing one, which is a common mistake traders do.
That's why I decided to include an RSI based Take Profit algorithm inside:
when background is colored by green (and you can't see any bull signal), then you are in over bought region: start taking profits on you buy/long position or close it or set a trailing stop or a stop loss in profit!
when background is colored by red (and you can't see any bear signal), then you are in over sold region: start taking profits on you sell/short position or close it or set a trailing stop or a stop loss in profit!
when price is in a big overbought or oversold region, then you can see a "ob" label or a "os" label respectively
if you are in a bullish trend (you can see it from the trend colored green background as last signal was a "bull" one), "ob" becomes a clear "tp" - Take Profit advice
if you are in a bearish trend (you can see it from the trend colored red background as last signal was a "bear" one), "os" becomes a clear "tp" - Take Profit advice
Here some examples how you can use the signals produced by the indicator in order to be a successful trader.
I circled with pink signals you as supposed to take, then with a "$" pink backgrounded region where you are supposed to take profits, I finally put an X on failing signals, where you would theoretically have been stopped-out.
GBPUSD, 15m
ETHUSD, 1h
TSLA, 5m
BTCUSD, 15m
XAGUSD, 1h
EURUSD, 15m
SPX500, 1h
ETHUSD, 1D
ETHBTC, 6h
This is a premium indicator , so send me a private message in order to get access to this script.

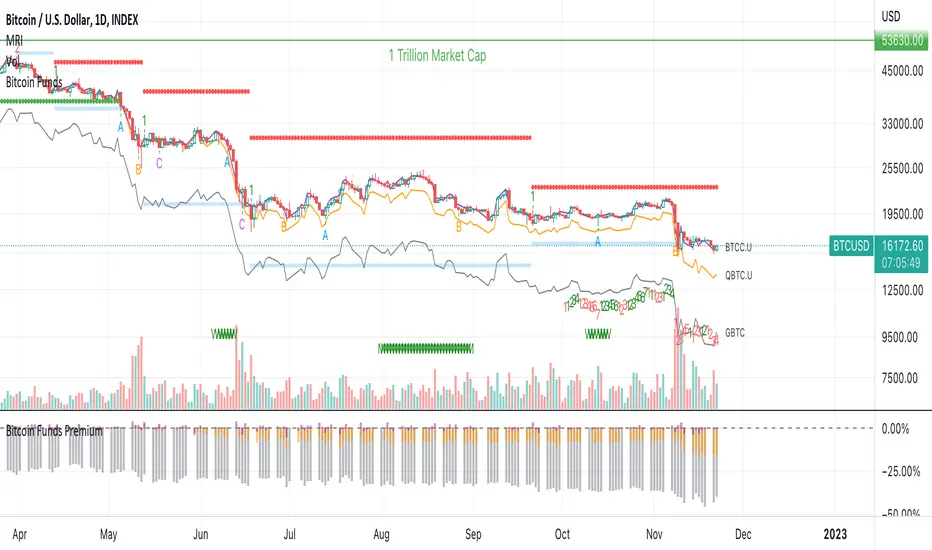
Bitcoin Funds PremiumDisplay the % premium of 4 different Bitcoin Funds relative to the price of Bitcoin in your current chart.
BTCC ETF
QBTC Fund
GBTC Trust
VBTC ETN
This indicator uses the metrics from the fund management websites to calculate the "Net Asset Value per Unit (NAVPU)" to calculate the true underlying value of the fund.
The difference is then compared to the price of Bitcoin in the chart you have open.
Note that the metrics change and therefore the graph is not accurate for long past timeframes.
If TradingView would expand their script language in a way to ingest CSV data from the funds website then this could be improved.
You can update the metrics for each fund in the settings dialogue.
The script will autodetect the currency pairs of your current graph and only display compatible funds:
BTC / USD will show BTCC.U, QBTC.U and GBTC
BTC / CAD will show BTCC and QBTC
BTC / EUR will show VBTC
The script should not show in other currency pairs so it will not mess up other charts you might switch to.
If you find bugs with this logic, please comment below so I can fix them.
Due to TradingViews "no-links in description" policy, you need to google each funds website yourself to find the current metrics. These search terms should help:
BTCC search "Purpose Bitcoin ETF"
QBTC search "3iq The Bitcoin Fund (QBTC)"
GBTC search "Grayscale® Bitcoin Trust"
VBTC search "VanEck Vectors Bitcoin ETN"
Price Extractor By CryptoScriptsThe Price Extractor is an indicator I've been working on for awhile that involves a Price Oscillator derived from various moving averages combined with Bollinger Bands and Overbought/Oversold levels. This indicator is unique because it not only measures the standard deviations whenever the oscillator crosses outside the BBs but it does so at ranges that are most advantageous for the trader to identify KEY buy/sell levels (as shown above). I'll break down each signal below and how to best take advantage of them so you can get the best entries and capture the most profit per trade.
*This indicator works best on the Binance or Bybit exchange for crypto but also works for stocks and forex. It's best used on small-medium timeframes such as the 15m, 1h, 4h, 8hr, or 12h. It tends to give more false signals on the 1D timeframes and higher.
Red Alarm - this signal indicates that the price oscillator is overbought AND is crossing outside of the bollinger bands. This is a STRONG sell signal but should still be combined with support/resistance levels and confirmed with other indicators.
Red Diamond - this signal indicates that the price oscillator is crossing outside of the bollinger bands above the 20 level but is not yet overbought. This is a potential sell signal but should still be combined with support/resistance levels and confirmed with other indicators.
Red Shaded Area - this indicates the price oscillator is overbought. This is a potential sell signal but should still be combined with support/resistance levels and confirmed with other indicators.
Rocket - this signal indicates that the price oscillator is oversold AND is crossing outside of the bollinger bands. This is a STRONG buy signal but should still be combined with support/resistance levels and confirmed with other indicators.
Green Diamond - this signal indicates that the price oscillator is crossing outside of the bollinger bands below the 20 level but is not yet oversold. This is a potential buy signal but should still be combined with support/resistance levels and confirmed with other indicators.
Green Shaded Area - this indicates the price oscillator is oversold. This is a potential buy signal but should still be combined with support/resistance levels and confirmed with other indicators.
Input Options
Show 80 Levels - This checkbox will create a red zone and green zone for the 60-80 levels on the indicator. This is useful if the price oscillator reaches one of these levels, you can be sure it's going to reverse soon and can have more confidence if it crosses outside of the BBs in addition to that.
PEO Length - This changes the height of the oscillator and will change how your signals flash (more or less often). Use this if you find you're getting too many signals or not enough. I find this is best at 21 but feel free to test out what works for you depending on your timeframe.
Moving Average Price Source - This is currently set to None but you can change it to Exponential, Hull, or Simple moving average. I found that None works best but feel free to test out the different options.
Moving Average Length - Changing this length will do nothing to your chart if None is selected for the Moving Average Price Source, therefore you will most likely keep this setting default at 9.
Alerts
I've set alerts on this indicator for each icon (Red Alarm, Red Diamond, Overbought, Rocket, Green Diamond, Oversold). I HIGHLY recommend setting the alerts for Candle Close so that you can be sure the signal is confirmed.
You may notice that the indicator can give multiple signals back-to-back or be overbought/oversold for multiple candles. When this happens, it's best to look at other indicators such as the RSI, MFI Pro, etc to nail the best entry and have confluence with your decision. With that said, having multiple signals back-to-back can also be an indication that the move is close to happening.
This indicator is a strong indicator by itself but works best when paired with my Volume Extractor indicator i.e taking a trade when both indicators are displaying overbought/oversold or crossing outside of the bollinger bands. Measuring price action is an extremely important aspect of trading and one I believe should not be overlooked. I hope I made everything as clear as possible and please let me know if I didn't.
PM me to obtain access and please let me know if you have any questions!

BTC Prices IndicatorThis indicator shows you the prices of 4 of the top cryptocurrency exchanges: Binance, BitMEX, Coinbase, and, Bybit. The prices are updated each minute and can be useful for showing you what type of market is leading a particular run.
E.g Coinbase premium shows spot buyers are leading a rally.

Keltner + RSI Bitcoin Futures Trading [luca_badoer]This indicator combines the power of the Keltner channel with the power of the Relative Strength Indicator (RSI). It can help understand when the market is entering a bullish or a bearish trend.
Normally a Keltner channel would reference an Exponential Moving Average (EMA) of the price. In this case the Keltner Channel in the "Keltner + RSI Bitcoin Futures Trading " references the EMA of the 14-day RSI (white line). On top of that it overlays a 7-day RSI line (blue line). This produces some signals that are particularly useful in 2h, 4h and 1 day charts. The signals consist in the 7-day RSI line (blue line) crossing the upper (green) or lower (red) Keltner channels as well as the middle (white) line. Depending on the direction of the crossing (up or down) and the RSI level (from 0 to 100) at which the crossing takes place this produces bullish or bearish signals.
Examples:
- Bullish crossing: 7-day RSI (blue) crosses both the lower (red) and middle (white) lines upwards at a low to neutral RSI level (<70%)
- Bearish crossing: 7-day RSI (blue) cross both the upper (green) and middle (white) lines downwards at a high to neutral RSI (>30%)
Recommendations:
- Better to use it in 2h, 4h, and 1-day charts, thought it can also be used in lower timeframes. Confirmations of crossings in higher time-frames provide more certainty about the direction of the move.
- Use in combination with Heikin Ashi candles and volume indicators.

BTC Multi Exchange Perpetual PremiumThis script tracks the premium/discount of Bitcoin perpetual contracts at various exchanges.
The premium/discount is calculated against an index price. The index price is calculated from spot exchange prices and are weighted as follows:
Bitstamp:28,81%
Bittrex:5,5%
Coinbase: 38,07%
Gemini: 7,34%
Kraken: 20,28
The difference between this script and other available scripts, is that exciting script seems to only focus on one exchange. This script is also open source.

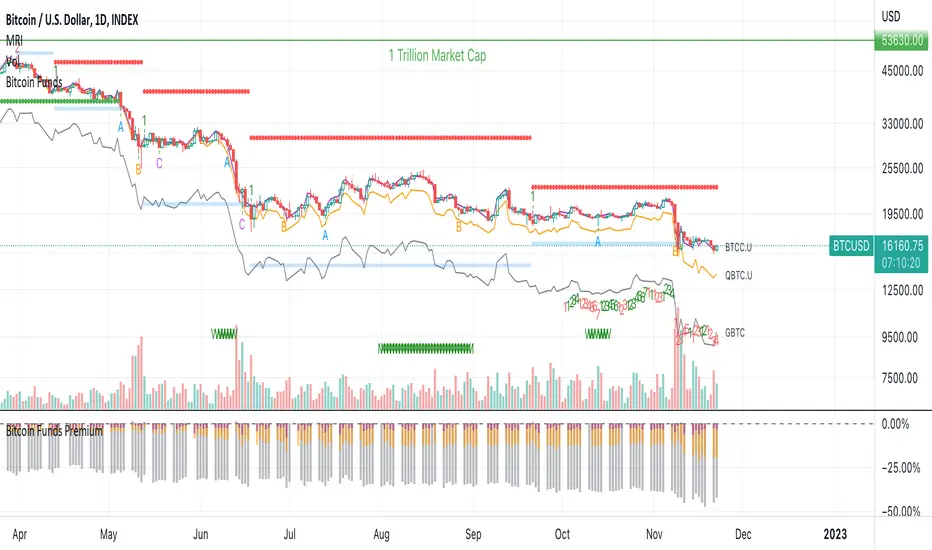
Bitcoin Funds OverlayOverlay the Net Asset Value per Unit (NAVPU) of 4 different Bitcoin Funds on your Bitcoin chart.
BTCC ETF
QBTC Fund
GBTC Trust
VBTC ETN
This indicator uses the metrics from the fund management websites to calculate the "Net Asset Value per Unit (NAVPU)" to display the true underlying value of the fund.
Note that the metrics can change and therefore the graph is not accurate for long past timeframes.
You can update the metrics for each fund in the settings dialogue.
The script will autodetect the currency pairs of your current graph and only display compatible funds:
BTC / USD will show BTCC.U, QBTC.U and GBTC
BTC / CAD will show BTCC and QBTC
BTC / EUR will show VBTC
The script should not show in other currency pairs so it will not mess up other charts you might switch to.
If you find bugs with this logic, please comment below so I can fix them.
Due to TradingViews "no-links in description" policy, you need to google each funds website yourself to find the current metrics. These search terms should help:
BTCC search "Purpose Bitcoin ETF"
QBTC search "3iq The Bitcoin Fund (QBTC)"
GBTC search "Grayscale® Bitcoin Trust"
VBTC search "VanEck Vectors Bitcoin ETN"
Flawless Victory Strategy - 15min BTC Machine Learning StrategyHello everyone, I am a heavy Python programmer bringing machine learning to TradingView. This 15 minute Bitcoin Long strategy was created using a machine learning library and 1 year of historical data in Python. Every parameter is hyper optimized to bring you the most profitable buy and sell signals for Bitcoin on the 15min chart. The historical Bitcoin data was gathered from Binance API, in case you want to know the best exchange to use this long strategy. It is a simple Bollinger Band and RSI strategy with two versions included in the tradingview settings. The first version has a Sharpe Ratio of 7.5 which is amazing, and the second version includes the best stop loss and take profit positions with a Sharpe Ratio of 2.5 . Let me talk a little bit more about how the strategy works. The buy signal is triggered when close price is less than lower Bollinger Band at Std Dev 1, and the RSI is greater than a certain value. The sell signal is triggered when close price is greater than upper Bollinger Band at Std Dev 1, and the RSI is greater than a certain value. What makes this strategy interesting is the parameters the Machine Learning library found when backtesting for the best Sharpe Ratio. I left my computer on for about 28 hours to fully backtest 5000 EPOCHS and get the results. I was able to create a great strategy that might be one of TradingView's best strategies out on the website today. I will continue to apply machine learning to all my strategies from here on forward. Please Let me know if you have any questions or certain strategies you would like me to hyper optimize for you. I'm always willing to create profitable strategies!
P.S. You can always pyramid this strategy for more gains! I just don't add pyramiding when creating my strategies because I want to show you the true win/loss ratio based buying one time and one selling one time. I feel like when creating a strategy that includes pyramiding right off the bat falsifies the win rate. This is my way of being transparent with you all. Have fun trading!
