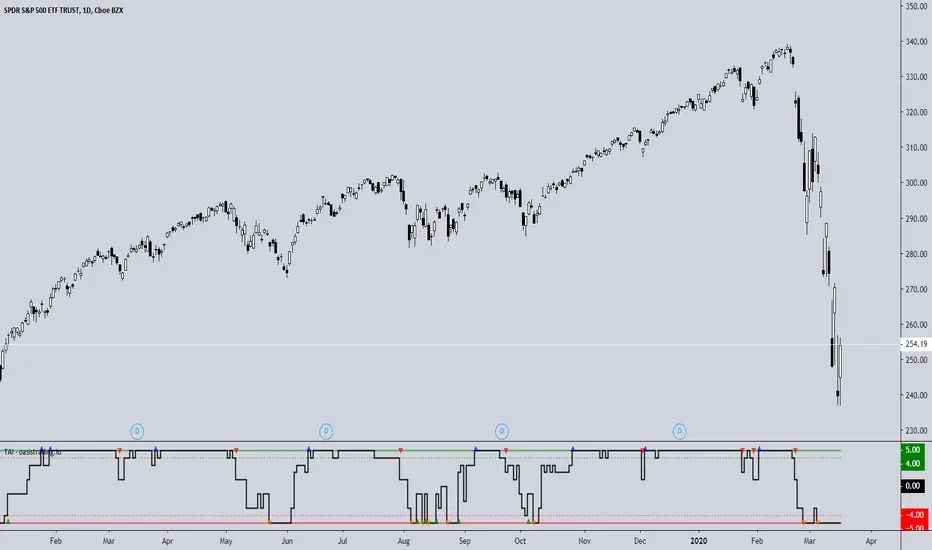
TAI - Trend Agreement IndexThe TAI is an experimental indicator we created to begin working on a automated trading algorithm. It takes five signals from our indicators and gives a +1 or -1 for each signal depending on if the signal is bullish or bearish.
This indicator should not be used for direct signals, but for confluence in trend. Long periods of flatness at 5 or -5 will indicate a very strong trend in that direction.
The TAI gives 4 different arrows depending on what the trend is doing.
Blue = Uptrend
Red = Uptrend Lost
Orange = Downtrend
Green = Downtrend Lost
This is a free add-on indicator for traders with access to the DBT MoMo and the Oasis Trading Suite and Bundle Package.
For Access or Questions: Private message us. Thank you.
Bitcoin (Mata Wang Kripto)
Yield Curve Inversion MonitorIdentifies when the US Treasury Yield Curve inverts (2 and 10 year bond rates).
When they ‘invert’ long-term bonds have a lower interest rate than short-term bonds. In other words, the bond market is pricing in a significant drop in future interest rates (which might be caused by the US Fed fighting off a recession in the future).
In the last 50 years, every time the US treasury yield curve inverted a recession followed within 3 years. On average the S&P500 gained 19.1% following the inversion and peaked 13 months later. In other words, as far as investors are concerned, the recession began roughly one year later.
However, once the market peaks, it then drops 37.6% on average, wiping out all those gains and more.
...Looks like 2020 is shaping up to be another prime example.

Wasabi Bitcoin Volatility (BitMEX BVOL Index)This is Wasabi Bitcoin Volatility (BitMEX BVOL Index) which simulates the way the BitMEX BVOL index is described.
The good thing about this indicator as compared to the original BitMEX BVOL is that this indicator shows the volatility data on or prior to 2017.
이 지표는 와사비의 비트코인 변동성 지수 입니다. 이 것은 비트맥스의 BVOL 인덱스 계산 방식으로 범용으로 다른 거래소에 적용하기 위해 만들었습니다.
이 지표가 비트맥스의 BVOL 보다 유용한 점은 2017년 이전 데이타도 표현된다는 것입니다.
보다 자세한 제작 과정은 아래 프로파일 문구의 장소에 있는 관련 영상을 찾아보시기 바랍니다.

Super AlgorithmIf you make a loss, I am not responsible for it. Please use this with caution that includes proper risk and money management.
When I see a sell signal, I may short &/or close my long.
When I see a buy signal, I may long &/or close my short.
The signal is most relevant for the exact time it comes on the chart. When the bar closes, it does not repaint.
The signal can show up and disappear on a running bar. It DOES NOT repaint once the bar is closed.
Do realize that on bar close, the price may have moved significantly, and the signal may not be relevant anymore. So, it needs to be used with caution whether one uses this as soon as a signal appears or on bar close. This is not suitable for the highly large timeframe (ake over 1day). I use it on 1 day and monthly on the lower timeframe.
My primary motivation for building this was three -
1) To ensure I am not addicted and not looking at the chart 24/7
2) To ensure I do not spend a lot of time & resources on multiple indicators
3) I have a consistent profit that can help me in my poor living expenses.
4) Recently, during the huge drawdown, I noticed that my other indicator () was unable to act as quickly as needed as the volatility happened in the lower timeframe. It made me realize that I need to do something to protect my capital in the future. Hence, the idea for this indicator.
5) I use this indicator alongside my other indicators that are showing the chart as well.
In the chart above, I am using
*
*
*
*
* And this indicator
You do not need to use all of these indicators. I have them always on my chart as I showed above.
The buy and sell shown with a blue background is the one coming from this indicator. The only thing that one can customize is colour.
This indicator differs significantly from my other indicators. This indicator prints less signal as careful work went in to reduce noise as much as possible and is to be used for 1 day or less tf.
I use it alongside other indicators for confirmation bias. The other indicators I use are the ones that come from me as well as shown on the chart.
This can possibly be used for other instruments. As I only use it for trading BTCUSD, I have crudely tested for BTCUSD after the dump and has been doing ok so far.
The code is written in Version 4 of pine script. If there are bugs, please let me know.
For info on gaining access see the ⬇ link below ⬇ in our signature field & direct message me. I have a busy schedule at my own workplace. Trading is my hobby. Hence, please be kind to me if I am late in replying

Cuban's BTCUSD Spot Buying GuideI have been using a few different spreads to track market sentiment for $BTCUSD over the last 12 months, and has worked out very favourably.
Although it's a low sample size, I feel as the market has become more efficient, these signals have become more accurate. Obviously, alpha decay will slowly arb these out but I thought I would share this rough guide.
There are many ways you can use these buy opportunities. I recommend buying after waiting for the candle to flip white (from green), this will be accompanied by the text, 'SPOT'. However, aggressive entries can be taken by slowly averaging in while the candle colouring is green.
I have left out any take profit strategy, as I will leave this to the user.
Enjoy!

Wasabi Fear & Greed Index (FGI)Wasabi Bitcoin Fear & Greed Index (FGI)
This is Wasabi's Bitcoin FGI(Fear & Greed Index) indicator.
This indicates the market sentiment as a sentiment ratio of traders' fear or greed gauge.
The extreme fear may signal people are excessively worried. Vice versa for the extreme exuberance, euphoria or greed
It's been known to be a good strategy to buy at the extreme fear and sell at the extreme greed
A strong extreme index is normally followed by a significant opposite reaction, ie strong collapse or recovery.
The indicator may be used to provide smart and brave traders with great opportunities.
이 지표는 와사비의 비트코인 '공포와 탐욕' 인덱스(Fear & Greed Index) 지표입니다.
과도한 공포는 사람들이 과도하게 걱정하고 있다는 것을 나타내는 것일 수 있습니다. 과도한 탐욕의 경우는 반대이구요.
공포에 사서, 환희나 탐욕에 파는 것은 좋은 전략으로 알려져 있습니다.
강한 지수이후에는 강한 반대방향의 반응(즉, 강한 폭락이나 회복)이 나옵니다.
그래서, 이 지표는 과도한 환희에 주의하라는 붉은색표시가 되어있고, 과도한 공포에 오히려 매수기회라는 녹색표시를 하고 있습니다.
이 지표는 현명하고 용감한 트레이들에게 놀라운 기회를 제공하는데 사용될 수 있습니다.
저의 모든 지표는 무료입니다. 사용 문의는 채팅창으로 받지 않습니다.
대신, 아래 제 '프로파일 문구'에 기재되어 있는 외부 장소로 오셔서 관련 영상 댓글로 신청하셔야 합니다.

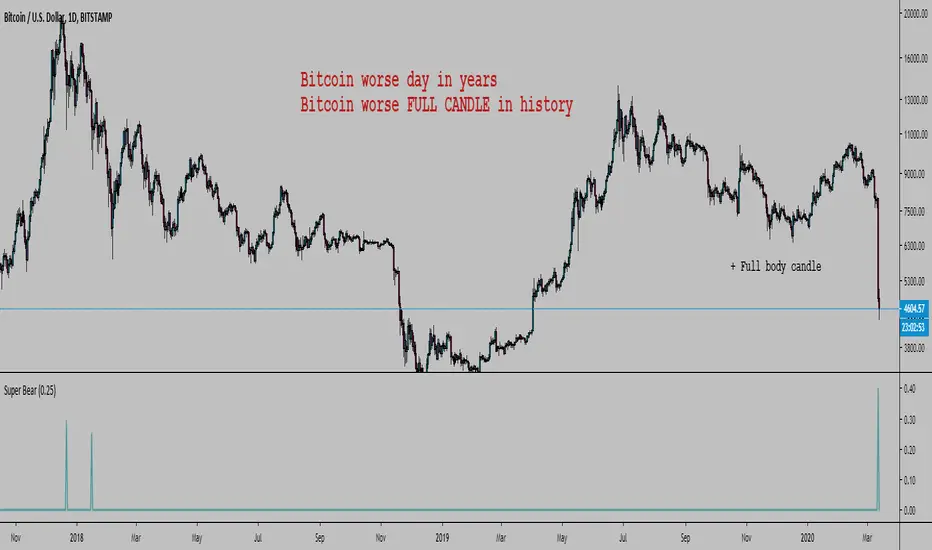
Bitcoin Worse DaysHello, here is a simple script to scan for BTC worse days.
In input you tell the script what are the minimum percent drops to look for.
By default it is 0.3, here I set it at 0.25 or it would not show anything except the 12 March (which is 40.07%).
The indicator has a precision of 1% I think.
It does not look at how low the body closed, it will show all days that closed below where they opened looking at how far below the high of the day the low was.
It can also work on any timeframe.
Here were the previous worse days from the late 2017 crash start of the bear market:
You could modify the script and look for the worse bodies with open - close instead of high - low
You could also add a filter to only look at days where the body is > 90% the whole candle (in this case it's got to be about 99%)
We can look back at BTC past a bit
Every bear market started with a large drop so we can expect...
As you can see we can look at the weekly chart too:
I won't lie, I am pretty happy. Russia, China bat eating community, and Greta were a big help. Thanks guys.

BitFlyerFX Kairi(%)This is an indicator that shows the ratio of spot price and "FX" price of bitFlyer, a Japanese cryptocurrency exchange.
"FXBTCJPY" is a special product and does not strictly work with spot price.
Because of the extremely "peculiar" price, it often deviates from the spot price.
This is an indicator to confirm it.
·Source
BITFLYER: BTCJPY
BITFLYER: FXBTCJPY
=================
bitFlyerの現物価格とFX価格の乖離率を見るやつ。とりあえず見れればいい人向け

Cracking Cryptocurrency - Bottom FeederThe Bottom Feeder
The Bottom Feeder is designed to algorithmically detect significantly oversold conditions in price that represent profitable buying opportunities. Combining this with it’s unique Stop and Target System, the Bottom Feeder is designed to return consistent return with minimal draw down. Whether used as a Market Bottom Detector or as a system for executing safe, profitable mean reversion trades, the Bottom Feeder is a powerful tool in any trader’s arsenal.
Bottom Feeder was designed to be used on BTCUSD , however it is also effective on other USD/USDT pairs. One will have to check the individual pair they wish to trade with the Strategy Tester to simulate performance.
Options
Let’s go through the input options one by one, so that you are able to comfortably navigate all that this indicator has to offer. The link below will display a picture of the layout of the settings for your convenience.
For the sake of simplicity, let’s note now that all settings marked **Conservative Mode** will not work in Aggressive Mode.
Mode: Determines how aggressively Bottom Feeder generates a buy signal. In Conservative Mode, trades can only be opened once per candle and the stop and target will update as new signals appear. In Aggressive Mode, a separate trade is opened each time Bottom Feeder signals, which may be multiple times within one Daily candle.
Plot Target and Stop Loss: Toggles on/off the visualized take profit and stop losses on the chart.
**Conservative Mode** TP Multiplier: This is an input box, it requires a float value. That is, it can accept either a whole number integer or a number with a decimal. This number will determine your Take Profit target. It will take whatever number is entered into this box and multiply the Average True Range against it to determine your Take Profit.
**Conservative Mode** SL Multiplier: See above - this will modify your Stop Loss Value.
**Conservative Mode** Average or Median True Range: This is a drop-down option, the two options are Average True Range or Median True Range. If Average True Range is selected, then this indicator will use the Average True Range calculation, that is, the average of a historical set of True Range values to determine the Average True Range value for Target and Stop Loss calculation. If Median True Range is selected, it will not take an average and will instead take the Median value of your historical look back period.
**Conservative Mode** True Range Length: This is an input that requires an integer. This will represent your historical look back period for Average/Median True Range calculation.
**Conservative Mode** True Range Smoothing: This is a drop-down with the following options: Exponential Moving Average ( EMA ), Simple Moving Average ( SMA ), Weighted Moving Average ( WMA ), Relative Moving Average (RMA). This will determine the smoothing type for calculating the Average True Range if it is selected. Note: if Median True Range is selected above, this option will not have any effect as there is no smoothing for a Median value.
**Conservative Mode** Custom True Range Value?: This is a true/false option that is false by default. If enabled, it will override the Average/Median True Range calculation in favor of a users custom True Range value to be input below.
**Conservative Mode** Custom True Range Value: This is an input box that requires a float value. If Custom True Range is enabled this is where a user will input their desired custom True Range value for Target and Stop Loss calculation.
Stop and Target Description
Because Bottom Feeder is designed only to scalp the various market bottoms that can appear over time in the market and not to identify trends or to trade ranges, it’s imperative that the indicator notify us not just to when to enter our trades, but when to exit! In the service of that, CC Bottom Feeder has a built in Stop and Target system that tracks and displays the stop loss and take profit levels of each individual open trade, whether in Aggressive or Conservative Mode.
Conservative Mode Targeting: In Conservative Mode, Bottom Feeder signals are aggregated into a compound trade. The signal will appear as a green label pointing up below a candle, and will appear upon a candle close. If Bottom Feeder then generates another signal the stop loss and target price will be updated. The process will continue until the aggregated trade completes in either direction. On a trade with multiple signals, a larger position is slowly entered into upon each buy signal.
Aggressive Mode Targeting: In Aggressive Mode, Bottom Feeder signals are individually displayed as they are generated, regardless of how many signals are generated on any single candle. If Bottom Feeder continues to signal, each individual open trade will have their own stop loss and target that will be displayed on the chart until the individual trade completes in either direction. As opposed to a large compound position, aggressive mode represents a higher number of independent signals with their own stop and target levels.
Stop losses and targets are designed to be hard, not soft. That is, they are intended to be stop market orders, not mental stop losses. If price wicks through the target or stop, it will activate.

Cracking Cryptocurrency - Bottom Feeder Strategy TesterBottom Feeder - Strategy Tester
The Bottom Feeder is designed to algorithmically detect significantly oversold conditions in price that represent profitable buying opportunities. Combining this with it’s unique Stop and Target System, the Bottom Feeder is designed to return consistent return with minimal draw down. Whether used as a Market Bottom Detector or as a system for executing safe, profitable mean reversion trades, the Bottom Feeder is a powerful tool in any trader’s arsenal.
Bottom Feeder was designed to be used on BTCUSD, however it is also effective on other USD/USDT pairs. One will have to check the individual pair they wish to trade with the Strategy Tester to simulate performance.
Strategy displayed is from 2018-2021 on **Conservative Mode** with Percent of Equity (30%) enabled.
Options
Let’s go through the input options one by one, so that you are able to comfortably navigate all that this indicator has to offer. The link below will display a picture of the layout of the settings for your convenience.
For the sake of simplicity, let’s note now that all settings marked **Conservative Mode** will not work in Aggressive Mode.
Mode : Determines how aggressively Bottom Feeder generates a buy signal. In Conservative Mode, trades can only be opened once per candle and the stop and target will update as new signals appear. In Aggressive Mode, a separate trade is opened each time Bottom Feeder signals, which may be multiple times within one Daily candle.
Position Sizing Strategy : Determines what Risk Management system you will deploy when trading Bottom Feeder. Your options are “Percent of Equity” and “Distance to Stop Loss”. If Percent of Equity is selected, a trade size will be equal to a percentage of your equity, pursuant to the value in the ‘Percent of Equity’ box. If Distance to Stop Loss is selected, then your Position Size will be determined based off the distance to your stop loss and the value in the ‘Risk Percentage’ box.
Percent Of Equity : Determines what percentage of your equity will be allocated to each trade when ‘Position Sizing Strategy’ is enabled.
Risk Percentage : Determines the size of each trade if ‘Distance to Stop Loss’ strategy is enabled. This value reflects what percent of your account you will lose per trade if the trade hits your stop loss.
Plot Target and Stop Loss : Toggles on/off the visualized take profit and stop losses on the chart.
**Conservative Mode** TP Multiplier : This is an input box, it requires a float value. That is, it can accept either a whole number integer or a number with a decimal. This number will determine your Take Profit target. It will take whatever number is entered into this box and multiply the Average True Range against it to determine your Take Profit.
**Conservative Mode** SL Multiplier : See above - this will modify your Stop Loss Value.
**Conservative Mode** Average or Median True Range : This is a drop-down option, the two options are Average True Range or Median True Range. If Average True Range is selected, then this indicator will use the Average True Range calculation, that is, the average of a historical set of True Range values to determine the Average True Range value for Target and Stop Loss calculation. If Median True Range is selected, it will not take an average and will instead take the Median value of your historical look back period.
**Conservative Mode** True Range Length : This is an input that requires an integer. This will represent your historical lookback period for Average/Median True Range calculation.
**Conservative Mode** True Range Smoothing : This is a drop-down with the following options: Exponential Moving Average ( EMA ), Simple Moving Average ( SMA ), Weighted Moving Average ( WMA ), Relative Moving Average (RMA). This will determine the smoothing type for calculating the Average True Range if it is selected. Note: if Median True Range is selected above, this option will not have any effect as there is no smoothing for a Median value.
**Conservative Mode** Custom True Range Value? : This is a true/false option that is false by default. If enabled, it will override the Average/Median True Range calculation in favor of a users custom True Range value to be input below.
**Conservative Mode** Custom True Range Value : This is an input box that requires a float value. If Custom True Range is enabled this is where a user will input their desired custom True Range value for Target and Stop Loss calculation.
From Month/Day/Year to Month/Day/Year : This sets the Time Frame of your backtest for the Bottom Feeder Strategy. It will run FROM the date selected TO the date selected.
Stop and Target Description
Because Bottom Feeder is designed only to scalp the various market bottoms that can appear over time in the market and not to identify trends or to trade ranges, it’s imperative that the indicator notify us not just to when to enter our trades, but when to exit! In the service of that, CC Bottom Feeder has a built in Stop and Target system that tracks and displays the stop loss and take profit levels of each individual open trade, whether in Aggressive or Conservative Mode.
Conservative Mode Targeting: In Conservative Mode, Bottom Feeder signals are aggregated into a compound trade. The signal will appear as a green label pointing up below a candle, and will appear upon a candle close. If Bottom Feeder then generates another signal the stop loss and target price will be updated. The process will continue until the aggregated trade completes in either direction. On a trade with multiple signals, a larger position is slowly entered into upon each buy signal.
Aggressive Mode Targeting: In Aggressive Mode, Bottom Feeder signals are individually displayed as they are generated, regardless of how many signals are generated on any single candle. If Bottom Feeder continues to signal, each individual open trade will have their own stop loss and target that will be displayed on the chart until the individual trade completes in either direction. As opposed to a large compound position, aggressive mode represents a higher number of independent signals with their own stop and target levels.
Stop losses and targets are designed to be hard, not soft. That is, they are intended to be stop market orders, not mental stop losses. If price wicks through the target or stop, it will activate.

Gordon-RMATRENDTrend Indicator displaying signals for SHORT/LONG. Good results for Low Timeframe (1H) Crypto/FIAT pairs.
Use of CHOP, RMA & Volume indicators.
Have had success using it on XBT/USD & BTC/USD Pairs.

Any Security vs. Any Security Change Comparison [BigBitsIO]This script allows you to compare the percentage-based change in the price of any two securities on any given (and supported) timeframe on the chart. This can give you a very simple way to compare any two securities against one another.
Ex: If your base security gained 5%, and the other security gained 3% in a single day, the change comparison would show a green bar of 2% because your base security outgained your other security by 2%.
Features:
- 2 securities to compare. A base and other.
- Shortlist of default securities to choose from.
- Ability to override the default securities list and use any security supported by TradingView. You must use the correct security string to do so.
- Resolution is tied to whatever the current chart is using. This way the view of the indicator always reflects the correct resolution of the chart.
- If either market has a 0% change, it is considered likely closed during that period and will result in a change of 0%, as they shouldn't be compared at that time.

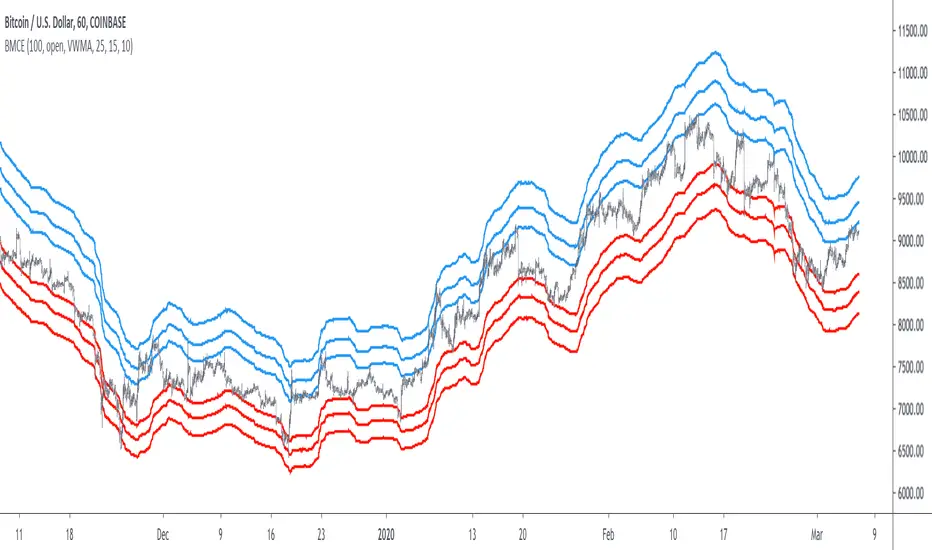
Bitcoin Margin Call Envelopes [saraphig & alexgrover]Bitcoin is the most well known digital currency, and allow two parties to make a transaction without the need of a central entity, this is why cryptocurrencies are said to be decentralized, there is no central unit in the transaction network, this can be achieved thanks to cryptography. Bitcoin is also the most traded cryptocurrency and has the largest market capitalization, this make it one of the most liquid cryptocurrency.
There has been tons of academic research studying the profitability of Bitcoin as well as its role as a safe heaven asset, with all giving mixed conclusions, some says that Bitcoin is to risky to be considered as an hedging instrument while others highlight similarities between Bitcoin and gold thus showing evidence on the usefulness of Bitcoin acting as an hedging instrument. Yet Bitcoin seems to attract more short term speculative investors rather than other ones that would use Bitcoin as an hedging instrument.
Once introduced, cryptocurrencies where of course heavily analyzed by technical analyst, and technical indicators where used by retail as well as institutional investors in order to forecast the future trends of bitcoin. I never really liked the idea of designing indicators that specifically worked for only one type of market and ever less on only one symbol. Yet the user @saraphig posted in Feb 20 an indicator called " Margin Call MovingAverage " who calculate liquidation price by using a volume weighted moving average. It took my attention and we decided to work together on a relatively more complete version that would include resistances levels.
I believe the proposed indicator might result useful to some users, the code also show a way to restrict the use of an indicator to only one symbol (line 9 to 16).
The Indicator
The indicator only work on BTCUSD, if you use another symbol you should see the following message:
The indicator plot 6 extremities, with 3 upper (resistance) extremities and 3 lower (support) extremities, each one based on the isolated margin mode liquidation price formula:
UPlp = MA/Leverage × (Leverage+1-(Leverage*0.005))
for upper extremities and:
DNlp = MA × Leverage/(Leverage+1-(Leverage*0.005))
for lower extremities.
Length control the period of the moving averages, with higher values of length increasing the probability of the price crossing an extremity. The Leverage's settings control how far away their associated extremities are from the price, with lower values of Leverage making the extremity farther away from the price, Leverage 3 control Up3 and Dn3, Leverage 2 control Up2 and Dn2, Leverage 1 control Up1 and Dn1, @saraphig recommend values for Leverage of either : 25, 20, 15, 10 ,5.
You can select 3 different types of moving average, the default moving average is the volume weighted moving average (VWMA), you can also choose a simple moving average (SMA) and the Kaufman adaptive moving average (KAMA).
Based on my understanding (which could be wrong) the original indicator aim to highlight points where margin calls might have occurred, hence the name of the indicator.
If you want a more "DSP" like description then i would say that each extremity represent a low-pass filter with a passband greater than 1 for upper extremities and lower than 1 for lower extremities, unlike bands indicators made by adding/subtracting a volatility indicator from another moving average this allow to conserve the original shape of the moving average, the downside of it being the inability to show properly on different scales.
here length = 200, on a 1h tf, each extremities are able to detect short-terms tops and bottoms. The extremity become wider when using lower time-frames.
You would then need to increase the Leverages settings, i recommend a time frame of 1h.
Conclusion
I'am not comfortable enough to make a conclusion, as i don't know the indicator that well, however i liked the original indicator posted by @saraphig and was curious about the idea behind it, studying the effect of margin calls on market liquidity as well as making indicators based on it might result a source of inspiration for other traders.
A big thanks to @saraphig who shared a lot of information about the original indicator and allowed me to post this one. I don't exclude working with him/her in the future, i invite you to follow him/her:
www.tradingview.com
Thx for reading and have a nice weekend! :3
Bitcoin Futures SentimentMonitors the sentiment across Bitcoin Futures, large discrepancies indicate potential low risk (buy/green) and high risk (sell/red) zones.

Bitcoin CME Gaps [NeoButane]Simple script that checks for gaps in price from CME. tickerid(x, y, sess) doesn't seem to be applying correctly for the ticker specified at the moment so there are a couple of 'gaps' peppered on lower timeframes.
Gaps are legitimate price levels to look as a support or resistance. The theory is that volume needs to be gap filled, but I currently believe it's an easy entry/exit trade for those who can move the market. I don't think there is sound analysis behind the why, but it is real.

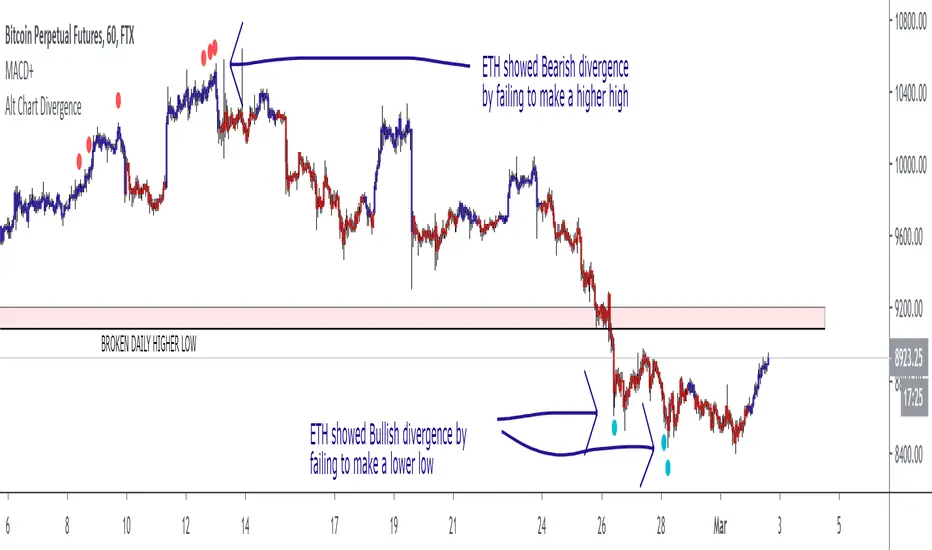
Alt Chart DivergenceThis script is designed to allow you to view bullish or bearish divergences between Bitcoin and ETH or an other alt of choice. However, you could also apply the idea in reverse or use it to look at chart comparisons such as DJI vs SPX or XAU vs XAG or UKOIL vs USOIL. Any alternate ticker can be used to plot divergences on the primary ticker treating the alternate chart as an indicator.
The design is very simple, just showing a dot for each case of bullish or bearish divergence.
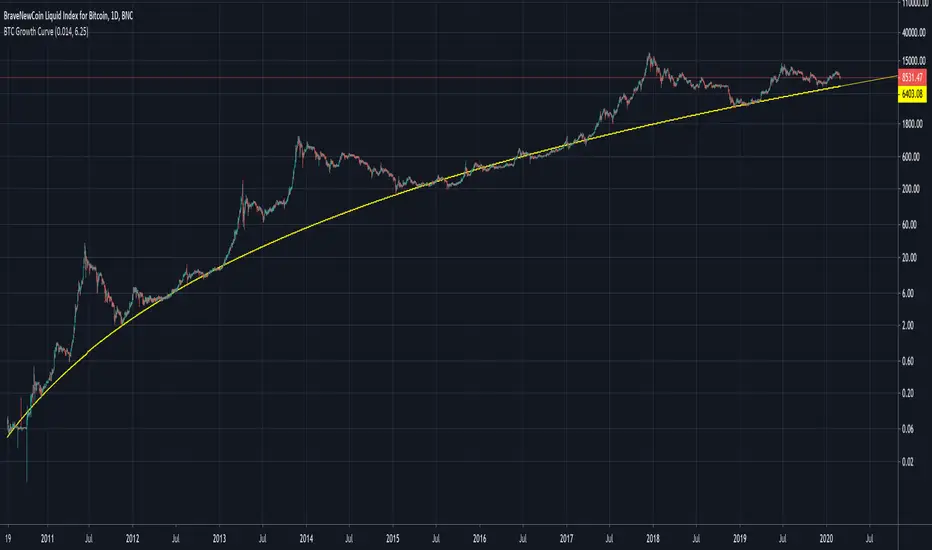
BTC Growth CurveA function which maps Bitcoin supply fundamentals to an estimated demand growth model via price.
Bitcoin Cycle Top IndicatorBitcoin Cycle Top Indicator on the 1W Bitcoin Logarithmic chart.
Called all 3 tops so far to a T, this indicator will be great use for the next upcoming cycle.
I kept it sweet and simple, no need to overcomplicate. That's all this indicator does.

Easy Loot Trailing Stop Bot - (PSAR) StrategyHello World,
Today I am bringing you a Parabolic Stop and Reverse Strategy that uses a 5% trailing stop loss.
Tested the strategy on the 1D timeframe of Bitcoin from the time period starting from 2018 onwards.
As you may know the price in the start of 2018 for Bitcoin was around $11,000 meaning if you bought and HODL'd since then you'd be down a good %, as current price is $8650.
Below is the strategy testing results, up 844% profits in the last two years.
Easy Loot Members Only, contact me if you'd like access to the strategy.
Parabolic Stop and Reverse (PSAR) Strategy
Parabolic SAR is a time and price technical analysis tool primarily used to identify points of potential stops and reverses. In fact, the SAR in Parabolic SAR stands for "Stop and Reverse". The indicator's calculations create a parabola which is located below price during a Bullish Trend and above Price during a Bearish Trend.
Trailing Stop Loss
A trailing stop-loss order is a special type of trade order where the stop-loss price is not set at a single, absolute dollar amount, but instead is set at a certain percentage or a certain dollar amount below the market price.

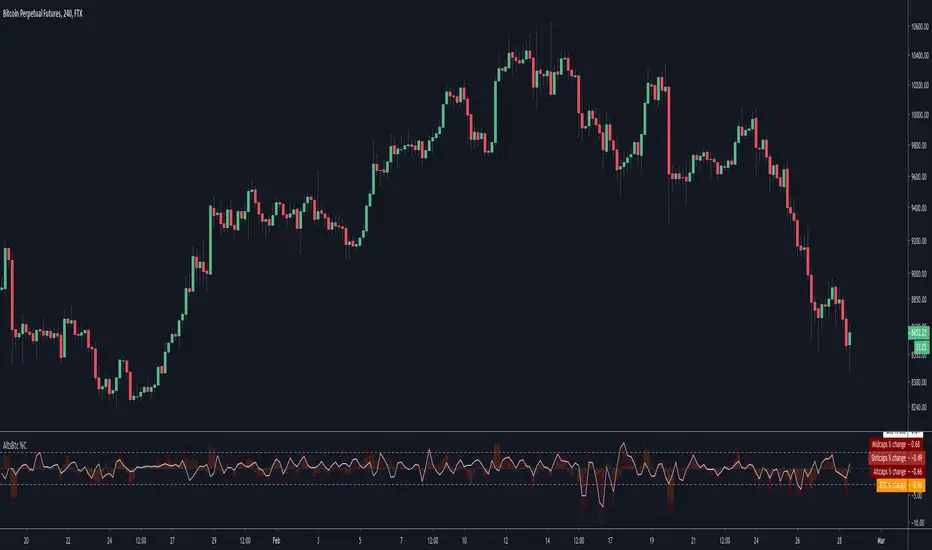
Alts vs Btc percentage changesCatch differences and over-corrections between Alts and Bitcoin via Ftx's indexes
A more visual description : i.imgur.com
Derivatives PremiumThis script calculates the difference between spot and derivatives price to see whether spot or derivatives are leading the move. The script contains the ability to segment by region to see if there is a geographic bias to the activity as well.

Larsson AcademyThe L.A. Indicator supports:
- Trend trading (not range trading) of
- Tech assets, such as tech stocks and bitcoin/cryptocurrencies (not commodities) over
- Long timeframes, e.g. daily, weekly and monthly candles (not hourly candles or less).
By distilling all data down to one of 3 states, up, down or inconclusive, the indicator can aid in the decision making over long time periods, together with a rule based trading process. It works by measuring trend consistency.
