Komoditi

15 Minute Gold Trend-Following StrategyThis is the main strategy that I will be forward testing on demo for a month or two, then making it an EA in MetaTrader4
You can see the code for yourself this time, all the strategy is, is a crossover of various moving averages.
Commission included, $10,000 account.
Results over the past 3 months, beginning in January 2017.

Gold/Silver 30m Only Strategy Buy/Sell SignalsIn my free time I felt like coding this strategy, and after backtesting it, it appears that the 30m time frame is the most profitable.
I only have been working on it for gold, but it should work similarly for silver as well.
This includes no pyramiding, and with pyramiding orders of 5, this strategy is upwards of 100% profitable.
Buy order - when price is above the 162 day EMA and RSI is less than 35
Sell order - when price is below the 162 day EMA and RSI is greater than 65
I will probably be adjusting it to increase the profitability and %success rate.

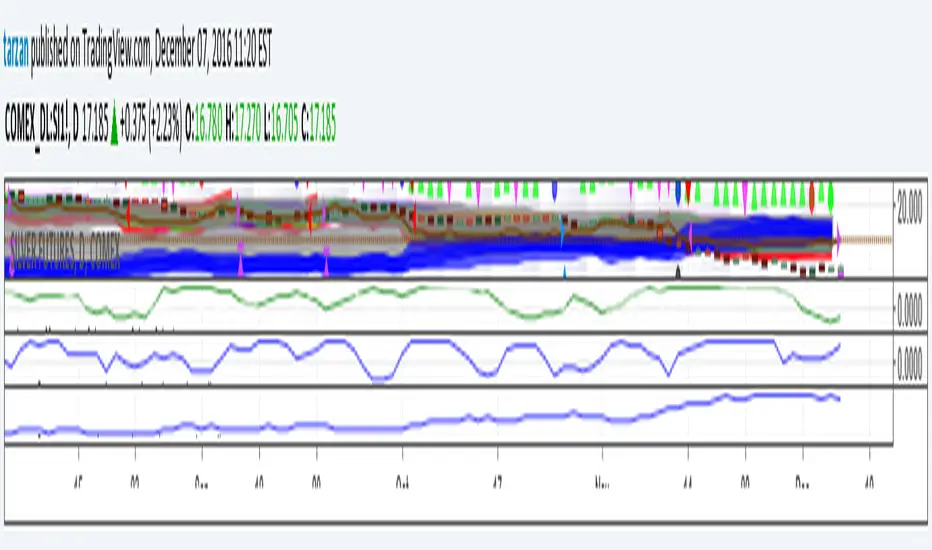
Tarzan's spread ratio indicator - DeLuxeThis indicator plots any two securities as a spread ratio using either +,-,/, or *.
It also allows you to use a simple moving average of length 1 to n for your spread ratio.
If you know what you want to do but don't know how to code it, we can work it out, you can float me some cheese on paypal and I'll do a nice job. This indicator is yours for free.
Tarzan = noprism@hushmail.com
Peace
USO - Adam Smith - Moving Average Cross StrategySimple Moving Average strategy for USO - United States Oil Fund . This strategy can be used on stocks and currencies but will need to tweak frequency on chart and backtest Max Draw Down to Net Profit ratios for maximum dollar gains.

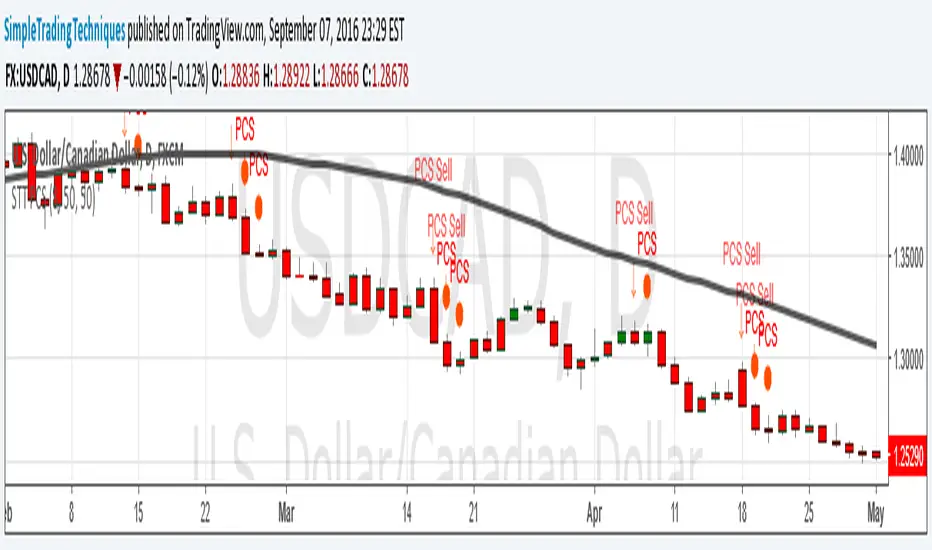
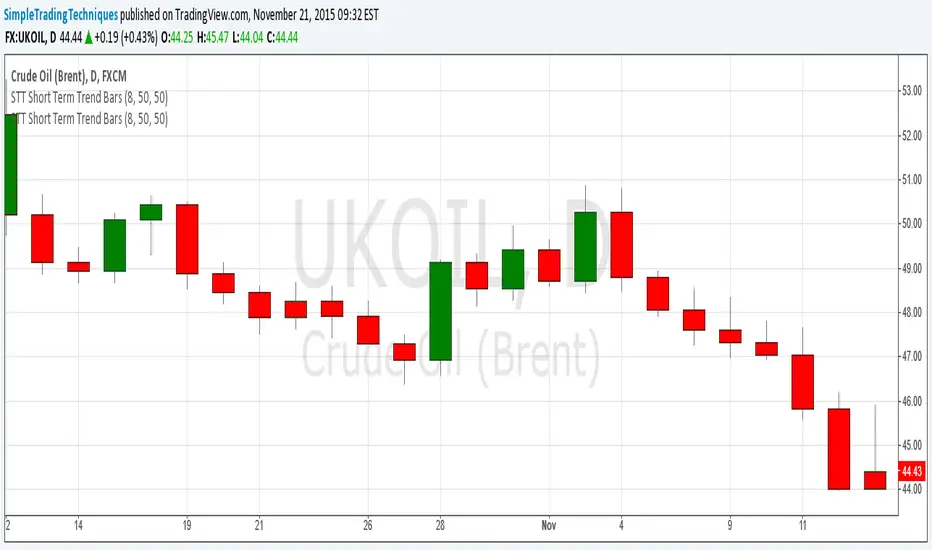
ENGULFING CANDLESTICK STRATEGY(i) Arrow represent trade setup
(ii) Circle represent triggering of the trade
--------------------------------------------------------------------
1. Where to place stop loss?
2. Where to exit the trade?
3. How to protect gains in your trade?
4. How to apply money management rule?
5. How to trade gap opening?
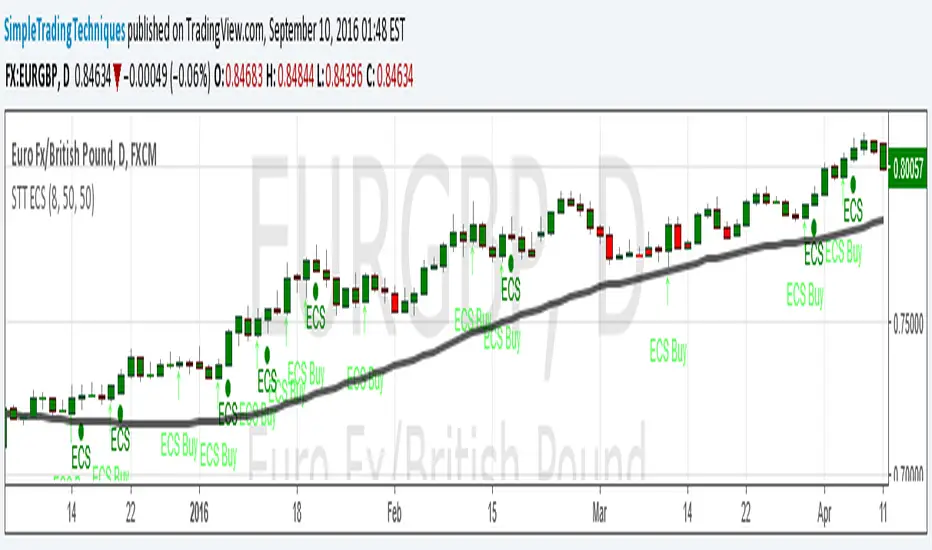
PULLBACK CANDLESTICK STRATEGY BY SIMPLE TRADING TECHNIQUESArrow represent trade setup
Circle represent triggering of the trade
--------------------------------------------------------------------
1. Where to place stop loss?
2. Where to exit the trade?
3. How to protect gains in your trade?
4. How to apply money management rule?
5. How to trade gap opening?
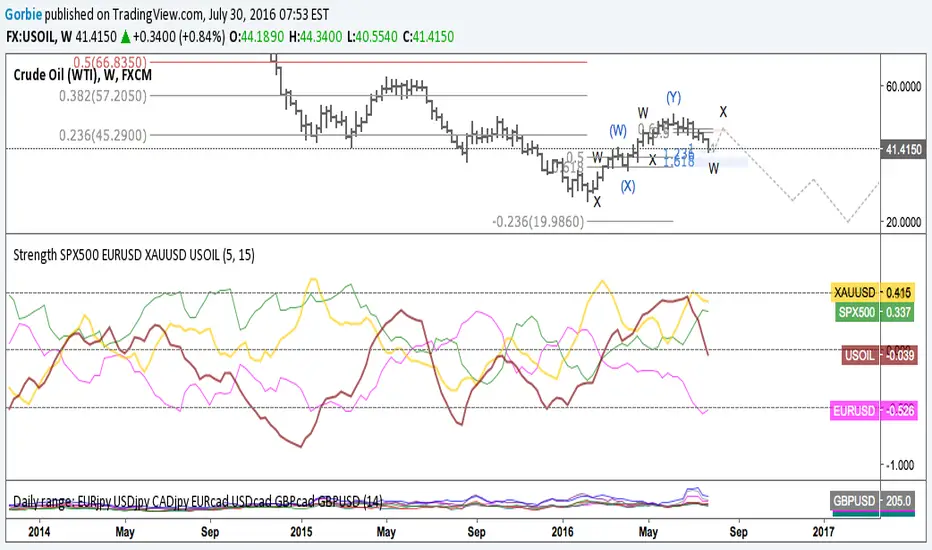
Strength SPX500 EURUSD XAUUSD USOILStrength of SPX500, EURUSD, XAUUSD and US OIL.
Buy or sell on extreme of strength into the overbought or the oversell.
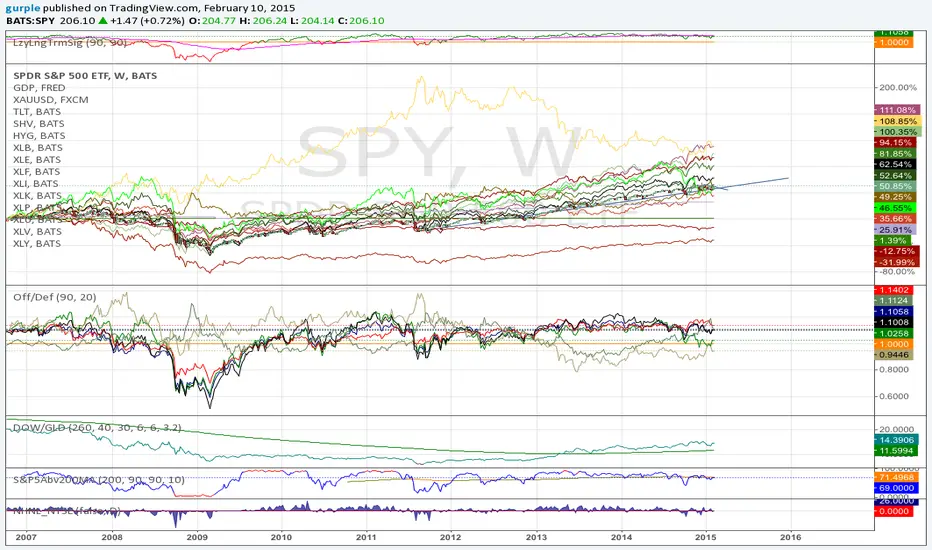
Correlation of chart symbol to different Index-ETF-currencyScript plots correlation of chart symbol to a variety of indexes, symbols, equities. ** Original idea was to find Bitcoin correlation, which I did not. Built in correlations are: Nikie, DAX, SPY, AAPL, US Dollar, Gold, EURUSD, USDCNY, EEM, QQQ, XLK, XLF, USDJPY, EURGBP

GoldFinger .007Goldfinger.
He's the man, the man with the midas touch.
A spider's touch.
Such a cold finger.
Beckons you to enter his web of sin
But don't go in.

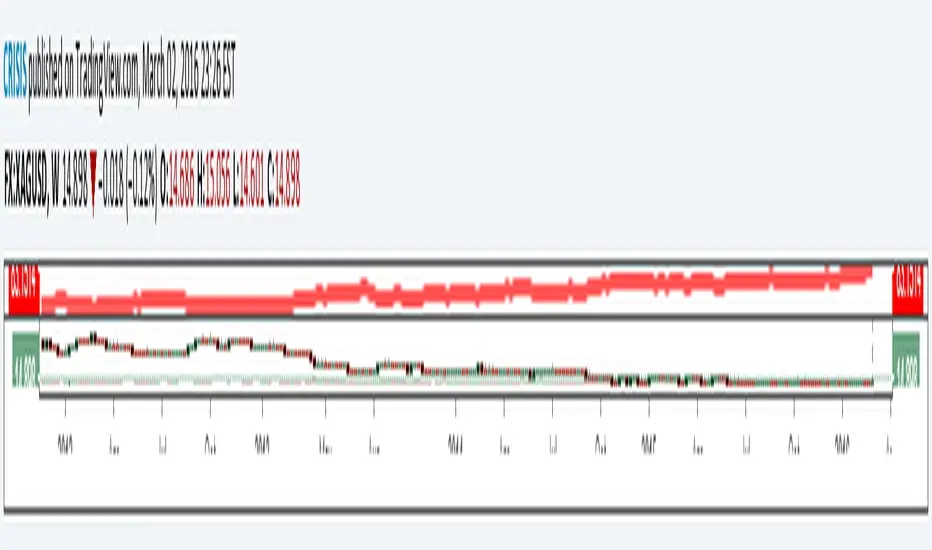
[RS]Gold to Custom Currency V0Request for: sankar2389
Gold conversion from dollar to INR and to grams.
[RS]Khizon (DWTI) Strategy V0Request for Khizon01:
corrected a issue with the default stoch rsi settings (14 smoothing when it should be 3), can always change back since the 14 settings were better performing at the current chart.
added option to just open buy trades or sell trades separately and close were previously swing trade occur.
added plot titles.


4H CCI Strategy 1.3Still working on fixing the code 100%.
Will update with a new version soon.
This one's fine tuned for gold (tp and sl size, and contract size for a 100k account)
Cheers,
Ivan Labrie
Time at Mode FX


Binary option trading by two previous barsThis simple script uses the idea of inertia of the market. if 2 previous candles have the same color, current meant to have that too. Following this signal is equal to buying a binary option on the start of the bar (week here). Signals are shown as arrows on the series. The color of the bar shows the outcome of the current option: yellow is success, black is failure. The same outcomes are at the bottom of the chart. The blue line is the total revenue of all options so far. Can be used as template for strategy simulation.

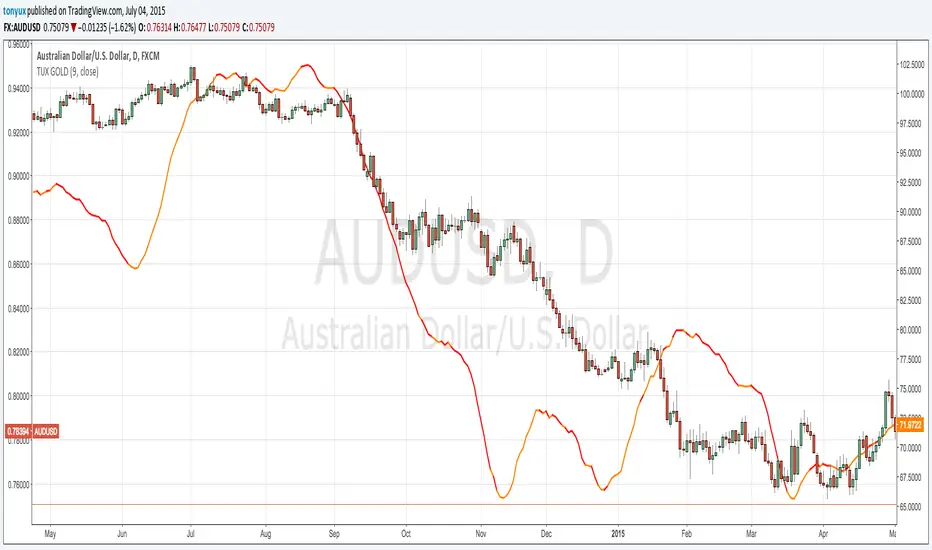
Gold Price Trend Overlay This chart overlay provides the daily 9 SMA of Gold.
If the price of GOLD is ABOVE the 9 SMA then the line will be GOLD
If the price of GOLD is BELOW the 9 SMA then the line will be RED
A good way to use this overlay is by understanding how Gold effects currency pairs.
if GOLD is BULLISH - then AUD/USD is BULLISH
if GOLD is BULLISH - then NZD/USD is BULLISH
if GOLD is BULLISH - then EUR/USD is BULLISH
if GOLD is BULLISH - then USD is bearish
if GOLD is BULLISH - then USD/CHF is BEARISH
if GOLD is BULLISH - then USD/CAD is BEARISH
Patrick's Buy HistogramSet up a trailing stop at about 0. Look for the red dots.and that's a good point to enter a long trade.

DOW / GOLD RatioHere's a new version with color goodness and using CL1! as the gold spot source (longer history).
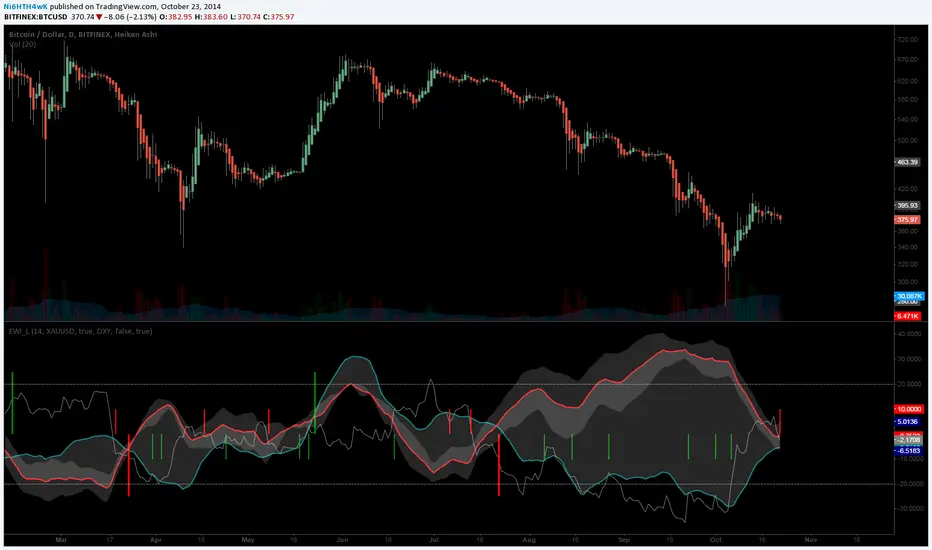
[LAVA] Early Warning IndicatorCombined the RSI inverse of gold to USD with the Dollar index (or whatever stock symbol that may be inverted/complementary) with another asset/currency, like bitcoin, you can basically be well informed when a potential move is on the horizon. Settings allow for inverse settings and de-combining the two pairs as well as a nice cloud look if all the lines get annoying.