Futures

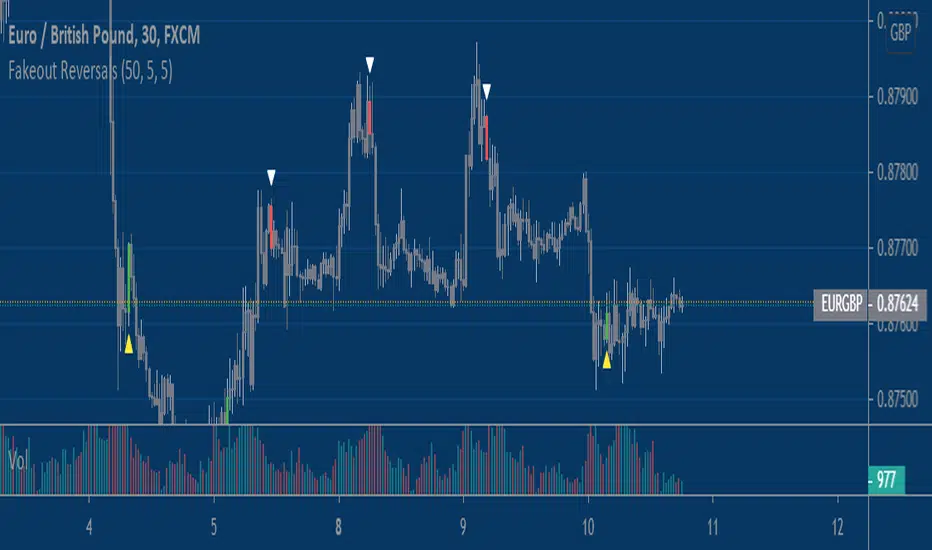
Fake-out ReversalsThis script combines two simple concepts, stop running and short term momentum, into a simple visual signal that can be applied to any market and any timeframe with some adjustment. It looks for price to violate a prior extreme within a certain lookback window, followed by price triggering a momentum filter that helps put the proverbial 'wind at your back' for the user. Users have the ability to customize three inputs; 1) Bars used to calculate price extremes 2)Bars since price violated that extreme 3)The sensitivity of the momentum filter.
You will find that these signals work best in choppy and rangebound price action, less so in trending/grinding markets. For entertainment/educational purposes only.
Enjoy!
Ehler Fisher applied on distance EMAThis is an improved version of Fisher, which use as a source the distance from EMA , compared to the initial source which was on the close of a candle.
It can be used in any market, any time frame .
For conditions we have multiple conditions for the logic, in this case initially if our fisher is above 0 is a long direction ,if its belowe 0 its a short direction.
Also we can improve this condition even further, in this case if we cross up our previous line its a buy signal, and if we cross down its a sell signal.
For best usage combine the cross together with the position of fisher respecting the 0.
If you have any other questions, let me know with a private message.

© 2021 - SwingSwiss - BUY/SELL© 2021 - Dan Chetrit - BUY/SELL"
Product Description:
The Indicator combines the Relative Strength Index, Moving Average Convergence Divergence as well as Volume and Stochastic.
The idea is to cross multiple data and signals from these indicators in order to trigger buy when crossing above and sell when crossing below the signal line.
The idea was also to find a mathematical function that will trade the convergence of these lines trying to predict the market.
This indicator works better on a daily chart.
The indicator works long and short but is better for long positions.
The script also includes an EMA 50 line as well as an overbought/oversold RSI background.
The indicator can be used on every type of market: indices, stocks, cryptocurrencies, currencies, and others but, according to backtesting, it works better for the US stock market.
This study is not a guaranteed profit. You should backtest or trade virtual money before using this study on your real portfolio, as it is intended to be a tool. Do your research and learn about the company you are investing in.
Disclaimer:
Trading and investing in the financial markets involves substantial risk of loss and is not suitable for every investor.
All trading strategies are used at your own risk.
Please send me a private message or comment on TradingView to gain access to the script.

Heikin-Ashi Change Strategy/ Indicator
Today I bring you a simple and efficient indicator/strategy based only on HA.
Can be used together with other TA tools or alone.
The idea behind is simple :
We have to forms to calculate the candle, using inner HA candles or normal candles. Once we have that we apply certain rules to get the max high, min low, open and close(ohlc)
With that then we check for changing in the patters like for example
For long close is higher than open and the previos close is lower than open. For short is going to be the opposite of long condition.
For the purpose of this example, I only use long direction and exit once we have the short signal.
If you have any questions, please let me know in private chat !

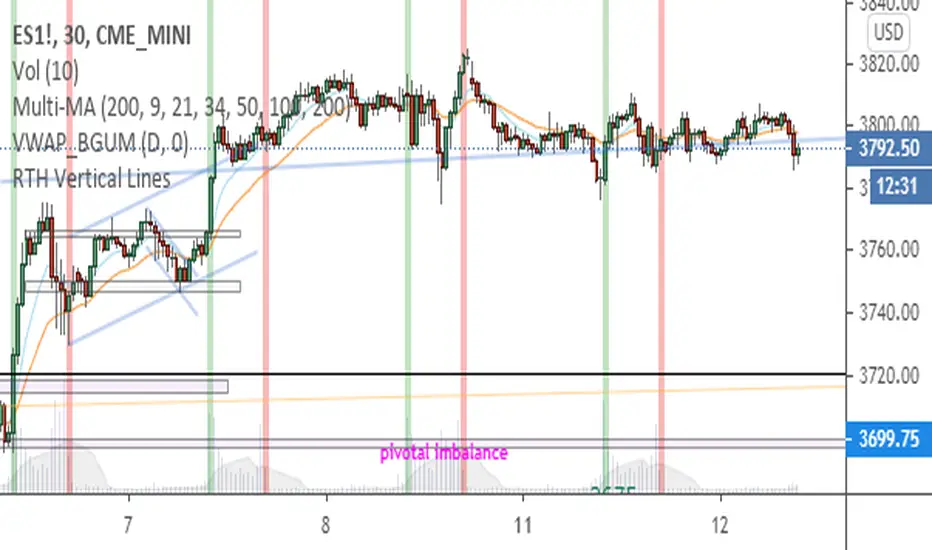
Real Trading Hours - Vertical Lines - Mark RTH for Futures 12/Jan/2021 09:15 AM AUTHOR: Brandon Gum
--
Updated script to plot vertical lines for open and close of futures.
Not sure why the 8:30 and 15:00 times had to be used over 9:30 or 16:00
Only plots for products of type futures. - Could be easily expanded to work with cryptos as well if you wanted.
======================
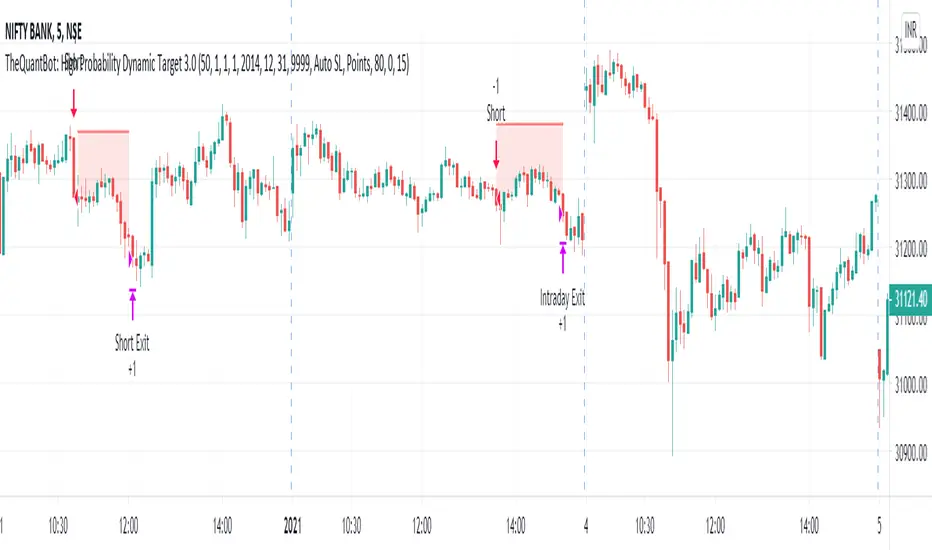
TheQuantBot: High Probability Dynamic Target 3.0This is the first indicator of TheQuantBot series. This is purely for educational purpose and this indicator might get modified in future as well. This is for intraday purpose and works on BANKNIFTY.
Trading Logic behind this indicator:
It it based on price action and considers support and resistance for entry and exit points.
If the support is broken then it enters long whereas if the resistance is broken it enters short.
The long and short entries are filtered by two other technical indicators like EMAs.
It will not take a trade if the market is highly volatile.
In input parameters you can set your risk taking ability based on which it sets the risk: reward ratio.
The default quantity entered in this indicator is 1 with initial capital set to 100000.
If you consider Indian discount brokers, you can buy 50 quantity at the same price, you can increase the quantity to check results with different scenarios.
In input parameters there are three options to set Stop Loss, you can set Auto SL , Manual SL with and without Trailing option, you can set Stop Loss both in points as well as percentage .
The profit target are dynamic in nature and it depends on the market volatility.
You can play around the back test start and end date to see its historical performance over different span of time.
This results are based on back tested data, in real scenario many other factors might differ the results.
*********************************************PM us to obtain access******************************************************************************************************************************************
MavilimW Strategy MTF EMA with HA CandlesThis is a strategy adapted initially for Mavilim moving average indicator, based on WMA MA.
It seems to works amazingly on long term markets, like stocks, some futures, some comodities and so on.
In this strategy, I form initially the candle, using EMA values, so I take the EMA of last 50 closes, open, highs and lows and form the candle
After this I take interally HA and convert the EMA candle to HA.
Then using the moving averages on multiple timeframes, like in this example we have a chart on 4h, but I use 1h and 1d moving averages.
For long condition we have : close is above moving average timeframe1 and oving average timeframe2 and oving average timeframe3
Initially short would be close below ma timeframe1, ma timeframe2 and timeframe3 -> but here I also convert it into a long signal.
So we actually go only long .
And we have 2 different exits : for first long if we have a crossdown of 1h ma with 1 day ma, and for second long if we have a cross up of 1h ma with 1 day ma in this example.
Message me if you have any questions about this strategy.

Heiken Ashi MTF Strategy- IndicatorHello, this is both a strategy and indicator that revolves around Heikin Ashi candles.
In this case we take 3 different time frames, in this example we use daily , weekly and monthly.
The conditions for entry are :
For long : we check that we have a green daily candle, at the same time we check that the weekly and monthly candles are also green.
For short : We check that all candles, daily, weekly and monthly and red.
For exit of long : as soon as 1 of the 3 candles, daily or weekly or monthly converts to red, we exit.
For exit of short : as soon as 1 of the 3 candles converts to green, we exit.
This strategy- indicator can be adapted to any type of market.

Equity Index Extended HoursHighlights the extended hours/Globex session for US Equity Index Futures.

Profit MAX MTF HeatMapThis is a powerfull strategy which is made from combining 3 multi timeframes into one for profit max indicator
In this case we have daily, weekly and montly.
Our long conditions are the next ones :
if we have an uptrend on all 3 at the same time, we go long.
If we have a downtrend on all 3 of them at the same time we go short.
For exit, for long, as soon as one of the 3 converts into downtrend we exit the trade.
For exit, for short, as soon as one of the 3 converts into uptrend we exit the trade.
This tool can be used on all types of markets, and can also be changed the time frames.

Bollinger Band Color BarsThis is a simple addition to the built in Bollinger Bands script. All it does is replaces the traditional plotting of Bollinger Bands with color bars.

Premium Index Generic TheHuntThis indicator is similar to the standard premium index we made for bitcoin, but this one is for alts.
Just like with the bitcoin premium index, you can compare the spot price of a certain altcoin with the price on a futures exchange. The indicator can be used to spot potential strength or weakness in the market.
You can fill in 1 spot exchange pair and compare it with 2 futures exchange pairs.
For example fill in ETHUSD on coinbase and compare it with the future prices on bitmex and bybit.
We can clearly see that on that dump in the blue area, the premium index showed that spot prices were consistently higher than future prices which told us spot was buying the dip.

BUY/SELL_Strategy_Paydar_V.07BUY/SELL_Strategy_Paydar_V.07
Hello dear friends
This system can be considered as a signal system.
*** This system just Suggests you for points. ***
My suggestion is not to use this system alone and conclude about entry and exit points according to charts, news, market fluctuations and trend direction.
The agenda of this system is as follows:
- Buy signal means:
Time to enter the trade / buy / take a long position and ...
- Sell signal means:
Time to leave the trade / sell / exit the long position
* I suggest you use this system in trading for cryptocurrency and especially for bitcoin.
* My suggested time frame is 1 minute, because during this time and according to the settings of this system, a better result was obtained for me.
* I suggest using this system first in spot trading and then in future trading.
System function:
This system is based on the analysis of 74 different systems, which are:
> 19 indicators and oscillators separately which include:
MACD, RSI, STOCHASTIC, STOCHASTIC RSI, BOLLINGER BANDs, PARABOLIC SAR, VOLATILITY and ...
(All of which can be used on the Trading View site as a public domain and open source)
> 11 cases of previous oscillators and indicators in combination
(All of which can be used in public view and open source on the Trading View site)
> 27 items MA, EMA, VMA, WM, MSM, etc. in combination and separately
> 9 lines and areas of automatic support and resistance
(All of which can be used in public view and open source on the Trading View site)
> 8 different strategies, all of which can be used in public view and open source on the Trading View site
Points.
*** All indicators, oscillators, lines and areas of automatic support and resistance, strategies, etc. can be used as a public domain and open source on the Trading View site. ***
Comment on using this system as well as how to use it.
_______________________________________________________________________________
* In this system, the main and basic indicators and oscillators are used, all of which are in the public view and open source site in Trading View *
I am very grateful and very loyal to Trading View, which built all the indicators, oscillators and strategies, because I used them to build this strategy system.
_______________________________________________________________________________
Be successful and profitable.

Premium Index TheHuntThe indicator is used to see the difference in price between spot and futures prices. If future price is higher than spot in a rally, the rally isn't backed by real buys (spot) but by dumb perp longs which CAN be bearish . If spot price is higher than futures in a rally, the upside is backed by real money (spot) which is bullish.
The indicator allows you to pick a spot pair to compare it with the future exchanges you want. You can select which future exchange pairs to compare with by ticking them in the settings.
As you can see here on the chart during this last rally the index is high in the green which means the rally is backed by futures and spot ain't really following. This could be a sign of exhaustion.

Background to highlight cash/session range [Futures]A simple script which allows the user to highlight the background of a certain session. At the moment there is only one session available, I will work on multiple highlights for numerous sessions at a later date.

Truenomic's Volume Weighted Aggregated BTC Premium IndexAn indicator that determines the aggregated volume-weighted premium from all leading derivatives exchanges:
Bybit
Bitmex
Binance
Ftx
Deribit
Okex
Huobi

Truenomic's BTC Premium IndexAn indicator that determines the premium from all leading derivatives exchanges:
Bybit
Bitmex
Binance
Ftx
Deribit
Okex
Huobi

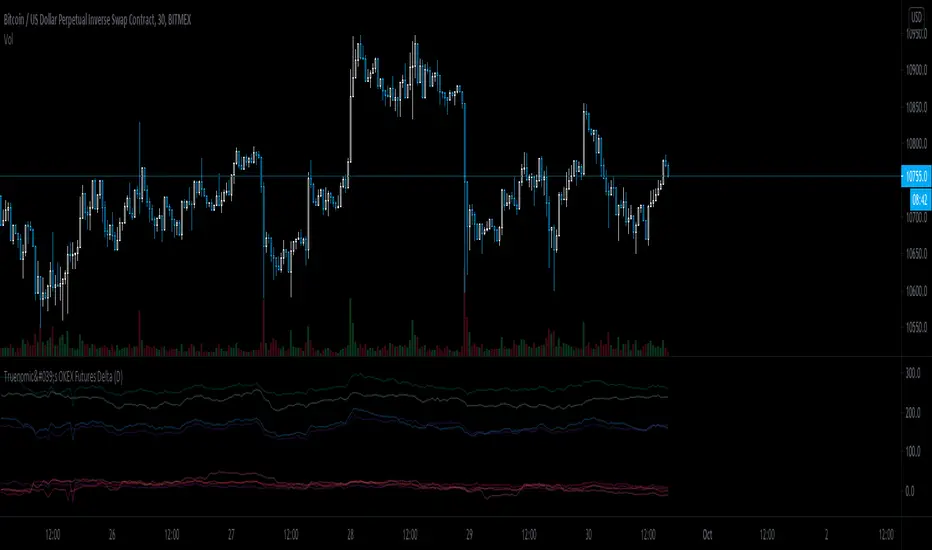
Truenomic's OKEX Futures DeltaA very simple and basic indicator for tracking the delta of all futures from the OKEX exchange.
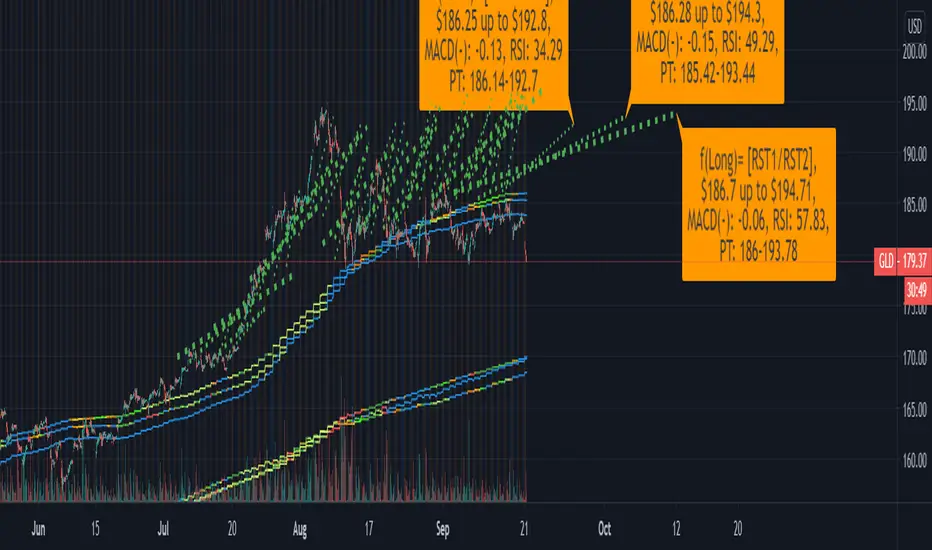
CC - ATP (Auto-Trendline Projection)I created this script with a simple goal in mind: Automatically plot trend-lines for a given interval with a resolution that fits the period chosen.
To accomplish this I used a combination of the following:
Ichimoku Spans and Ichimoku Span Width.
ATR and standard deviation from the ATR of the Ichimoku width.
Rolling MACD with directional RSI for coloration based on acceleration.
I then combined all of these pieces of data into a single label and line plotter, so that you can see the assumed trend-lines for the current period based on the interval selected. It attempts to avoid using look-ahead logic by resolving using security, and plotting based on the suggested methodologies.
Inputs:
n (this must be the smallest number). - This is usually 7,14 or 26 depending on the resolution you're going for.
m (must be m > n and m < o). - This is usually something close to 14,26 or 52.
o (must be o > m and o < p). - This is usually something close to 26,52 or 180.
p (must be p > o). - This is usually just o * 2 or 52, 180 or 360.
Show historical data - Keeps some of the lagging trend-lines at intervals of m, o and p.
Precision - The decimal precision to round to, useful if you need this for BTC or penny stocks.
Common Inputs I use:
n=7, m=14, o=26, p=52
n=14, m=26, o=52, p=180
n=26, m=52, o=180, p=360
You can use any numbers, but roughly you want:
m = n*2, o = m*2, p = o*2.
The labels contain the following information:
Expected Support/Resistance levels
The first level is assumed to be heading to the second level.
For instance, if you have S1 down to R2, that means a support is likely to become a resist.
If you have, instead, R1 up to R2 that means the resistance is moving up, but is still resist.
S1 down to S2 is similar in that it means the support level is moving lower but is still sup.
R1 up to S2 is the one that you want to look for as it indicates potential swings.
More-overly, R1-->S2 or S1-->R1 indicate pivotal moments.
MACD / RSI for the given period.
Pretty simple, it's given to the number of decimal places offered by the inputs.
Price Targets.
If it's above the price target area, that means the swing already probably happened.
If it's in the price target area, you're at a pivotal moment; it could go up or down.
If you're below the price target area, watch for catalysts that force price target entry.
WARNING:
Please note, all of this is trend analysis and can be completely demolished in an instant by a catalyst. If there is a huge retracement event, you MUST WAIT A MINIMUM OF THE INPUT PERIOD OF TIME FOR THE STOCK TO SETTLE. If you have a retracement within n-m periods for instance, the short data will be inaccurate. If you have a retracement from m-o the mid data may be inaccurate until it triggers retracement. Same with o-p on the long level. The higher numbers you use, the less reactive the script, but the more historical data it will consume. For instance high numbers may be good for amazon, so you have less reaction to big dips, as you are not afraid because it is a strong company. While this is good on strong companies, it is suicidal for unknown ones.
DISCLAIMER:
I do NOT state anywhere that the data provided by this indicator is valid, forward looking, or guaranteed. If you make a trade based on this indicator I am in no way responsible for the outcome. All trades should be backed by personal due diligence and not rely directly on the indicators of others, as they may contain unfound bugs, incorrect math or look-ahead logic that is potentially dangerous. One final disclaimer, I am a programmer at heart, and am new to this field of study. While I have found a group of supportive friends, do realize I have been at this for less time than most others, more notably I started on 8/16/2020. Please shower me with constructive criticism and other thoughts you have.
Please take this script and view it as a learning experience not a tool for money as of this moment, if you have further questions about me or my scripts, please feel free to message me.
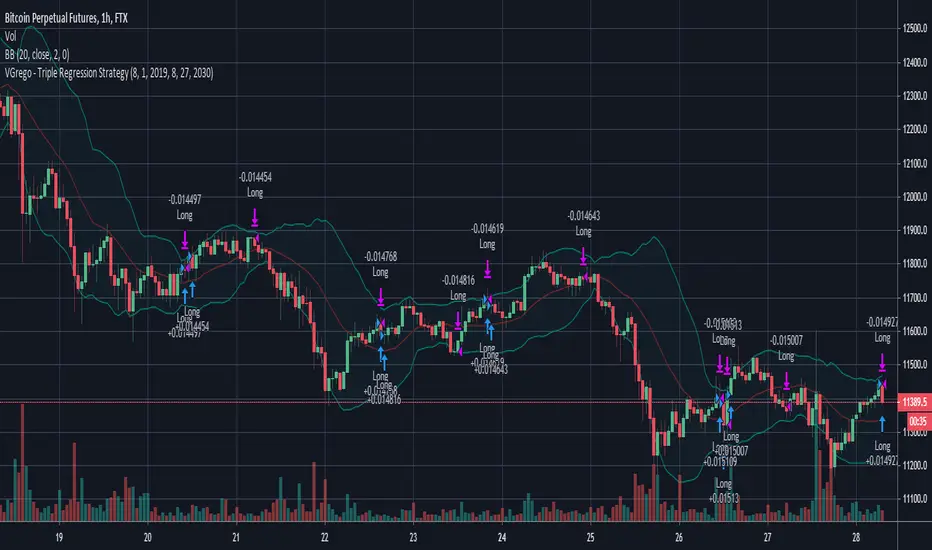
VGrego - Triple Regression StrategyI developed this strategy with perpetual contracts like the ones offered by Bitmex and FTX for Bitcoin.
This script uses complex regressions to analyze past, present and future to place long calls.
The script performs well on 1H charts on most perpetual contracts scenario.
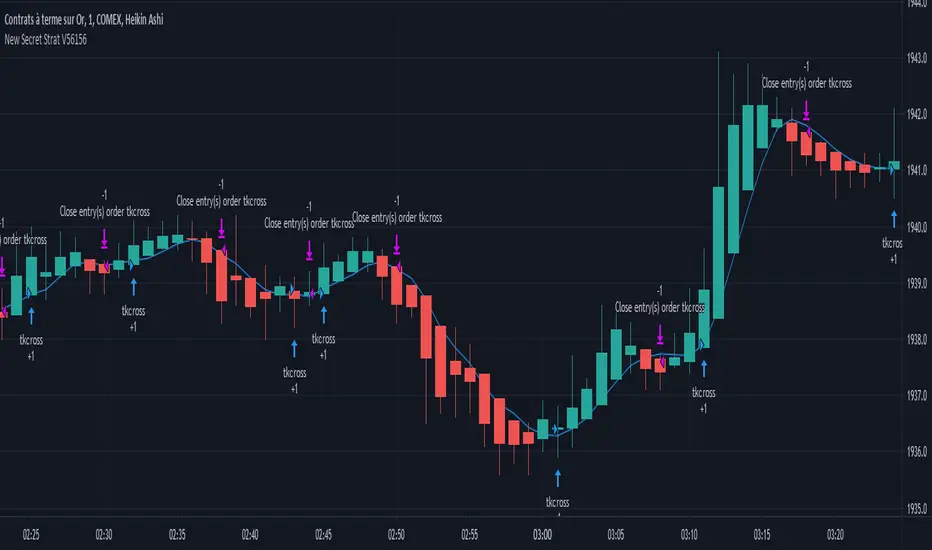
New Secret Strat V56156After years of resserch and development, I finally finished created the best strategy ever made.
It works on every security you can think of: futures, forex, bitcoin, and so on.
It will adapt the pattern of every chart to make the most money possible.
This is the masterpieace I was hopping to produce one day, and now it is.
Right before you.
Enjoy the best strategy that has ever been created.
Good luck !
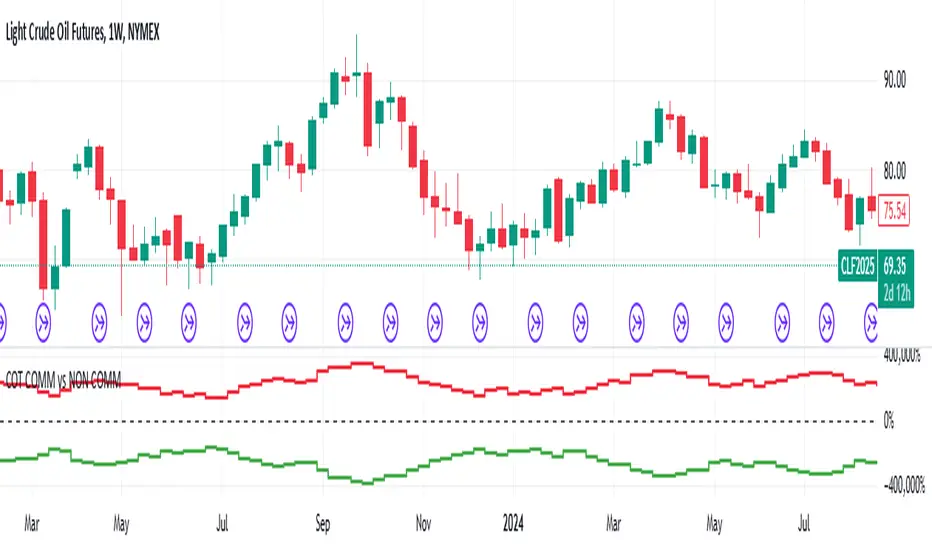
COT Net Non-Commercials vs Commercials (Updated MTF Non-Repaint)Hello there,
With this script, you can see CFTC COT Non Commercial and Commercial Positions together.
This way, you can analyze net values greater than 0 and smaller, as well as very dense and very shallow positions of producers and speculators.
Green - Non Commercials - Speculators
Red - Commercials - Producers
This script is multi time-frame and non-repaint script.
Data pulled through Quandl.
And the latest version codes have been used.
As time goes by, I will try to make useful modifications to this scheme.
Regards.