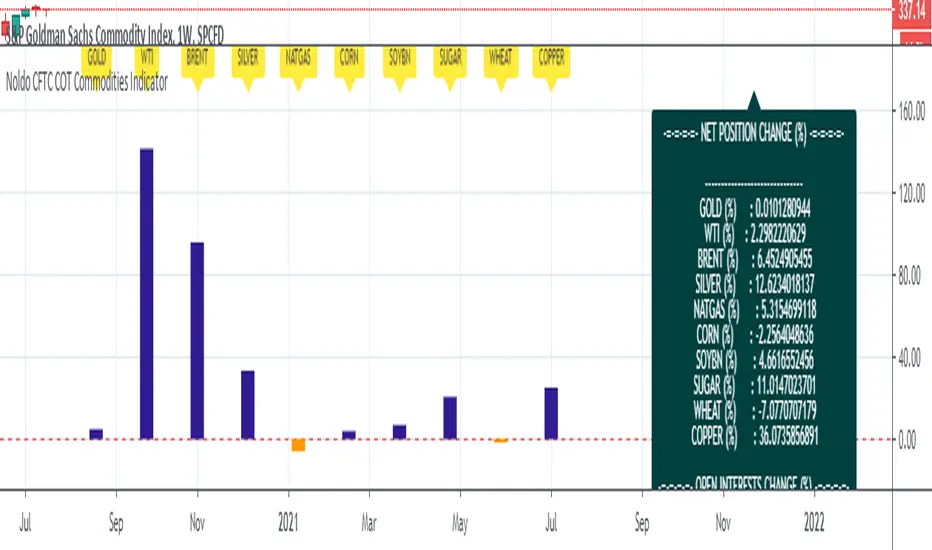
Noldo CFTC COT Commodities IndicatorHi.
Hello, this script has the same logic as Noldo CFTC COT Forex indicator :
It is the version for the future markets.
Major future assets are the subject.
Usage
This script works only on SPGSCI (S&P Goldman Sachs Commodity Index).
You must open SPGSCI :
www.tradingview.com
It only works on 1W graphics.
Because COT data is announced on Tuesday, it will cause repaint every Tuesday.
However, since it is a terminal, this factor is not strong enough to affect your decisions.
For use, you should open the bottom panel, go a little to the right in the history section and enlarge the panel you have opened.
The terminal will take its form in the presentation and provide analysis on the big screen.
COT data are pulled via Quandl.
Regards.
Futures
NCTA Adaptive Entry SystemAdaptive Entry System (AES)
Price action of stocks, indexes, and futures consists of periods of trending action, retracements within the trend and then a resumption of the original trend. Trending patterns do not move straight up or straight down. They move in cycles which, when properly identified, can offer traders an opportunity to “follow the trend” while also recognizing the probability of a near term retracement before resuming movement in the direction of the trend. Experienced traders with advanced skills at interpreting wave patterns (Elliott Wave), Fibonacci retracements, Stochastics (overbought / oversold conditions), Momentum, and Moving Averages apply their advanced knowledge to trading and identifying these trend - retracement - continuation of trend cycles. These skills require an advanced knowledge of these complex indicators and can be difficult for traders without the same skill set to optimize their trading performance.
The Adaptive Entry System (AES) was created as a technical market metrics system to interpret a variety of advanced signals and present to the trader a “single actionable signal” displayed in an easy to recognize format for traders of most any skill level to benefit from.
AES is a “system” as opposed to a single indicator. It was designed with the goal of simplifying a traders ability to recognize an entry opportunity by summarizing the consensus of several key indicators and displaying a single entry / exit signal in a color highlighted, strategy labeled format. The work of comparing a variety of indicators and assessing the strength of alignment is performed for the trader by the Adaptive Entry System.
There are three possible entry signals displayed. A trader may trade all three or customize the settings to choose just a single signal to trade. It is important for any trader incorporating AES into their toolset that they trade in sim / virtual mode for a period of time to confirm they understand how price action responds to the signals and to personally track the performance of each. A good trading system still requires due diligence on the part of the trader to confirm understanding of how the system performs.
Entry Signal #1 Description:
Trend Bias Plus Signal is intended to provide traders with an early view of the probable directional bias of the stock, index, or futures being traded. Trend Bias was designed to recognize the probability of the early stages of the strongest segment of a wave pattern. Recognizing the probable bias of the trend at an early stage and also having an indication of when that trend may be ending offers traders an opportunity to enhance their ability to optimally benefit from the trend.
How to Read the Trend Bias Plus Signal:
The Trend Bias Plus Signal is displayed as a simple to recognize color coding of the price bars. Blue price bars indicate a probable rising price bias. Red price bars indicate a probable declining price bias. White bars indicate a neutral period with no clear directional bias.
How to Trade the Trend Bias Plus Signal:
The Trend Bias Plus Signal is simple to interpret. When a price bar closes blue and the next price bar opens blue, this signals to the trader to open an upward bias position. Buy-to-open a call option, buy the stock, or open a long futures position. When a price bar closes red and the next price bar opens red, this signals to the trader to open a downward bias position. Buy-to-open a put option, short the stock or close a long stock position, or open a short futures position.
When holding a short or long position based on the Trend Bias Plus, there are a variety of exit methods which a trader can use including stops, limit price orders with fixed profit targets, or trail stops. Regardless, the end of a Trend Bias Plus cycle is indicated when a new price bar opens white. This is evidence that the current rising or declining trend is shifting to a neutral state. A trend may also be viewed as having ended when an opposite color bar prints at the open of a new price bar.
Entry Signal #2 Description:
The Momentum Signal is a near term indication of a probable retracement of the current trend. It identifies a temporary reversal of an overarching trend in a stock's price. Retracements are short-term periods of movement against a trend, followed by a return to the previous trend. Momentum signals are usually counter-trend trades identifying that part of the wave sequence where price temporarily moves opposite the direction of the trend. The momentum signal can be an opportunity for traders to take advantage of the natural pattern of trend - retracements - continuation.
How to Read the Momentum Signal:
The Momentum signal is displayed as a vertical color highlight on the price bar with a “M” label inside a directional indicator box. A red vertical highlight with an arrow box and “M” label pointing lower is a signal that the near term price movement may be downward bias. For an upward bias price movement signal, the Momentum indicator will display a green highlight across the price bar with an arrow box and “M” label pointing higher.
How to Trade the Momentum Signal:
When the highlighted directional labeled box prints at the open of a new price bar, take the trade based on the directional bias displayed. Momentum signals are generally counter trend indicators so a downward bias red bar, prompting the trader to go short may print on a long bias blue Trend Bias Plus price bar. This should not be viewed as a conflict but instead as a probable indication of a short term retracement following the natural sequence of cycles in price movement.
Momentum signals may be traded using stocks, options, or futures.
Entry Signal #3 Description:
The Consensus Signal is an indication that price action may be resuming in the direction of the primary trend.
How to Read the Consensus Signal:
The Consensus Signal is displayed as a vertical color highlight on the price bar with a “C” label inside a directional indicator box. A red vertical highlight and an arrow box with a “C” label pointing lower is a signal that the price movement may be resuming a downward bias trend or strengthening a conviction to the current trend. For an upward bias price movement signal, the Consensus indicator will display a green highlight across the price bar and an arrow box with a “C” label pointing higher. This is a signal that the retracement off of the trend may be concluding and/or a strengthening of a conviction to the current trend.
How to Trade the Consensus Signal:
When the highlighted directional labeled box prints at the open of a new price bar, take the trade based on the directional bias displayed. Consensus signals are generally most productive when traded aligned with the trend, as displayed by the Trend Bias Plus price bar color or when a white bar indicates a neutral state of the price trend. Counter trend trades using the Consensus Signal are not advised and considered to be less productive / higher risk.
Consensus signals may be traded using stocks, options, or futures.
Some General Rules:
Trade signals are only considered valid when they display at the open of a new price bar.
The signals can be traded on different timeframe charts from short term 3 minute charts to longer timeframe daily charts.
The signals are designed to be a generic indication of probable price movement and as such, can be used effectively for trading futures, stocks, options on stocks, options on ETFs, and options on cash settled indexes.
AES offers traders an opportunity to optimize performance from the natural cycles of the market….trend - retracement - continuation.
AES offers an opportunity for traders to have a clear entry / exit criteria. However, it is still imperative that each trader understands the trading strategy they intend to use and the risks and opportunities associated with that strategy. It is highly advised, regardless of the system or strategies being used, that a trader validates their understanding of the system/strategy by trading in a simulated, paper account format to self test the system and personal ability to trade it successfully.
Next Bar Alert:
Included is an optional "Next Bar Alert" setting. Since many of these signals benefit from very prompt action at the beginning of a price bar, there is an additional option in Settings to set an arbitrary number of seconds to be alerted before the next price bar opens. Simply set this to a level you prefer, then set an alert in TradingView on the indicator using the "Next Bar Alert" alert parameter.
Summary:
The color highlight indicator allows the trader to be 100% certain that the rules/criteria for confirming a valid entry were met at the open of the price bar. This feature, along with the alert settings in Trading View, provide clear confirmation of the timing and print of the signal as either valid or not.
Adaptive Entry System has been designed to help traders of all skill levels to trade the natural sequence of patterns in price action using a simple to recognize, single signal entry/exit format. The natural cycle of trend (Trend Bias Plus), then retracement (Momentum), followed by a continuation of the original trend (Consensus) can be identified within this system and offers traders a simple signal to take advantage of each phase in the cycle. Stock investors, options traders, and futures traders can benefit from the simple design of the AES on a variety of time frames.
Trend Bias Plus signals on NASDAQ:TSLA Daily chart:
Trend Bias Plus signals on NASDAQ:AMZN Daily chart:

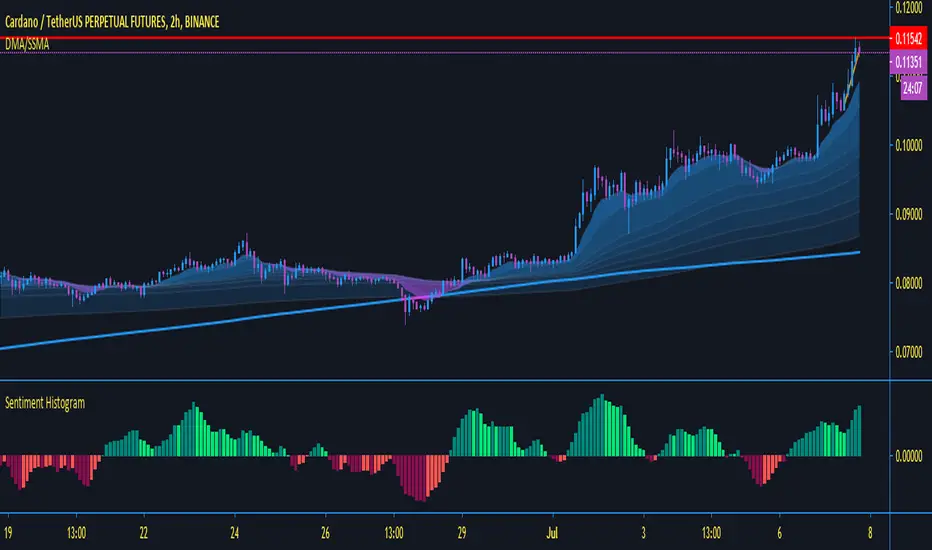
Sentiment Histogramthis indicator is used to plot the sentiment of the pair you are viewing
histogram style being used to make the visual nice and easy
as usual fully adjustable
DM for access rules
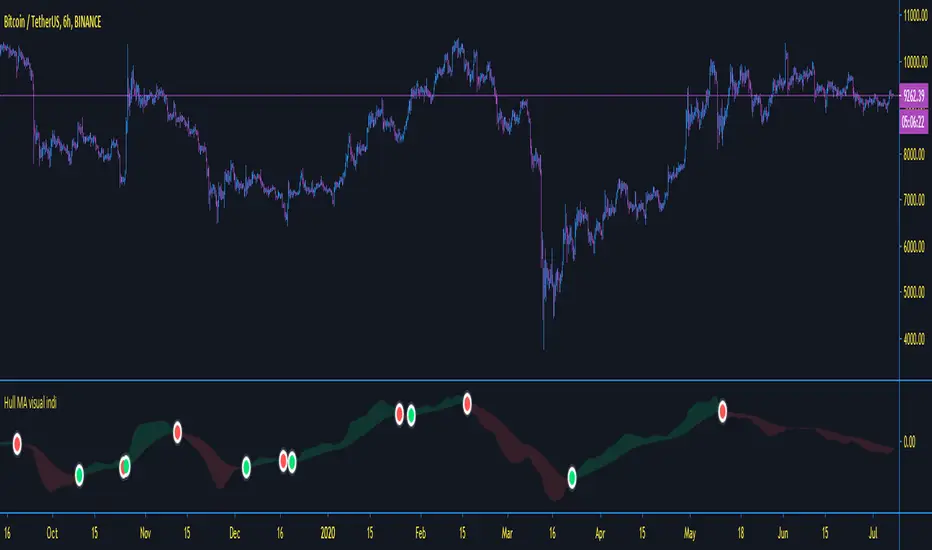
Moving Average Indicator - TradingSargentThis indicator is based on Hull Moving averages, and works best for signals on the 6 hour and above timeframe with standard settings - as always, fully adjustable from settings...
simple to use as another confirmation on your strategies -
Green = buy
red = sell
DM for access rules
PpSignal Algorithmic trading system this strategy uses
1) trend
2) volatility
3) volume
Also, you can find in additional tools, rsi wilders on the chart and its standard deviation.
CFB composite fractal behavior and smoothed atr.
Candle converter MTF.
The strategy uses these four indicators to generate inputs and outputs.
Basically buy when cfb, rsi and atr go in the same direction upwards and the movement is accompanied by a rising volume (cfb green color and rsi Aqua ATR).
Idem in reverse for sell, when cfb, atra and rsi are giving a sell signal (Red color) and the volume is descending.
It is important that you also use other trading systems that you consider convenient. Support and resistance and also fibonacci levels all help to better trading.
Not all assets have or use the same configuration, for this, you must find the appropriate parameters with the variables, long length, short length, source, and period.
for example for btcusd the optimal parameters for me are:
long length = 2
short length = 2
signal length = 2
source = ohlc4
period = 9
It also has a take profit and stops loss tool in percentage.
remember to use parameters according to your tolerance as a trader or investor.
enjoy it
PD: you can write to me privately I have many optimizations and settings already done
este estrategia usa
1) trend
2)volatilidad
3)volumen
Tambien usted podrá encontrar en herramientas adicionales, rsi wilder on the chart y su desviación estándar.
CFB composite fractal behavior y atr suavizado.
Candle converter MTF.
La estrategia usa estos cuatro indicadores para generar entradas y salidas.
Básicamente buy cuándo cfb, rsi y atr van en la misma dirección hacia arriba y el movimiento está acompañado por un volumen ascendente (color verde cfb y rsi Aqua ATR).
Idem a la inversa para el sell, cuando cfb, atra y rsi están dando señal de venta (color Rojo) y el volumen es descendente.
Es importante que también use otros sistemas de trading que usted crea conveniente. Soporte y resistencia y también niveles fibonacci todo ayuda a un mejor trading.
No todos los activos tienen o usan la misma configuración para esto usted deberá encontrar los parámetros adecuado con las variables, long length, short length, source y period.
por ejemplo para btcusd los parámetros óptimos para mi son:
long length = 2
short length = 2
signal length = 2
source = ohlc4
period = 9
También posee una herramienta de take profit y stop lose en porcentaje.
recuerde usar parámetros acorde a su tolerancia como trader o inversor.
disfrutelo

Market Trading Tools - DivergencesOur Divergence indicator is another indicator we are happy to present to interested traders. The indicator detects the possible trend change and it is a well known tool among traders based on bullish and bearish divergences.
To use the indicator well, it will spot divergences but some minimal work might be needed to be done as connecting the waves together to make sure that you get the best entries. You can also wait for the dots to appear in order to take a trade either long or short depending on whatever financial market you are trading and your trading strategy.
The red dots will signify a bearish divergence (trend reversal to the downside), while the green dots will signify a bullish divergence (trend reversal to the upside). The orange and purple dots also will signify a stronger divergence either bullish or bearish .
The divergence indicator we are publishing today works on crypto, stocks, forex, futures and almost all financial assets, however we do recommend using higher time frames for better results and to filter the noise around the divergences (dots), however using lower time frames can just allow you a better entry sometimes since reversals happen on lower time frames than larger ones.
Once you are granted access to use it, add it from going into the scripts >> invite only scripts >> enable the indicator (click on it once). Once the indicator is added to your chart you will see the indicator popping up to a lower pane.
We are happy to announce that our trading indicator is special and unique from different ones because of the features added above + we have added alerts to it. We believe that the indicator plotting and style on chart is also clean and easy for the eyes to catch compared to other indicators around. We have also enabled a function for our users to get a better view of the trend when they add the indicator to their chart. You can now view the trend background color (red&green) depending on if the price is above the EMA of your choice. you can also check whichever time interval you want that does not limit you to the time interval chosen on your chart itself.
Hope you enjoy it, Good luck and stay safe!
** If you are interested in this indicator. please use the link below to obtain access to this indicator

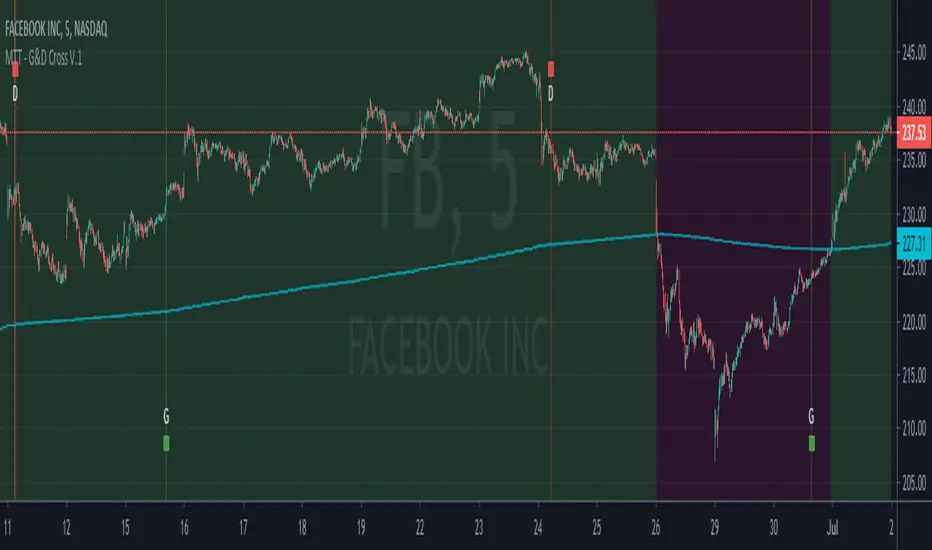
Market Trading Tools - Golden & Death Crosses + AlertsOur Golden & Death Cross indicator is another indicator we are happy to present to interested people. The indicator detects the possible trend change and it is a well known tool among traders.
To make it more convenient for your use we have labeled the golden gross with a G and there is a green vertical bar that is available on the signal. Same for the death cross we have put a D and a red vertical bar.
The indicator can be used on any financial market; crypto, stocks or forex. We do not recommend a certain time frame as each time frame usually this depends on each trader to another, but it works on every time frame, the signals will appear on any time frame used.
Once you are granted access to use it, add it from going into the scripts >> invite only scripts >> enable the indicator. Once the indicator is added to your chart you will see the indicator popping up on your chart.
We are happy to announce that our trading indicator is special and unique from different ones because it has alerts added to it and that feature isnt really available in most of the indicators around. We believe that the indicator plotting and style on chart is also easy for the eyes to catch and will probably not intersect with other indicators you might have on your chart, or at least our other indicators.
We have also enabled a function for our users to get a better view of the trend when they add the indicator to their chart. You can now view the trend background color (red&green) depending on if the price is above the EMA of your choice. you can also check whichever time interval you want that does not limit you to the time interval chosen on your chart itself.
Hope you enjoy it, Good luck and stay safe!
** If you are interested in this indicator. please use the link below to obtain access to this indicator.
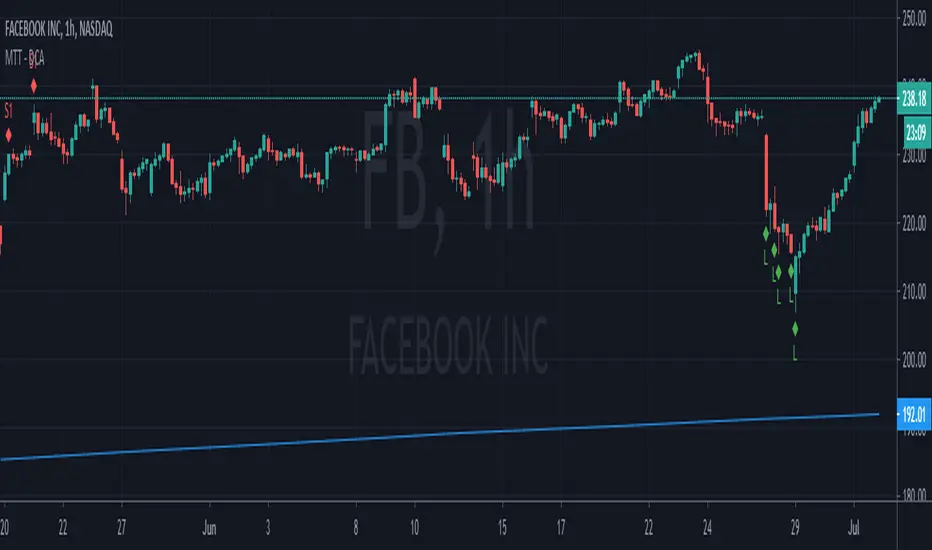
Market Trading Tools - BOOM DCAOur DCA tool is an indicator that is mostly based on RSI. The DCA tool is there to let you know where you should start averaging your entries or longing or shorting a financial asset. It can also give you an idea about when a market can start going the other way depending on the time frame you are using.
DCA will signal two different buy signals and two different sell signals L/L1 - S/S1. S is for Short and L is for long. These signals can be used according to your own desire, S1 and L1 are a condition and S and L are a condition, it is rare when both will occur close to each other but in some cases they can be close depending on market situation. The indicator algorithm is based on 2 indicators, when these two intersect, the signals will be fired once the conditions are met.
** Our Indicator does not repaint.
** It can be used on any financial market; crypto, stocks or forex. We also encourage using time frames as law as the 15 minutes and above. The use of a higher than 4hr time frame requires special settings and once you have access to it, you can change the parameters as you want. We have enabled our users to freely use the settings as they wish and to their on discretionary.
Once you are granted access to use it, add it from going into the scripts >> invite only scripts >> enable the indicator. Once the indicator is added to your chart you will see the indicator popping up on your chart.
We believe that we have not seen a similar indicator, and we are proud of our work and we will continue updating the indicator when we believe it is necessary according to market changes.
Good luck! and stay safe!
** If you are interested in this indicator, please use the link below to obtain access to it.
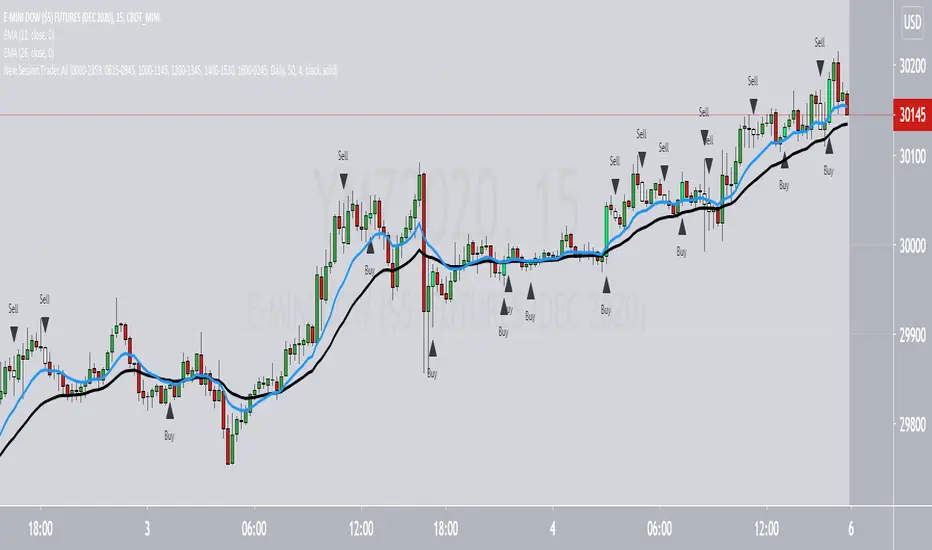
Session Trader2This is the second version of our work on developing signals for day trading stock index futures. In addition to finding signals that trade with the trend this script also looks for key reversal points during the day so that traders can now trade both ways. The signals are designed to operate on an intraday basis and have holding periods of 30 minutes or less. The script uses price action only as its signal generation trades rather than relying upon lagging indicator data. For info on how to obtain this scrip please see our signature file or message us directly on TV. We would be happy to show you.

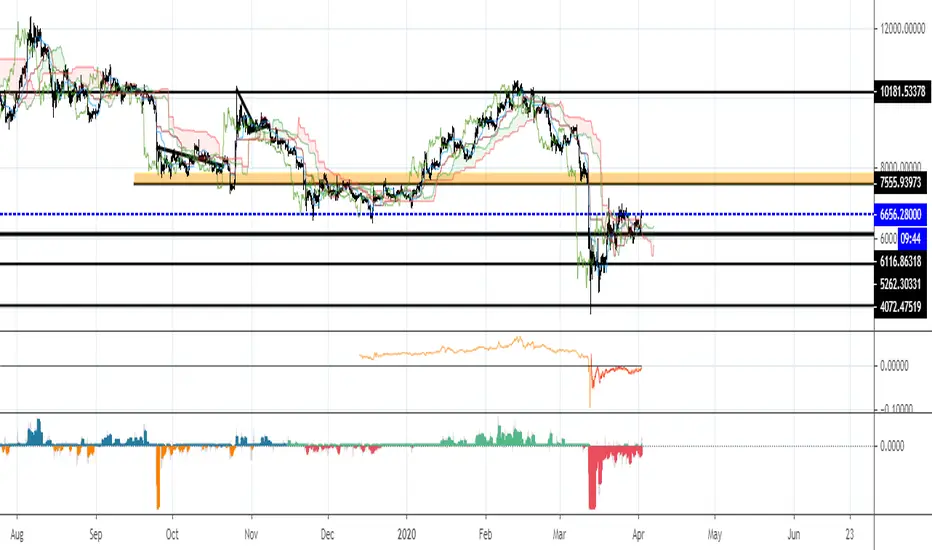
Futures/Perpetuals DeltaBackwardation/Contango of OKEX, HUOBI, BITMEX, DERIBIT futures compared to XBTUSD.
Results indicate that backwardation can mark bottoms in price action.

Bitcoin Futures: Premium Discount Backwardation Contango [CR]Bitcoin Futures Premium Discount - Backwardation Contango
Cryptorhythms back at it again with another release for your quarantined pleasure! We've had this one in our back pocket for a few months adding new features and testing it out. Now its time to release it into the wild!
Intro
This indicator is used to capture additional profits by spread trading on futures contracts.
Description
This indicator is for members only and instructions will be given out upon becoming a member. It allows you to select from dozens of perpetual, futures and spot markets to compare, along with providing an info panel of many useful statistics and triggers.
How to get access?
You can get more information on joining by referring to my signature links. Members gain access to an entire suite of proven trading indicators and a supportive community of traders.

Relativity BEARS FUTURES 50X 4H AlgorithmHi,
This system is prepared only for leveraged markets and for Futures and CFD markets.
Leveraged processing apply to cryptocurrency contracts that are also subject to.
System parameters:
Timeframe = 4H (4 Hours)
Leverage = 50X
Position Size = %1 (0.01) Each Trade
Market Direction : Short
System features :
- It targets the Risk /Reward Ratio of 1/3 and above. (Risk/Reward Ratio >= 3 )
- If a Take Profit Point has come in a successful trade but the parameter conformity has not deteriorated, system continues the trade.
- In this way, you can catch strong long trends several times a year.
But it is strict as stop-loss and avoids large declines,whipsaws whenever possible.
- The system tries to avoid unnecessary processes as much as possible.
This means less commission and less sideways market.
- Since it takes advantage of the reverse market, it is suitable not only for long and short but only for short position, ie "bears".
But this neutralizes unnecessary processes.
- Stop-Loss points and Snow-take points are shown in red and green.
-However, if there is a small amount of follow-up available at the computer, it is recommended to put stop-loss only.
Because the system revises both stop-loss and take profit points according to the conditions formed.
Doing this in the right major long trend here allows you to be in trades.
-The system takes into account the risk and only opens transactions where the value corresponding to 10 leverage ratio is greater than the risk.
This provides as much protection from risk as possible.
-Alerts added.
About Backtest :
Since this system uses leveraged market, backtest results are not healthy.
But since it targets the 1/3 Risk Reward Rate (3.00),
we must look Ratio Avg Win/Loss and it must be over 0.5 because :
This ratio means: When we reach 33% of our correct trades in all our trades, we are at breakeven.
This is 100 - 33 = 66
33/66 = 0.5 (Ratio Avg. Win / Avg Loss )
So whenever this rate is over 0.5, we make a profit.
*** The fact that this ratio is over 0.70-1.00 in terms of securing ourselves because there is a maturity in the future indicates that we are doing
successful snowball trades.(Because future contracts have loss of maturity and end dates)
And we achieve success cumulatively.
Important Note : This system is prepared only for these parameters.
These parameters are designed for Futures and CFDs.
It doesn't work in spot markets and Forex Markets.
NOTE :
The system has been prepared as a strategy to present success in a transparent manner.
Please check "Ratio Avg . Win / Avg Loss" rates in backtests.(Especially preferred financial instruments what you trade generally)
Important Note 2 -
Although the system revises the stop and take profit points in the required parameters, the most accurate place is when the signal comes.
It should be entered when the signal comes as much as possible and if this did not happen,
trade must be opened in the nearest bars after the signal comes.
If the position is not closed, renew your position in the new month by observing the maturity conditions.
Here you should pay attention to the maturity, the cost of transportation.
Because the more time to maturity, the more advantageous it will be.
Best regards.

Relativity BULLS FUTURES 50X 4H AlgorithmHi,
This system is prepared only for leveraged markets and for Futures and CFD markets.
Leveraged processing apply to cryptocurrency contracts that are also subject to.
System parameters:
Timeframe = 4H (4 Hours)
Leverage = 50X
Position Size = %1 (0.01) Each Trade
System features :
- It targets the Risk /Reward Ratio of 1/3 and above. (Risk/Reward Ratio >= 3 )
- If a Take Profit Point has come in a successful trade but the parameter conformity has not deteriorated, system continues the trade.
- In this way, you can catch strong long trends several times a year.
But it is strict as stop-loss and avoids large declines,whipsaws whenever possible.
- The system tries to avoid unnecessary processes as much as possible.
This means less commission and less sideways market.
- Since it takes advantage of the reverse market, it is suitable not only for long and short but only for long position, ie "bulls".
But this neutralizes unnecessary processes.
- Stop-Loss points and Snow-take points are shown in red and green.
-However, if there is a small amount of follow-up available at the computer, it is recommended to put stop-loss only.
Because the system revises both stop-loss and take profit points according to the conditions formed.
Doing this in the right major long trend here allows you to be in trades.
-The system takes into account the risk and only opens transactions where the value corresponding to 10 leverage ratio is greater than the risk.
This provides as much protection from risk as possible.
-Alerts added.
About Backtest :
Since this system uses leveraged market, backtest results are not healthy.
But since it targets the 1/3 Risk Reward Rate (3.00),
we must look Ratio Avg Win/Loss and it must be over 0.5 because :
This ratio means: When we reach 33% of our correct trades in all our trades, we are at breakeven.
This is 100 - 33 = 66
33/66 = 0.5
So whenever this rate is over 0.5, we make a profit.
*** The fact that this ratio is over 0.70-1.00 in terms of securing ourselves because there is a maturity in the future indicates that we are doing
successful snowball trades.(Because future contracts have loss of maturity and end dates)
And we achieve success cumulatively.
Important Note : This system is prepared only for these parameters.
These parameters are designed for Futures and CFDs.
It doesn't work in spot markets and Forex Markets.
NOTE :
The system has been prepared as a strategy to present success in a transparent manner.
Please check "Ratio Avg . Win / Avg Loss" rates in backtests.
Important Note 2 -
Although the system revises the stop and take profit points in the required parameters, the most accurate place is when the signal comes.
It should be entered when the signal comes as much as possible and if this did not happen,
trade must be opened in the nearest bars after the signal comes.
If the position is not closed, renew your position in the new month by observing the maturity conditions.
Here you should pay attention to the maturity, the cost of transportation.
Because the more time to maturity, the more advantageous it will be.
Best regards.

Relativity BEARS FUTURES 10X 1D AlgorithmHi,
This system is prepared only for leveraged markets and for Futures and CFD markets.
Leveraged processing apply to cryptocurrency contracts that are also subject to.
System parameters:
Timeframe = 1D (1 Day)
Leverage = 10x
Position Size = %1 (0.01) Each Trade
System features :
- It targets the Risk /Reward Ratio of 1/3 and above. (Risk/Reward Ratio >= 3 )
- If a Take Profit Point has come in a successful trade but the parameter conformity has not deteriorated, system continues the trade.
- In this way, you can catch strong long trends several times a year.
But it is strict as stop-loss and avoids large declines,whipsaws whenever possible.
- The system tries to avoid unnecessary processes as much as possible.
This means less commission and less sideways market.
- Since it takes advantage of the reverse market, it is suitable not only for long and short but only for short position, ie "bears".
But this neutralizes unnecessary processes.
- Stop-Loss points and Snow-take points are shown in red and green.
-However, if there is a small amount of follow-up available at the computer, it is recommended to put stop-loss only.
Because the system revises both stop-loss and take profit points according to the conditions formed.
Doing this in the right major long trend here allows you to be in trades.
-The system takes into account the risk and only opens transactions where the value corresponding to 10 leverage ratio is greater than the risk.
This provides as much protection from risk as possible.
-Alerts added.
About Backtest :
Since this system uses leveraged market, backtest results are not healthy.
But since it targets the 1/3 Risk Reward Rate (3.00),
we must look Ratio Avg Win/Loss and it must be over 0.5 because :
This ratio means: When we reach 33% of our correct trades in all our trades, we are at breakeven.
This is 100 - 33 = 66
33/66 = 0.5
So whenever this rate is over 0.5, we make a profit.
*** The fact that this ratio is over 0.70-1.00 in terms of securing ourselves because there is a maturity in the future indicates that we are doing
successful snowball trades.(Because future contracts have loss of maturity and end dates)
And we achieve success cumulatively.
Important Note : This system is prepared only for these parameters.
These parameters are designed for Futures and CFDs.
It doesn't work in spot markets and Forex Markets.
NOTE :
The system has been prepared as a strategy to present success in a transparent manner.
Please check "Ratio Avg . Win / Loss" rates in backtests.
Important Note 2 -
Although the system revises the stop and take profit points in the required parameters, the most accurate place is when the signal comes.
It should be entered when the signal comes as much as possible and if this did not happen,
trade must be opened in the nearest bars after the signal comes.
Here you should pay attention to the maturity, the cost of transportation.
Because the more time to maturity, the more advantageous it will be.
Best regards.

Relativity BULLS FUTURES 10X 1D AlgorithmHi,
This system is prepared only for leveraged markets and for Futures and CFD markets.
Leveraged processing apply to cryptocurrency contracts that are also subject to.
System parameters:
Timeframe = 1D (1 Day)
Leverage = 10x
Position Size = %1 (0.01) Each Trade
System features :
- It targets the Risk /Reward Ratio of 1/3 and above. (Risk/Reward Ratio >= 3 )
- If a Take Profit Point has come in a successful trade but the parameter conformity has not deteriorated, system continues the trade.
- In this way, you can catch strong long trends several times a year.
But it is strict as stop-loss and avoids large declines,whipsaws whenever possible.
- The system tries to avoid unnecessary processes as much as possible.
This means less commission and less sideways market.
- Since it takes advantage of the reverse market, it is suitable not only for long and short but only for long position, ie "bulls".
But this neutralizes unnecessary processes. (Short market direction, the system for bears will be published separately.)
- Stop-Loss points and Snow-take points are shown in red and green.
-However, if there is a small amount of follow-up available at the computer, it is recommended to put stop-loss only.
Because the system revises both stop-loss and take profit points according to the conditions formed.
Doing this in the right major long trend here allows you to be in trades.
-The system takes into account the risk and only opens transactions where the value corresponding to 10 leverage ratios is greater than the risk.
This provides as much protection from risk as possible.
-Alerts added.
About Backtest :
Since this system uses leveraged market, backtest results are not healthy.
But since it targets the 1/3 Risk Reward Rate (3.00),
we must look Ratio Avg Win/Loss and it must be over 0.5 because :
This ratio means: When we reach 33% of our correct trades in all our trades, we are at breakeven.
This is 100 - 33 = 66
33/66 = 0.5
So whenever this rate is over 0.5, we make a profit.
*** The fact that this ratio is over 0.70-1.00 in terms of securing ourselves because there is a maturity in the future indicates that we are doing
successful snowball trades.(Because future contracts have loss of maturity and end dates)
And we achieve success cumulatively.
Important Note : This system is prepared only for these parameters.
These parameters are designed for Futures and CFDs.
It doesn't work in spot markets.
NOTE :
The system has been prepared as a strategy to present success in a transparent manner.
Please check "Ratio Avg. Win / Loss" rates in backtests.
Important Note 2 -
Although the system revises the stop and take profit points in the required parameters, the most accurate place is when the signal comes.
It should be entered when the signal comes as much as possible and if this did not happen,
trade must be opened in the nearest bars after the signal comes.
Best regards.

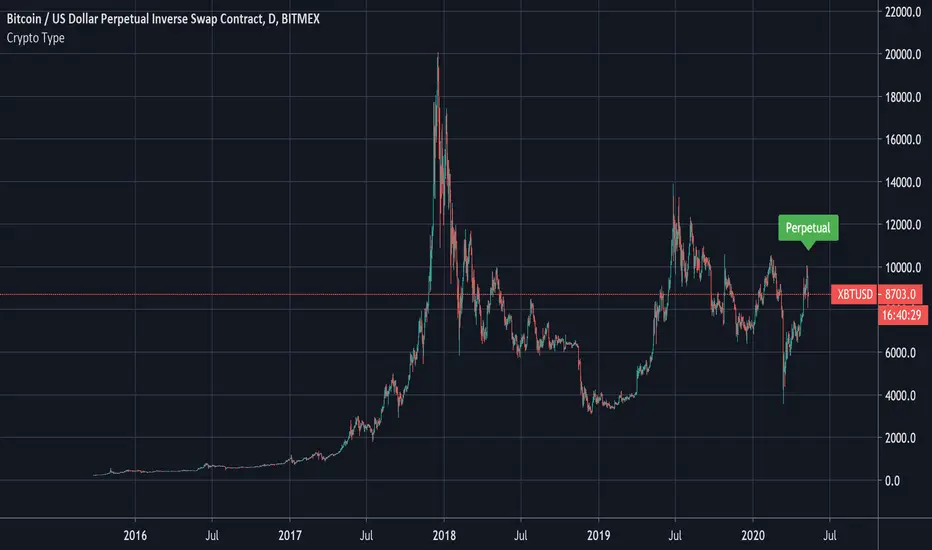
Crypto Type: Regular, Perpetual, Or Futures?A simple way to find out if the security in question is a regular, perpetual, or futures pair.
This reads the data of the security's description and sees if the word perpetual or futures is mentioned.
The method to check if a string has the letters we seek was first introduced by MichelT .
Thank you for checking this out and I hope this helps unlocking new hidden potential.
Session.TrdrThis a script designed to find continuation patterns on a variety of instruments but ideally on futures over short periods of time. The script can be used to trade trend over weekly and even monthly time frames but is best used for day trading. The script uses price action only as its key inputs highlighting the points during the trading day when the dominant flow has resumed. The script is designed to be traded on the 15M time frame for intra-day signals. To get access to the script please see the contact details in our signature.

Quarters, halves and roundiesThis indicator shows the quarters (25/75), halves (50) and roundies (00) between an upper and lower limit.
It is often used for futures ( CME_MINI:NQ1! or CME_MINI:ES1! ).
You can switch on/off the quarters (25/75) and choose a color for the lines.
Feel free to comment below if you like it, what you need to be improved or changed or whatever variations you wish!

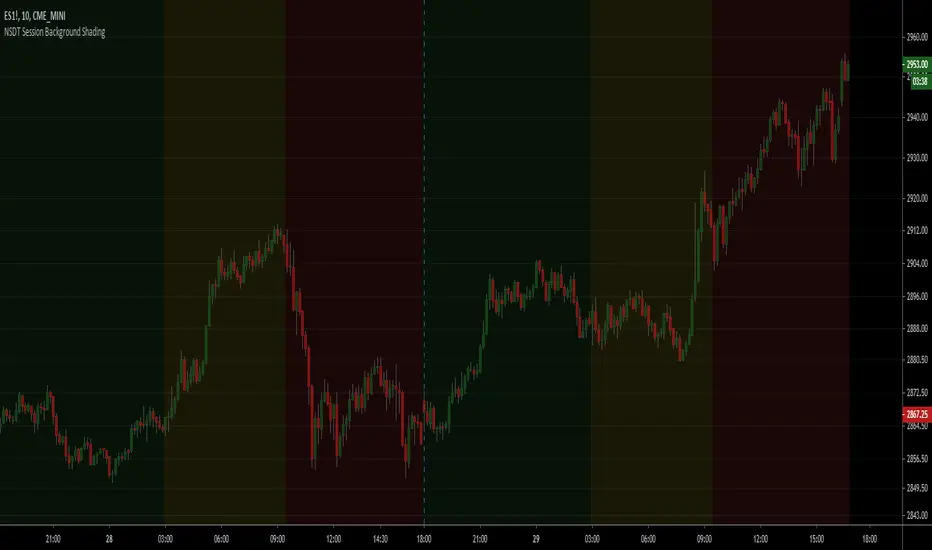
NSDT Session Background ShadingA simple script to add background colors to specific timeframes. Great for trading futures so you can separate sessions for easier viewing. Use for stocks to separate pre, open, and post market times.
There are three timeframes that can be set and all colors can be modified.
McMillan Volatility Bands w/ Buy & Sell Signals [optstrategist]BACKGROUND
McMillan Volatility Bands are an alternative approach to John Bollinger's "Bollinger Band" study and developed by world-renowned options trader and author Lawrence G. McMillan. Given his background in options trading, it was natural for Lawrence to approach any volatility-based study in the same manner options are priced --using Black-Scholes model. This model of pricing assumes a financial asset's volatility should be measured in percentage change rather than absolute value change.
OVERVIEW
The McMillan Volatility Bands indicator for TradingView will plot the 3 and 4-standard deviation bands around a 20-day moving average. This is how Larry has always used this system. The user can, however, change the standard deviation value as well as the moving average length to their preferred setting. This indicator can be used on any asset and on any timeframe.
Furthermore, the indicator will plot buy and sell signals based on a trading system used by Larry in his flagship newsletter publication The Daily Strategist. The system gives a signal when price closes outside the 4-sigma band and then closes back within the 3-sigma band. That 'signal bar' will be colored red or green for a sell or buy signal setup, respectively.
Finally, an arrow will be plotted on the chart where the system would actually enter the trade. This is determined when price trades a little beyond the extreme of the 'signal bar'. The level by which price has to go beyond the 'signal bar' is an input parameter and can be adjusted by the user. We've chosen the default value of 0.34. This means, the indicator will not give a buy or sell entry until the price moves: 1/3 x beyond the extreme signal bar. This is to prevent getting whipsawed by some setups that never really move in your favor. We've found it successfully removes the less-valuable trade setups.
PARAMETERS
ma_length => length of the moving average that the volatility bands work off of
outside_sigma => standard deviation of outer volatility band
inside_sigma => standard deviation of inner volatility band
entry_trigger_cushion => this refers to the percentage of the signal bar's range. The default value is 0.34. This means price will need to move 1/3 (~34%) of the signal bar's range beyond the high (for a buy) or low (for a sell) of the signal bar to trigger a buy/sell entry. This entry plots the arrow on the chart. We have found requiring this extra move in price eliminates many of the less-desirable signals at the expense of entering the better signals a little later.
WANT TO PURCHASE OR NEED MORE INFORMATION ON McMILLAN VOLATILITY BANDS?
Visit the link below to see purchasing options as well as screenshots of the indicator and how we trade it at McMillan Analysis Corp.

Price CorrelationsThis indicator shows price correlations of your current chart to various well-known indices.
Values above 0 mean a positive correlation, below 0 a negative correlation (not correlated).
It works well with daily candle charts and above, but you may also try it on 1h candles.
The default indices:
- Gold
- S&p 500
- Mini Dow Jones
- Dow Jones
- Russel 2000
- Nasdaq 100
- Crude Oil
- Nikkei 225 (Japan)
- FTSE 100 (UK)
- Silver
- DAX Futures (DE)
You can change the defaults to compare prices with other indices or stocks.

Bitcoin future premiumsThis shows the actual premium or the deviation between chosen active bitcoin futures and the bitcoin perpetual price as a representation of the underlying bitcoin price.
It's centered around zero meaning the futureprice and the perpetual contract are the same.
This simple indicator can for example be used to indentify sentiment in the market.
Please make sure you fill out active contracts in the settings for this indicator to work.