Trade Calculator by RealmixA clean Trade Calculator for any Asset, which calculates everything you need to know.
This script is a modified version of the Position Calculator by Mysteriown. Link:
I try to make it a bit better for Futures Trading.
Futures
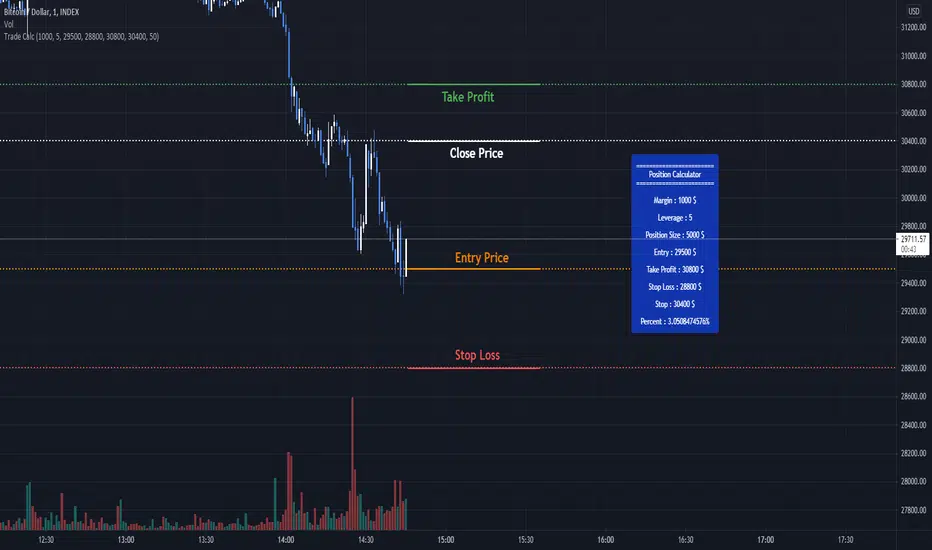
Target Price for KuCoin FuturesWhen trading on KuCoin, it can be difficult to determine what you're exit price should be.
This script solves this issue by giving you an exit price based on a given entry price, a base margin, and a target profit %.
USE CASES:
No Entry Price:
If you have no position in KuCoin, then this use case could be more helpful. With no entry price inputted, two lines will be drawn above and below the current closing price.
The blue line represents your exit price for if you were to enter into a long at the current close.
The orange line represents your exit price if you were to enter into a short at the current close.
With Entry Price:
If you're already in a position in KuCoin, then this case might be more helpful.
The green line represents your exit price for a long from your entry price
The red line represents your exit price for a short from your entry price
The yellow line represents your entry price itself.

Crypto Strategy for Bearish Markets (Binance, FTX, Futures...)BINANCE:BTCUSDTPERP
Even in months like May '21 you can win by going long on Bitcoin. This strategy proves it and is not overwhelmed by Elon's ...
The backtest was carried out during the month of May of this year and, as you can see, all the long operations opened during the fall were successful.
So if we are going to continue to have a bear market for some time, why not take advantage of it while we remain bulls?
This strategy uses Dollar-Cost-Average (DCA) to average the entry price. Thanks to this, it is able to close profitable trades even in times of great volatility and bearish pressure.
It includes alerts that can be configured that will be sent every time the conditions to operate are met. These alerts can also be linked with 3commas for a fully automatic operation.
For Leverage Futures or Margin traders, all you have to do is divide the initial capital by the leverage used.
Enjoy!

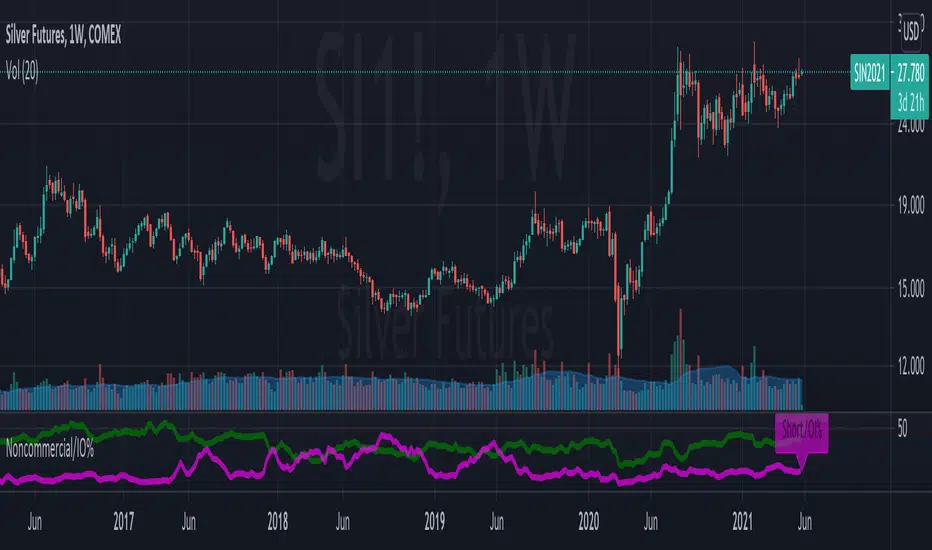
Noncommercial long futures position to overall Open InterestThis is an indicator that gets data from Quandl and presents weekly CFTC futures data (www.cftc.gov). In this indicator, the noncommercial long/short positions are calculated as a percentage of overall Open Interest. This indicates the bullish/bearish sentiment of the market.
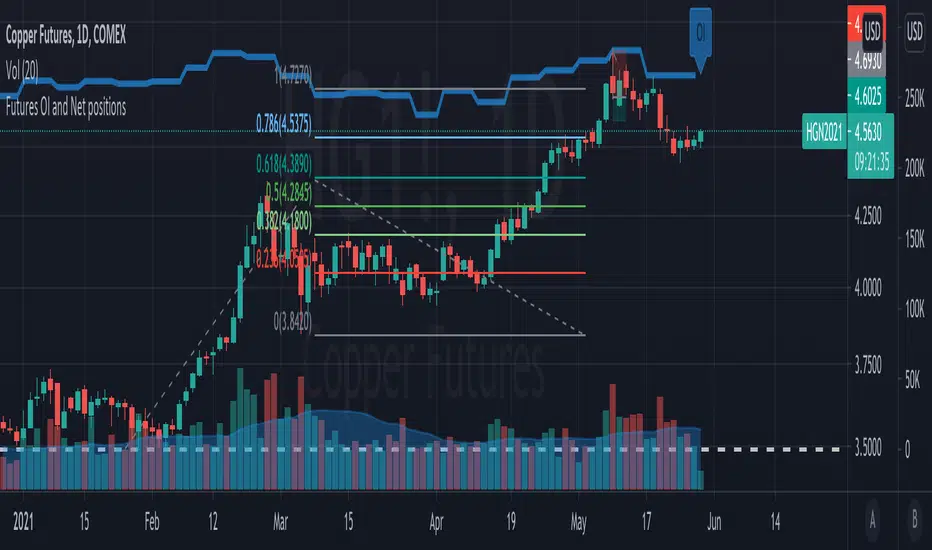
Futures OI and Net positionsThis is an indicator that gets data from Quandl and presents weekly CFTC futures data (www.cftc.gov). In this indicator, Open Interest (OI) and net noncommercial positions are presented. Net_noncommercial positions are calculated as noncommercial_long - noncommercial_short.
(D7R) FTX Ethereum FuturesEthereum FTX Contract Futures Price with 3 different value display modes. (Percentage, Delta, Absolute).
This information can be used to understand when futures are trading at relative strong/weak premium or discount against each other.
This information can either be used for cash-n-carry arbitrage, inter-exchange arbitrage, hedging or directional price speculation.
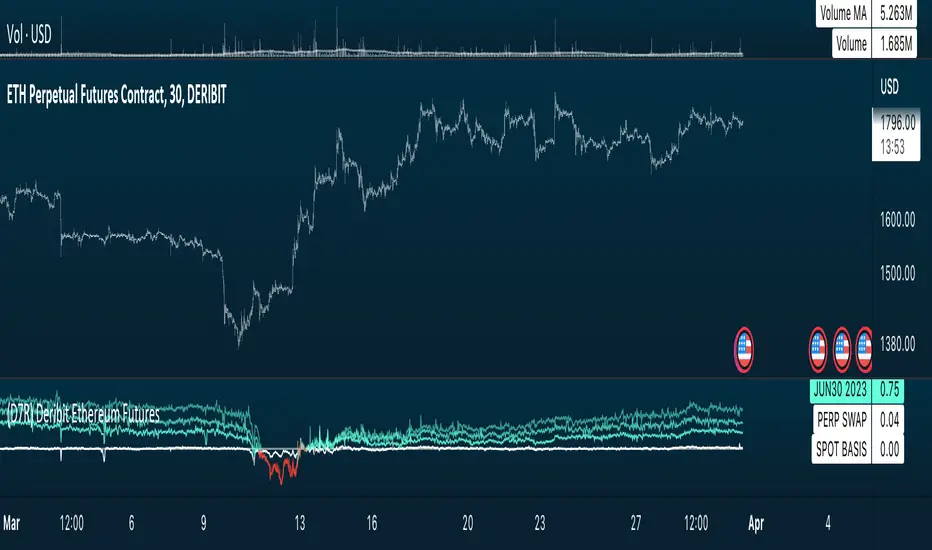
(D7R) Deribit Ethereum FuturesEthereum Deribit Contract Futures Price with 3 different value display modes. (Percentage, Delta, Absolute).
This information can be used to understand when futures are trading at relative strong/weak premium or discount against each other.
This information can either be used for cash-n-carry arbitrage, inter-exchange arbitrage, hedging or directional price speculation.

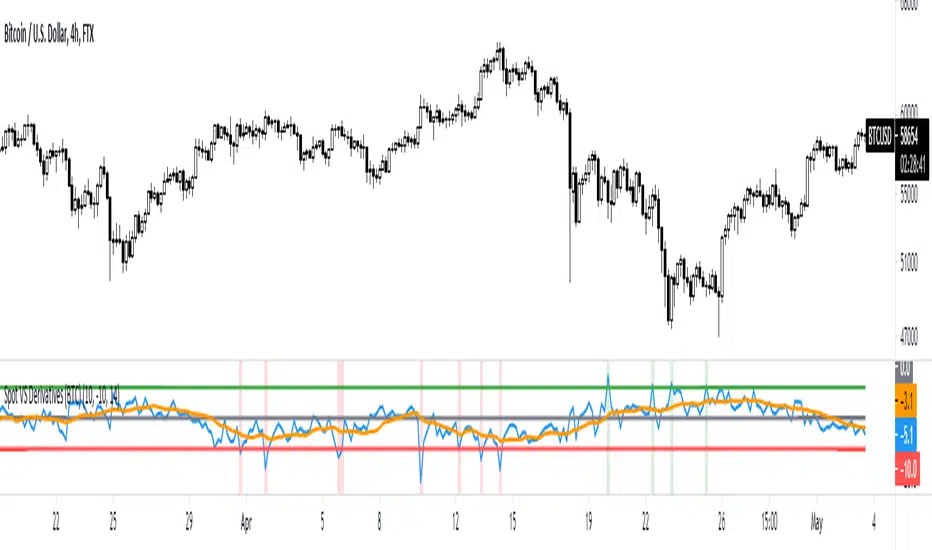
Spot VS Derivatives (BTC)This indicator shows you the difference between the price on the spot exchanges and the derivatives exchanges. When the ratio spikes upward, it is a good buying opportunity, and when it spikes downward, it is a good moment to sell. The best timeframe for this indicator is 4h. The calculation includes top 10 spot and derivatives exchanges by volume .
FTX Futures Premium %Charts the Futures Premium % for FTX futures markets
Change the asset name from BTC to ETH in settings to switch assets, and will work with all assets with long-dated futures markets on FTX as they are added

Full CRYPTO pack macd, rsi, obv, ema alert versionThis is the indicator version of a simple, yet very efficient crypto strategy, adapted to 4h time frame, on big coins like ETH and BTC . However it can be adapted to other markets, timeframes etc
For this strategy I use a combination of a trend line , an oscillator, price action and volume .
This study has alert for both long and short entries/exit.
The rules are the next ones:
Long : we check that current candle is ascending and above the moving average, the macd is in positive range, rsi is below overbought level and volume is bigger than the moving avg of volume .
For short, we have the opposite long rules.
If you have any questions, please let me know !

MACD oscillator with EMA strategy 4H This is a simple, yet efficient strategy, which is made from a combination of an oscillator and a moving average.
Its setup for 4h candles with the current settings, however it can be adapted to other different timeframes.
It works nicely ,beating the buy and hold for both BTC and ETH over the last 3 years.
As well with some optimizations and modifications it can be adapted to futures market, indexes(NASDAQ,NIFTY etc), forex(GBPUSD), stocks and so on.
Components:
MACD
EMA
Time condition
Long/short option
For long/exit short we enter when we are above the ema, histogram is positive and current candle is higher than previous.
For short /exit long , when close below ema, histo negative and current candles smaller than previous
If you have any questions please let me know !

Trend Surfers - Premium Breakout + AlertsTrend Surfers - Premium Breakout Strategy with Alerts
I am happy today to release the first free Trend Surfers complete Breakout Strategy!
The strategy includes:
Entry for Long and Short
Stoploss
Position Size
Exit Signal
Risk Management Feature
How the strategy works
This is a Trend Following strategy. The strategy will have drawdowns, but they will be way smaller than what you would go through with buy and old.
As a Trend Following strategy, we will buy on strength, when a breakout occurs. And sell on weakness.
The strategy includes a FIX Stoploss determined by an ATR multiple and a trailing Stoploss/Takeprofit also determined by an ATR multiple.
You can also manage your risk by entering the maximum % you are willing to risk on every trade. Additionally, there is an option to enter how many pairs you will be trading with the strategy. This will change your position size in order to make sure that you have enough funds to trade all your favorite pairs.
Use the strategy with alerts
This strategy is alert-ready. All you have to do is:
Go on a pair you would like to trade
Create an alert
Select the strategy as a Trigger
Wait for new orders to be sent to you
Every Entry (Long/Short) will include:
Market Entry (Enter position NOW!)
Stoploss price
Position Size
Leverage
* If you do not wish to use leverage, you can multiply the Position Size by the Leverage. But doing that, you might end up with a position greater than your equity. Trading on Futures is better in order to have accurate risk management.
Exit signals:
When you receive an exit signal, you need to close the position ASAP. If you want to keep your results as close as possible to the backtest results, you need to execute quickly and follow what the strategy is telling you.
Do not try to outsmart the strategy
Leave your emotion out of trading! If you trust the strategy, you will have way better returns than if you try to outsmart it. Follow each signal you receive even if it doesn't seem logical at the moment.
Become a machine that executes. Don't look at fundamentals. Follow the trend! Trust the strategy!
I hope you enjoy it!

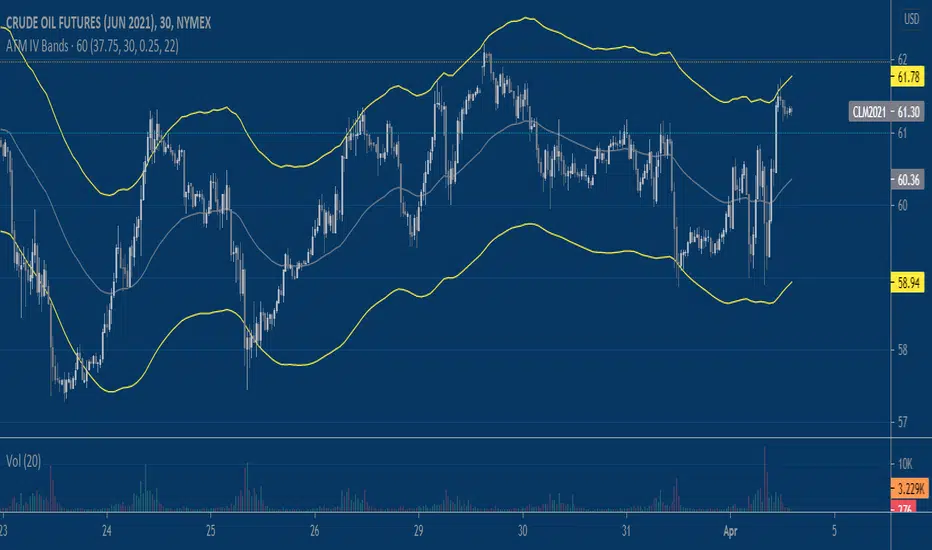
Implied Volatility BandsThis script produces price bands around an EMA based on a manually inputted Implied Volatility. The idea builds on my previous "Implied Move" script which helps visualize the distribution of prices that the market is 'pricing in' via options/implied volatility. It's up to the user to determine the implied volatility level they use, I like using the free version of QuikStrike that you can access via the CME Group website and then update the script's input daily. Another way to use the script is to input the implied volatility based on a forecast that you produce independently. Say implied volatility on June 2021 Crude Oil is 30% and you think it's rich by 2%, you can input 28% into the script to tweak the bands for a declining vol regime.
Crypto price action strategy long onlyThis is a very powerful strategy, which I adapted mostly for futures perp pairs like BTCUSDTPERP or ETHUSDTPERP.
Its made purely of price action rules like :
We check for the last down candle before a sequence of up candles, or the last up candle before a sequence of down candles.
At the same time I combine with other rules ,like for example during this sequence comparing the actual candle high and low with the min/max of the candles from the sequece before establishing if its a potential entry or not.
So far I have noticed that it works greatly with big timeframes 1h+ .
The results from above are using 1h on BTCUSDTPERP binance, together with 4 on length and 0.03% comission for futures on perp binance
If there are any questions , let me know in private !

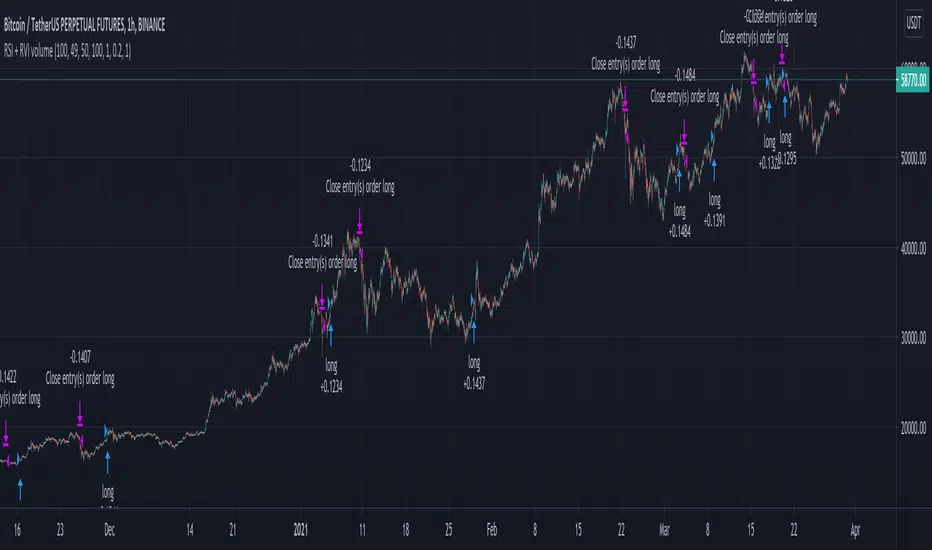
RSI and RVI on volume crypto BTC This strategy combine special version of RSI and RVI , where in this case , I am using the volume , for measuring the speed and change of volume to the price both up and down size together with the volatility spikes.
In this case instead of looking at the volume or volatility, I am combining them into one oscillator.
For best usage, I believe a big length of candles like 100 can get better results, and use it in this way as a lagging indicator.
Since most of the tests I made for futures, I applied a risk management in % of the price movement. For stop loss we have 20% while for TP, 100%. However in both cases, we will exit sooner, and thats going to be when condition from the oscillator says so.
For this we have a middle level, 50, which will act as both overbought and oversold areas.
At the same time I apply the posibility of using leverage into size calculations for more precise tests and try to get min-max out of it.
If you have any questions, please let me know !
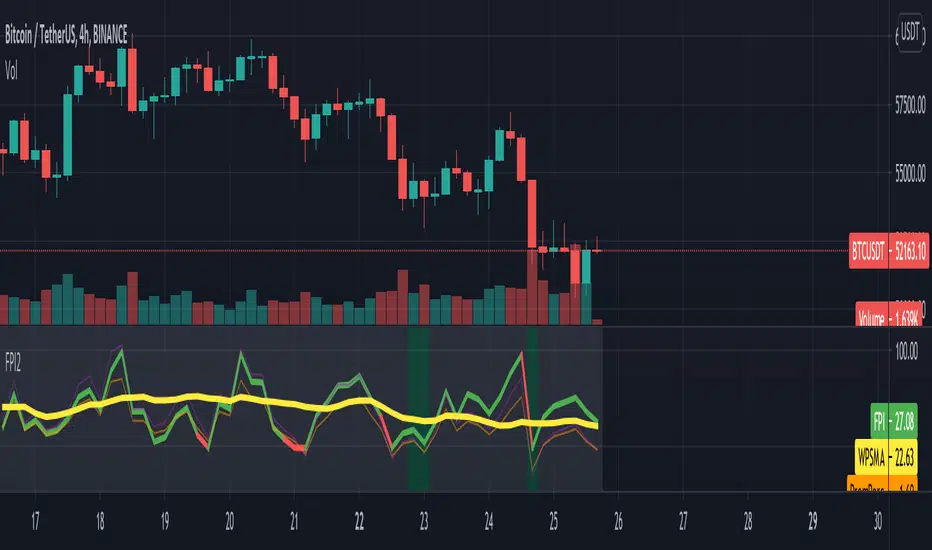
FuturesPremIndex V2Improving on the FPI version 1 , the following changes are incorporated.
1. The prices now use adjustable weighted averages for both spot and futures
2. The algorithm is improved for better normalization of data
3. The buy and sell zones are more precise with adjustable tolerance
Upcoming V3 would include , the FRI ( Funding rate index ) as well as even better targeting of the zones .
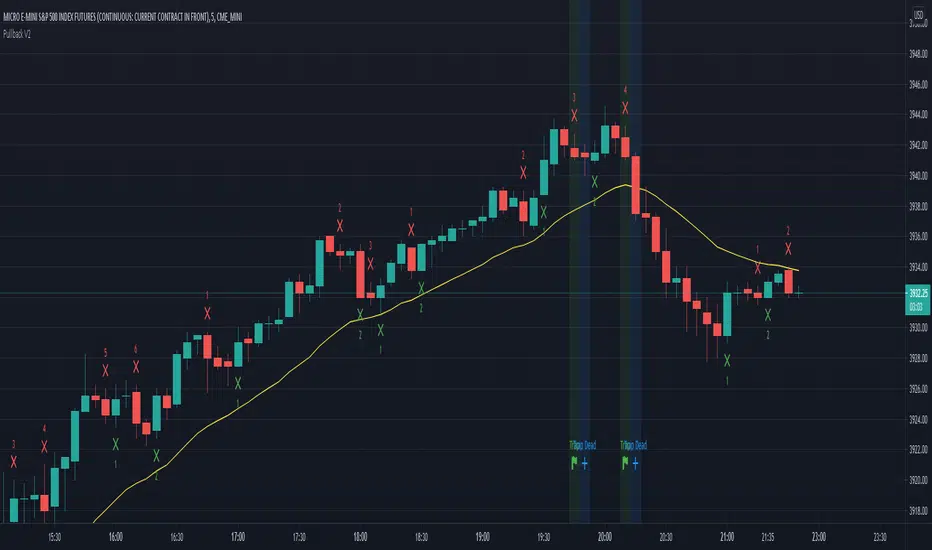
Pullback Traps v. 0.1Trading Strategy for scalping the CME_MINI:ES1! and CME_MINI:MES1! futures on the 5 min. time frame.
The strategy will count legs and look for failed pullbacks and failed second entries where shorters get trapped.
How to use:
When a trap occurs (Marked with green light) place an order one tick above the high of the trap and enter on next candle
If entry doesn't happen on next candle and it has a lower high, move entry to one tick above high of that candle.
Keep doing the above until you enter or until a candle is marked with a blue light and the text Trap Dead.
If you see Trap dead and you haven't entered, quickly cancel your order.
What is green light?
A second or later pullback down away from the uptrend. When the green light is present the shorters haven't made a 1 point profit and short scalpers are trapped.
What is blue light?
1. Shorters made their 1 point profit and trap is dead. Cancel your trade. Or...
2. Shorters hit their stop loss and you're probably in a trade now and about to profit.
Profit and stop loss:
Numbers are done with profit 5 ticks and stop loss 30 ticks.
Should I have a stop loss 6 times greater than profit?
Probably not. The numbers you see here are made with these profit and stop loss figures but I don't advice it in real trading.
The numbers look good on this backtest but in reality a few bad trades would ruin everything.
This was made purely for fun and sim trading - Feel free to do your own testing and show the resulsts.
MS POIVThis indicator was introduced by Larry Williams in 2007 and is very similar to the well known OBV indicator.
As such, it should be examined for convergence and divergence with the price trend. The interpretation can be done using the Wyckoff principles.
* Price rises, POIV stays behind => no subsequent demand
* Price meets resistance, POIV reaches new highs => supply (distribution) in the background
* Price and POIV rise synchronously => price trend is intact
These statements can of course be applied correspondingly to falling prices.
Larry Williams wrote for explanation:
Despite the problem, volume indictors have proven their worth, but while it is
a good idea to watch the cumulative flow of buying and selling pressure, you
should not assign all of this buying and selling to bulls and bears. Combined
with other concepts, such as keying off the open, we can focus on something
more germane to trading based just on volume, or what some might consider
related volatility indicators, such as daily ranges.
Futures traders can consider at least one solution to this problem: open
interest. Open interest is the number of outstanding contracts in a particular
market. (...))
The formula is calculating the cumulative sum of open interest times the net
change in price, divided by the true range. We then add the OBV value to this
cumulative sum.
So we first take the net change in price (today’s close minus yesterday’s close)
to get a percentage of where within the range the close was. Not all of the
activity will be buying or selling; the market “tells” us what percentage of
open interest goes to the buy or sell side.
Not only that, it also means we are incorporating price and trend change into
the formula.
(...)
One note of warning is necessary. The Williams POIV AD is a specific formula
that compensates for the close within the range relationship, as well telling
us how much OI to use, but it is an indicator, not a trading system. In
practice, it is useful to confirm a trade or to focus attention on a potential
trade. It is not intended to stand as the sole reason to initiate a position
in the market.

GG ES Scalp IBTT Momentum Strategy v1.0Script for Scalping the ES. Apply it to a 15 second chart. The Momentum Multiplier is a float input and the lower the number the less conservative the strategy is. It doesn't fire signals everyday but its pretty accurate. Send me a message to get access.
CME_MINI:ES1!

BTC Futures Premium IndexThe script collects data from various Futures and Spot prices and creates an index which identifies buy and sell zones . When combined with Open interest , this tool can be invaluable in making critical decisions .
Good Luck and I would request a like if you can spare that click :)
Thanks in advance and Happy Trading

Keltner + RSI Bitcoin Futures Trading [luca_badoer]This indicator combines the power of the Keltner channel with the power of the Relative Strength Indicator (RSI). It can help understand when the market is entering a bullish or a bearish trend.
Normally a Keltner channel would reference an Exponential Moving Average (EMA) of the price. In this case the Keltner Channel in the "Keltner + RSI Bitcoin Futures Trading " references the EMA of the 14-day RSI (white line). On top of that it overlays a 7-day RSI line (blue line). This produces some signals that are particularly useful in 2h, 4h and 1 day charts. The signals consist in the 7-day RSI line (blue line) crossing the upper (green) or lower (red) Keltner channels as well as the middle (white) line. Depending on the direction of the crossing (up or down) and the RSI level (from 0 to 100) at which the crossing takes place this produces bullish or bearish signals.
Examples:
- Bullish crossing: 7-day RSI (blue) crosses both the lower (red) and middle (white) lines upwards at a low to neutral RSI level (<70%)
- Bearish crossing: 7-day RSI (blue) cross both the upper (green) and middle (white) lines downwards at a high to neutral RSI (>30%)
Recommendations:
- Better to use it in 2h, 4h, and 1-day charts, thought it can also be used in lower timeframes. Confirmations of crossings in higher time-frames provide more certainty about the direction of the move.
- Use in combination with Heikin Ashi candles and volume indicators.

ADX Momentum cross + MacD + HH LL + Buy/Sell Signals and alerts Hello, This is the first indicator I have made and would like to contribute to the community.
This strategy came from trying to replicate a previous ADX Cross Indicator that I loved on MT4 which I used successfully on EUR/USD on high and low time frames. Through the process of trying to replicate it I failed, I decided to take what I had written so far and create my own ADX cross strategy using the combination of 3 ADX's, their lag. Then also using Higher highs and lower lows with the MacD to further filter the signals.
There are two buy and two sell conditions , the difference between these are just the order in which the ADX crossing determines the entry. The MacD and higher highs and lower lows are the same for filtering the signal.
You can change the look back for HH and LL look back range, along with the DI Length & ADX Smoothing for all ADX's. The lag used for either the buy or sell strategy with the Lag_Buy/Lag_Sell inputs. Lag_mid setting will affect all 4 conditions.
From testing and based on the ADX cross logic you should follow this structure when changing the inputs for:
DI Length: Lowest DI value (I.E. 1)
DI Lengtha: Middle DI value (I.E. 2)
DI Lengthb: Highest DI value (I.E. 3)
ADX Smoothing: Lowest Smoothing value (I.E. 1)
ADX Smoothinga: Middle Smoothing value (I.E. 2)
ADX Smoothingb: Highest Smoothing value (I.E. 3)
I tested this on the EUR/USD, but mainly I have been using it on BTC/USDT(binance) and BTC/USDT Perpetual futures(binance) with the 5 minute chart. I suggest playing around with the settings depending on the Symbol and timeframe you use because the default settings are what I last found to be optimal for my self on the 5min BTC/USDT Perpetual futures(binance) chart.
A good starting point I found when using the indicator on other charts is to use the below values:
DI Length: 7
DI Lengtha: 14
DI Lengthb: 21
ADX Smoothing: 7
ADX Smoothinga: 14
ADX Smoothingb: 21
If you have any questions, suggestions, or requests for this indicator feel free contact me. You can either comment on here or Message me
If you like this indicator please like and comment where you found it useful.

(D7R) FTX Bitcoin FuturesFTX Contract Futures Price with 3 different value display modes. (Percentage, Delta, Absolute).
This information can be used to understand when futures are trading at relative strong premium or discount against each other.
This information can either be used for hedging or price speculation when difference between contracts offer that arbitrage.
