Session Levels - Ultimate Range IndicatorSession Levels - Ultimate Range Indicator
Primarily developed for trading the E-MINI Futures Markets like NQ or ES from the CME Group,
but also more than suitable for Crypto or other instruments.
This indicator highlights the chosen session, which can be Globex, Asian, London and New York.
It plots the important levels and also renders the Opening Range as it forms (a.k.a. Initial Balance).
After the 1st hour Opening Range is finished, it can plot the Standard Deviations / Projections.
See below for a complete feature list.
All Opening Ranges on chart and for the New York session the Range Projections are turned on:
s3.tradingview.com
How to use (example):
If you are trading the Nasdaq Futures (NQ!)
Enable the Globex Overnight session. Basically in the Futures Market, the Globex session is everything outside of US trading hours of Stocks. This draws the important overnight levels, like the Low, 25%, 50%, 75% and the High.
Enable the New York Session with Levels and Opening Range. Generally, 70% of the time the 1st hour will put a Low or High of the day.
If the price is trading above the Globex Low, most likely the Low of the Day is formed and the price target for the day will be 1.5x Standard Deviation and 2x Standard Deviation.
[*} Deviation of the Initial Balance depends on the volume ad overall market structure.
** This is not financial advice or any guarantee **
Features:
Show each Session Highlighted on Intraday chart in it's own color (each session can be turned off and has customizable times and color)
Show Line Levels of each session: Low, 25%, 50%, 75% and the High (customizable color)
Show the Opening Range (Initial Balance) of the Asian, London and New York session. Note: NY has more options.
Opening Range is displayed as a box with level lines (customizable color)
Levels are drawn to the end of the NY Cash session (customizable time)
Show IB Standard Deviations 0.5 - 3.0. Calculated from the Opening Range (Initial Balance)
Option to display Higher Timeframe levels: Previous Day Open/Close and Previous Week Open/Close
All level lines and OR boxes size dynamically as the session progresses
Built in Alerts for when price hits key levels. e.g. Alert when price crosses the NY Opening Range High. Or an Alert when the first STDEV is hit.
Option to toggle display of drawings for Today's trading session only, or Show all recent session levels. This keeps the chart clean or not.
Extras:
The NY Opening Range also has a 50% level line
The NY Opening Bar can be highlighted separately
The Level Lines can have small labels turned on/off. Values are only shown on mouse over to keep a clean chart
Keep in mind:
1) This indicator works on all instruments, but on instruments with limited market hours, your chart setting
has to be set to "Extended Hours" otherwise. For example TSLA on NASDAQ.
2) The Exchange Time Zone for the CME Group is Chicago UTC-6. So the session times you configure in the settings menu are based on that timezone too.
3) Globex opens at 5pm CST and closes when the US session starts 8:30CST.
4) When enabling the Alerts in the Indicator settings, be sure to also create an alarm for this indicator using the Alarm function of Tradingview.
Futures

BTC Futures BasisShows various basis percentages in a table and plots historical basis. Also has an alert function for backwardation events. Useful for tracking bullish/bearish sentiment in BTC futures markets.
*Currently displays March and June futures for the following exchanges: Bitmex, Binance, Deribit, Okex, and FTX
Also displays CME Continuous Next Contract. All of the symbols are customizable.
-----------
Market-wide backwardation usually occurs during a heavy sell-off (such as a liquidation cascade).
**For getting alerts of backwardation events, I recommend creating an alert on the 1 minute chart with the condition "Any alert() function call". Alert level is customizable as well.
-----------
*NOTE!! : Futures contracts expire (obviously), so the contract symbols will need to be updated periodically. I will try to keep them updated going into the future.
**NOTE2!! : The alert() function does not track the CME contract. This is to avoid false triggers.

Market StatsThis script escapes much of the subjective technical analysis and discretionary trading in general. With this Script/Indicator, you will be able to have access to the statistics tested day by day in the markets, statistics that will be a decisive support in your trading plan. Its analysis and creation is based on the quantitative trading system, since these statistics have a testing and database behind, which makes it a potential indicator for your trading.
You can change the time of the market you want to operate, also the colors of the labels of the statistics, their distance, color of the letters, fully editable to adapt it to the type of market you operate.
Its design involves values of the previous session ( RTH ) and extension session (OVERNIGHT), so it will be complemented with markets that are assimilated to that configuration (indices, stocks, futures, CFDs, forex, commodities ) maybe you can adapt it with cryptocurrencies, but being 24/7 you would have to modify its schedule.
Important levels included:
YHOD: Yesterday High of Day
ONH: Onvernight High
ONM: Overnight Mid
YPOC: Yesterday Point of Control
HALFGAP: Close Price Mid
GAP: Yesterday Close Price
ONL: Overnight Low
YLOD: Yesterday Low of Day
IBH: Initial Balance High
IBL: Initial Balance Low
The IBH and IBL levels will appear after 60 minutes into the session, indicating our balance zone. The one that will add more statistics to our trading.
_________________________________________________________________________________________________________________________________________________________________________________________________________
Este script, escapa mucho del análisis técnico subjetivo y del trading discrecional en general. Con este Script/Indicador, podrás tener acceso a las estadísticas testeadas día a día en los mercados, estadísticas que serán un apoyo decisivo en tu plan de trading. Su análisis y creación se basa en el sistema de trading cuantitativo, ya que estas estadísticas, tienen un testeo y base de datos por detrás, lo cual lo hace un indicador potencial para tu trading.
Podrás modificar el horario del mercado que quieres operar, también los colores de las etiquetas de las estadísticas, su distancia, color de las letras, completamente editable para que lo adaptes al tipo de mercado que operas.
Su diseño implica valores de la sesión anterior ( RTH ) y sesión de extensión (OVERNIGHT), por lo que se complementará con los mercados que se asimilen a esa configuración (índices, acciones, futuros, CFDs, forex, commodities ) quizás lo puedas adaptar con criptomonedas, pero al ser 24/7 habría que modificar su programación.
Niveles importantes incluidos:
YHOD: Yesterday High of Day
ONH: Onvernight High
ONM: Overnight Mid
YPOC: Yesterday Point of Control
HALFGAP: Close Price Mid
GAP: Yesterday Close Price
ONL: Overnight Low
YLOD: yesterday Low of Day
IBH: Initial Balance High
IBL: Initial Balance Low
Los niveles de IBH y IBL, aparecerán después de 60 minutos iniciada la sesión, indicando así́, nuestra zona de balance. La que agregará más estadísticas a nuestra operativa.

NCTA Aurora SystemAurora System
This system is designed to present a simple view of trending signals. The signals within the Aurora System will alert the beginning of a possible new trend. The signals also indicate when a trend is continuing or weakening, which advises the trader to adjust their stop or exit the trade. If the trend resumes, the system will print a new confirmation of an entry.
When traded properly, using a 2-3 timeframe alignment, the system will display both trending trades, which anticipate a potentially longer move, or catch trades which are likely shorter moves, which at times may be counter trend, so traders will be looking for a smaller profit.
There are two settings, CXA and PBA. CXA is more sensitive to triggering possible entries while PBA is more conservative. The system will display on the indicator which “mode” is set, CXA or PBA.
How to Use:
When the first red bar appears, labeled with a “S”, go short. This is indicating the start of a possible short trend.
When the first blue bar appears, labeled with a “L”, go long. This is indicating the start of a possible long trend.
White bars indicate a neutral or no trend.
This system can be used individually on a single time frame, but reduces chop and noise when used on a combination of time frames such as an alignment between the 3 minute and 10 minute chart for intraday trading.
3 Minute and 10 Minute Alignment Example:
For example: When the 10 minute PBA signal appears (Red bar with “S” or Blue bar with “L”), monitor the 3 minute chart for a confirmation of that signal (Red bar with “S” or Blue bar with “L”) and enter based on the 3 minute chart
At times, the 10m will first print when the 3m is on a retracement. It may take another 3 - 6 min before the 3m signals a valid entry
Exit when 10m PBA signal stops (could be a white bar or just a blank space on the indicator)
Next Bar Alert:
Included is an optional "Next Bar Alert" setting. Since many of these signals benefit from very prompt action at the beginning of a price bar, there is an additional option in Settings to set an arbitrary number of seconds to be alerted before the next price bar opens. Simply set this to a level you prefer, then set an alert in TradingView on the indicator using the "Next Bar Alert" alert parameter.

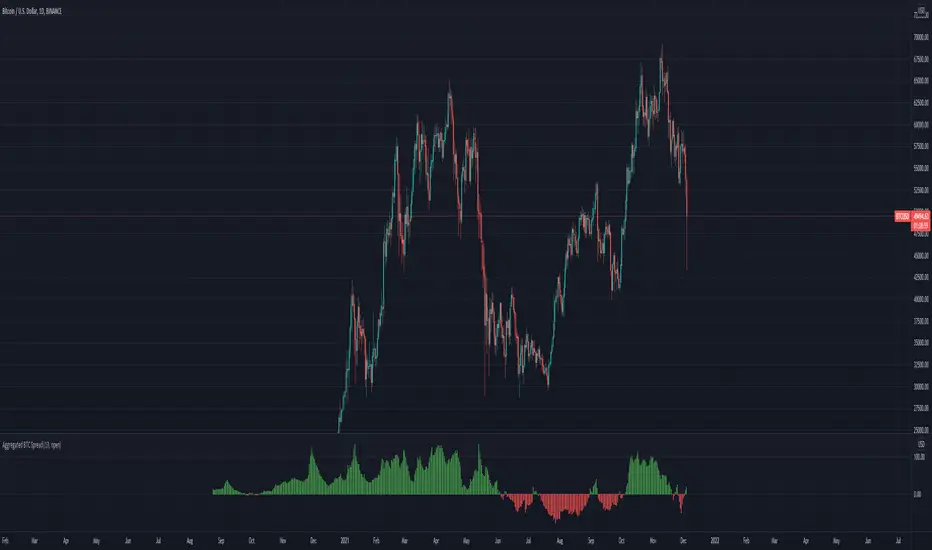
Aggregated BTC SpreadThis script is used to aggregate the bitcoin spread on futures contracts on different platforms.
It works by averaging the for every selected exchange, and apply an EMA of .
It is supporting
Binance (USD / USDT)
Okex
FTX
Huobi
Deribit
Ascendex
CME (BTC1!)
[Fedra Algotrading Strategy Futures Signals]Linear Regression + Take Profit and Percentage Stop Loss
Optimize the parameters in backtesting to find the best entries, define your profit and risk strategy, take advantage of statistics and make trades without letting the psychological factor make you commit mistakes.
The strategy chooses the time to buy when the price breaks down the deviation of the linear regression calculated on the basis of the last lows prices and allows you to generate alerts.
It also includes an emergency exit at Break Even (1.5%) when it detects a negative trend in the short term.
It also has an advanced trend filter to avoid opening trades against the market.
*************************************
Regresión lineal + Take Profit y Stop loss porcentual
Optimice los parámetros en backtesting para encontrar las mejores entradas, defina su estrategia de profit y riesgo, apreveche las estadísticas y haga operaciones son dejar que el factor psicológico le haga cometer errores.
La estrategia elige el momento de compra cuando el precio rompe hacia abajo la desviación de la regresión lineal calculada en base a lows últimos precios y permite generar alertas.
También incluye una salida de emergencia en Break Even (1.5%) cuando detecta una tendencia negativa en el corto plazo.
Tiene también un filtro avanzado de tendencia para no abrir operaciones en contra del mercado.
Stochastic DotsThese Stochastic Dots can help show potential turning points and cycles in the market.
- The smaller dots are based off of a faster moving stochastic
- The bigger dots are based off of a longer moving stochastic
- Dots below the candle/bar are bullish
- Dots above the candle/bar are bearish
This indicator is not meant to be traded by itself. Use other forms of confluency and confirmation with it.
If you're interested in more customized indicators to suit your needs, feel free to message me.
Confluence CandlesThis indicator looks for confluence among three indicators (RSI, Stochastic, and MACD), a strategy popularized by Markus Heitkoetter in his book, “The PowerX Strategy: How to Trade Stocks and Options in Only 15 Minutes a Day”, and expands it to look for agreement on up to four symbols.
Each indicator is configurable in the settings, as well as the ability to choose which of the indicators are used.
Default Logic
Green Candles
RSI > 50
Stochastic > 50
MACD Histogram > 0
Red Candles
RSI < 50
Stochastic < 50
MACD Histogram < 0
When multiple symbols are selected, the above needs to be true for all selected symbols.
Example Use Cases
- Setting the indicator to the Nasdaq 100 (QQQ or NQ1!) while trading a stock that is part of that index such as AAPL or TSLA
- Setting the indicator to multiple indexes that tend to move together in order to trade one of them since they tend to make stronger moves when moving together (ex. SPY & QQQ, or ES1! & NQ1!)
- Setting the indicator to Bitcoin while trading a smaller crypto pair that moves as a sympathy play.
Tip
If you have trouble finding the full name for a specific instrument from an exchange such as BTCUSD from Coinbase, you can bring up TradingView’s “Symbol Search” pop-up modal, enter your search term, use the down arrow key on your keyboard to move the focus to the symbol you want, and you will see the full name in the search field such as “COINBASE:BTCUSD”.

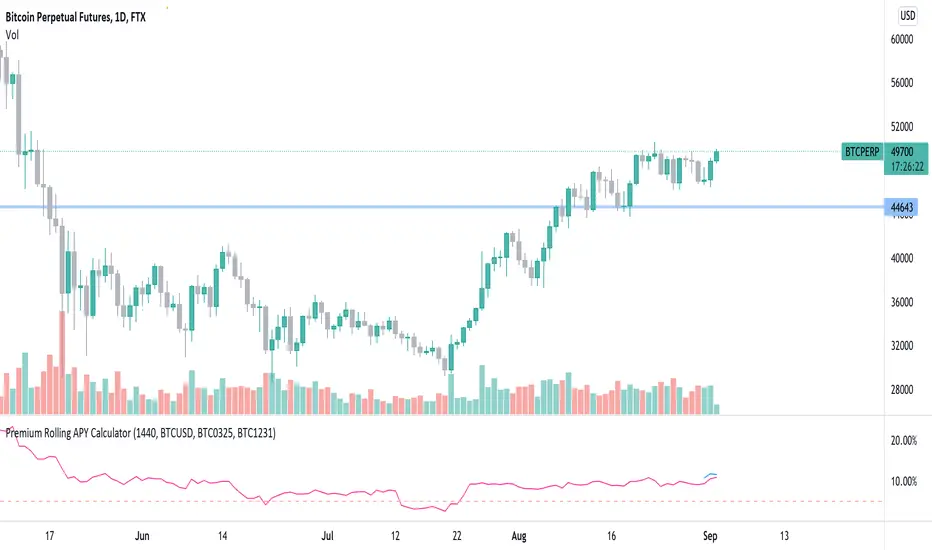
Premium Rolling APY CalculatorThis script can see the rolling APY of future premiums calculated based on the remain days to expire date.
By default you can see the rolling APY for FTX BTC0924, and APY for BTC1231. You can also change the symbol from chart settings to whatever you need and still calculate in the same way.
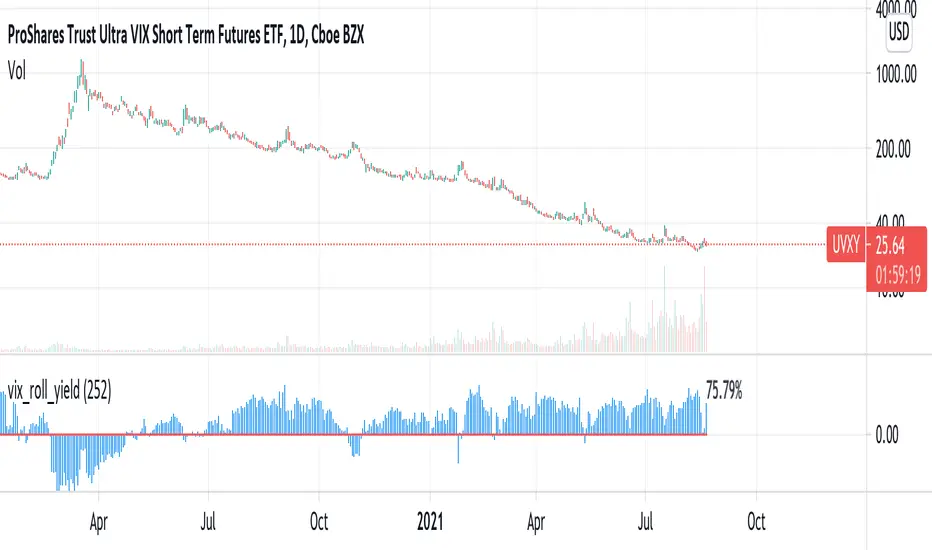
vix_roll_yieldShows the roll yield of the VX futures, which is the ratio of a continuously weighted average of the front two months to the VIX. The VX (VIX futures) contract expires on the third Tuesday of each month. On the next trading day, the front month will have full weighting, and the second month will have no weight. On the expiration day, the back month will have full weighting and the front month will have no weight. In between, the weight gradually shifts.
This weighted average is similar to the SPVIXSTR index that UVXY and several other funds track. When the average is below the VIX, the indicator is negative, and the front month contract will tend to gain value relatively more rapidly than the back month as it converges upward to the VIX spot price. Because funds whose NAV is tied up in VX contracts continuously roll from the (typically cheaper) front month to the back, in situations where the front month is more expensive than usual--or even more expensive than the back month--these products may have a "tailwind". In this case, they are selling expensive front month contracts to purchase cheap back month contracts.
Ordinarily, VIX funds have a "headwind." The roll yield is positive, the front month is cheap, and the back month is expensive. Day by day the funds sell cheap front month contracts and buy expensive back month contracts, which, in turn and over time, become the front month and converge with the VIX, losing value rapidly. This is a brief explanation about the decay of these products.
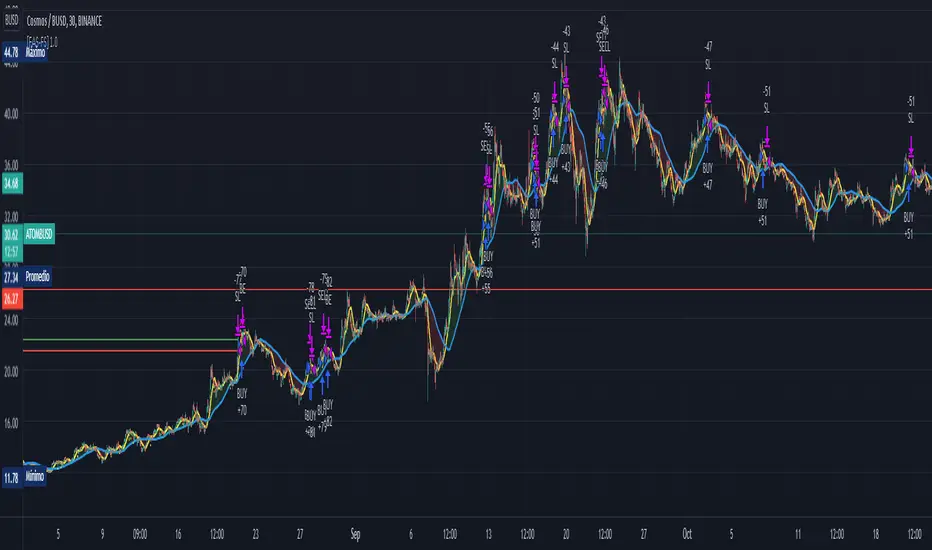
RaBot V1.0.0Rabot is an indicator for new users as well as experienced users.
This indicator tries to predict both buy and sell signals. You can configure it for both scalping and swing trading.
It has two modes, one more "conservative", where the number of entries will be less than the other "greedy" mode.
Based on the famous and complex indicator "Koncorde" that combines both trend and volume knowing the manipulation of strong and weak hands, patterns, and crossing of emas customized by us; for example: a buy signal in conservative mode will only open if the trend is bullish and vice versa.
The user can configure the way they like by opening many positions or few but more secure based on their trading style.
The indicator also has the option to configure which chart we want to obtain the trend from, this is to avoid perhaps opening shorts in a very bullish trend line for example.
Rabot is a fairly complex indicator, which can be used for automatic use of inputs and outputs, as well as manual.
You also have the option of NOT opening a position if there is one currently open, and the option for the next signal to be the opposite of the last one.
5TPs, 1SL, and Breakeven after take profit achieved.
Finally version 1.0.0 is now available! :)
This version does not have backtesting (we have another that yes)
We are continuously working, testing and updating bugs and improvements.
Do not hesitate to get in touch for a feedback, it will be welcome and we will take it into account.

RaBot V1.0.0 - BacktestingRabot is an indicator for new users as well as experienced users.
This indicator tries to predict both buy and sell signals. You can configure it for both scalping and swing trading.
It has two modes, one more "conservative", where the number of entries will be less than the other "greedy" mode.
Based on the famous and complex indicator "Koncorde" that combines both trend and volume knowing the manipulation of strong and weak hands, patterns, and crossing of emas customized by us; for example: a buy signal in conservative mode will only open if the trend is bullish and vice versa.
The user can configure the way they like by opening many positions or few but more secure based on their trading style.
The indicator also has the option to configure which chart we want to obtain the trend from, this is to avoid perhaps opening shorts in a very bullish trend line for example.
Rabot is a fairly complex indicator, which can be used for automatic use of inputs and outputs, as well as manual.
You also have the option of NOT opening a position if there is one currently open, and the option for the next signal to be the opposite of the last one.
5TPs, 1SL, and Breakeven after take profit achieved.
Finally version 1.0.0 is now available! :)
This version contains backtesting with 5000 backbars to see if it is being profitable or not.
We are continuously working, testing and updating bugs and improvements.
Do not hesitate to get in touch for a feedback, it will be welcome and we will take it into account.

Trend Momentum with Buyers / Sellers PowerHi there!
With this indicator, you can hunt big trends before they start.
This indicator is combined with RSI and Momentum indicators
It can show you the power of trend and which side it wants to go
It can help you to open a position at the first point of a new trend or at the safe and proven point of the trend, also it can help you to close your position before the trend change its direction (it's not recommended to use it to close your positon, but sometimes it can help you to find the ending point of big pumps)
Rules:
* Baseline is ZERO ( 0 ) line
* When gray line crossover red line, it shows us a powerful uptrend
* When the gray line crossunder the red line it shows us a powerful upward trend
Signals:
* Only use Buy signals(Long) when they are above or crossing-up baseline
* Only use Sell signals(Short) when they are under or crossing-down baseline
* If they both (red and gray lines) are too high and they suddenly starting to come back to baseline, it shows we have a range trend, the trend is weak or a reversal trend is coming!!
!! WARNING: DO NOT USE THIS INDICATOR ALONE !!
Suggestions :
-Use 1H, 4H, daily, or Weekly timeframes
-Use ADX and DI or three WMA's
-Use divergence
-You can use it for scalping but you need to change the inputs (not recommended)
If you have any idea about making new indicators(what information do you want from the chart?), comment please, then I can research and make it for all of us! =)

Stock trending strategy This is a long only strategy designed maily for stock markets and futures. In general it works best with 1h, however it can be optimized with other timeframes as well.
Components:
VWAP
MACD histogram
EMA 9
Rules for entry
Long :
For VWAP: close is above the vwap daily
EMA: close is above the moving average
MACD histogram is above 0
Short:
For VWAP: close is belowthe vwap daily
EMA: close is below the moving average
MACD histogram is below 0
Rules for exit
This strategy does not have any risk management inside. Instead it exits whenver it receives an opposite signal form the original one used for entry.
If you have any questions let me know !

Ichimoku with MACD/ CMF/ TSIThis is a very powerful trend strategy designed for markets such as stocks market , stock index and crypto.
For time frames I found out that 1h seems to do the trick.
Components:
Ichimoku full pack
MACD histogram
CMF oscillator
TSI oscillator
Rules for entry
Long :
For Ichimoku:Tenkan part of cloud is bigger than kijun, Chikou is above 0 , close of a candle is above the Senkou
MACD histogram is above 0
CMF oscillator is positive and bigger than 0.1
TSI oscillator is above 0
Short:
For Ichimoku:Tenkan part of cloud is smaller than kijun, Chikou is below 0 , close of a candle is belowthe Senkou
MACD histogram is below 0
CMF oscillator is negative and below -0.1
TSI oscillator is below 0
Rules for exit
This strategy does not have any risk management inside. Instead it exits whenver it receives an opposite signal form the original one used for entry.
If you have any questions let me know !

MYX Malaysia Bursa Futures Derivatives Auto DetectThis indicator intended for Malaysia Market only for auto detect Futures Market Derivatives refer to Bursa Malaysia
Indikator ini adalah untuk pasaran Malaysia sahaja untuk automatik mengenalpasti Derivatif Pasaran Hadapan rujuk kepada Bursa Malaysia
Indicator features :
1. Able to detect futures market.
2. List similar symbol or counter including total.
3. Font size small for mobile app and font size normal for desktop.
4. Show date updated by Bursa Malaysia.
Kemampuan indikator :
1. Boleh mengenal pasti pasaran hadapan.
2. Senarai simbol atau kaunter yang terlibat termasuk jumlah.
3. Saiz font kecil untuk mobile app dan saiz size normal untuk desktop.
4. Memaparkan tarikh kemaskini oleh Bursa Malaysia.
FAQ
1. Credits / Kredit
LucF & PineCoders
2. Code Usage / Penggunaan Kod
Free to use for personal usage.
Bebas untuk kegunaan peribadi.
3. Why table overlap with chart ? To avoid this, click indicator > Visual Order > Send to Front.
Kenapa table bertindih dengan carta ? Untuk mengatasi ini, klik indikator > Visual Order > Send to Front.
4. Some symbols not display such as Commodities Derivatives (OCPO and OPOL) and Equity Derivatives (OKLI).
These symbol are offcially displayed at Bursa Malaysia but not available in Trading View under prefix MYX.
And also Futures Market are not available in Trading View.
Beberapa simbol tidak dapat dipaparkan Derivatif Komoditi (OCPO and OPOL) and Derivatif Equiti (OKLI).
Simbol berikut dipaparkan secara rasmi di Bursa Malaysia tetapi tiada di Trading View di bawah prefix MYX.
Dan Pasaran Hadapan juga tiada di Stock Screener.
All Setting enabled.
Semua seting diaktifkan.
Example of recommended usage.
Contoh penggunaan yang disarankan.
Example of other derivatives. Similar derivatives can be shown.
Contoh derivatif lain. Derivatif yang sama boleh dipaparkan

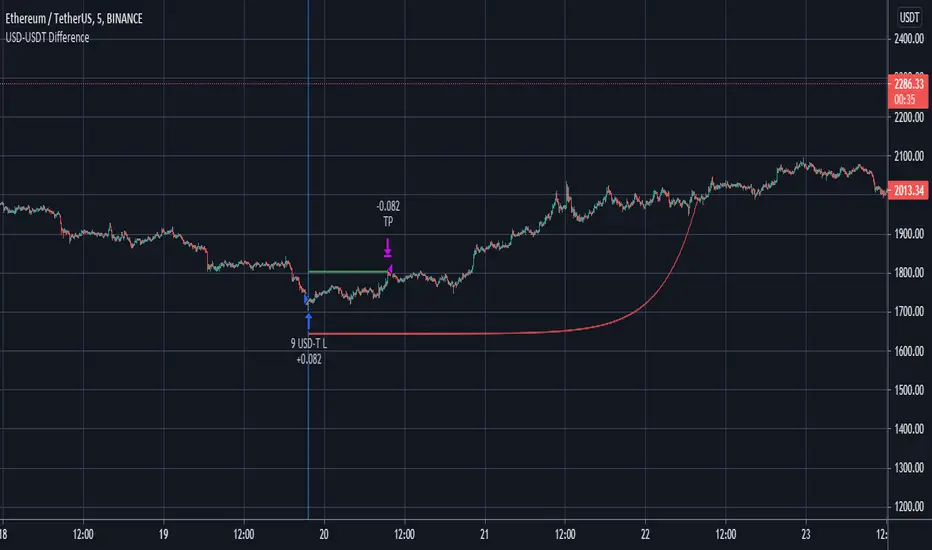
Futures Spot Difference Strategy by MoonFlag
This strategy compares the spot and futures value of a coin on a given exchange
If the 'Percent Difference' (See settings) is greater than a user specified ammount a blue (long) or green(short) line is put on the chart.
Default % difference typically varies from 0.2 to 0.7 depending on the coin and timeframe. On higher timeframes (1hour) a difference of 1.5% might be required to give good intermittent trade results.
I've chosen a USD-USDT comparison as default for ease of understanding. Note the futures coin goes onto the chart and the spot coin is referenced in settings. The bot works this way as the futures will typically extend beyond the spot price, not the other way around.
User can select if to include Long and/or Short trades.
The 'Trigger Only When Bar Complete' means that repainting should not be an issue if set to true. However, if set to false the strategy will enter a trade at the point in time when the percentage difference is met. This is useful with some coins as the futures coins price rapidly changes to realign with the spot price. It is however difficult to backtest this feature as backtests only consider the bar complete situation. I mostly use Trigger When Bar Complete = true, as a difference in the spot/ futures price is typically followed by a price shift trend over then next reasonable time period.
Timing is essential in this bot. There is a stop-loss however, this stop value is replaced by a exp ramp which has 3 variables (starting %, length, run-up). When the ramp is narrower to the price than the stop-loss the ramp takes over the stop-loss and this reduces losses. Also, there is an option to have the ramp take over the take-profit if the ramp betters the start-price (i.e. the trade is in profit). This is very useful for times when the price massively swings beyond the take-profit price as the exp ramp goes way up. The ramp also limits the time a trade will stay in position, unless the trades moves in tandem with the ramp. The ramp is the most useful feature I have for bots, I use it all the time.
So a difference between the spot and futures price - can lead to a trend establishing, so catch these with this bot. It works well on fast timeframes, 1m, 5m, 15m, and also is useful with the 1hour and similar.
Please get in touch to have this bot matched to any coin pair
Please do get in touch if you have any questions/suggestions.
Sincerely,
MoonFlag PhD
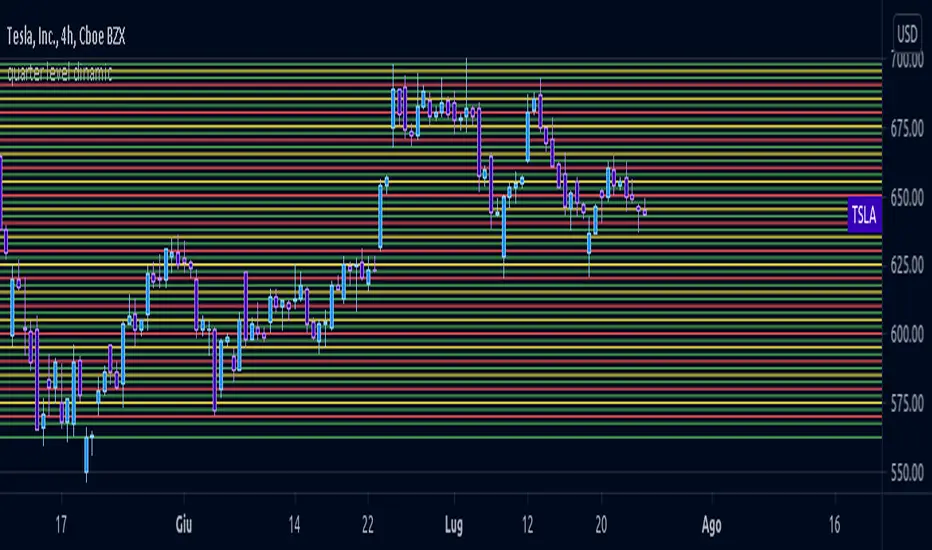
quarter level dinamicLimited quarter level script but more flexible in compared to my FX script, same logic behind
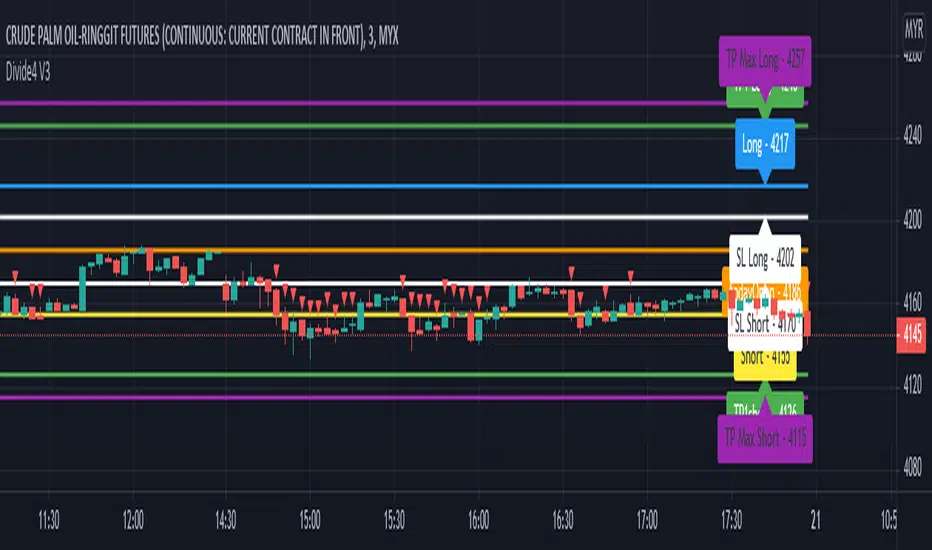
Divide4 V3This script is specially developed for the reference of Crude Palm Oil Futures (CPO) market traders.
Before using this script, traders need to know a few important things, namely:
1. Use of this script is limited to the Crude Palm Oil Futures (CPO) market only;
2. The appropriate time-frame for the purpose of using this script is a small time-frame, i.e. 1 minute to 5 minutes;
Procedures for using indicators.
1. Once the market opens, change the time-frame to 1 minute;
2. The line on the trading day will only be known after the first candle is completed, i.e. at 10.31 am;
3. Then, you can key in order if you want;
4. Let the 1 minute time-frame remain until 11 a.m. Then, you can change a larger time-frame such as 3 minutes or 5 minutes if desired.
Entry.
1. The recommended Max Entry is once Long and once Short only on the same day;
2. If the first Entry reaches Profit Target, it is not recommended to make an Entry for the second time;
3. If the first Entry is about Stop Loss, the second Entry is recommended as opposed to the first Entry.
For example, if the first Entry is Long, but does not reach Profit Target, otherwise it is about Stop Loss, then the recommended second Entry is Short, even though the price is about Entry for Long.
Long.
1. Traders can only make a purchase when the market price hits the blue line;
2. If traders hold a long position, traders can make a sale to close the long position when the price hits the green or purple line closest to the blue line;
3. On the other hand, if the price goes down again after a buy is made, traders need to make a sale to close the buy position when the price goes down to hit the white line closest to the blue line.
Short.
1. Traders can only make a sale when the market price hits the yellow line;
2. If traders hold a short position, traders can make a purchase to close the short position when the price hits the green or purple line closest to the yellow line;
3. On the other hand, if the price rises again after the sale is made, then traders need to make a purchase to close the selling position when the rising price hits the white line closest to the yellow line.
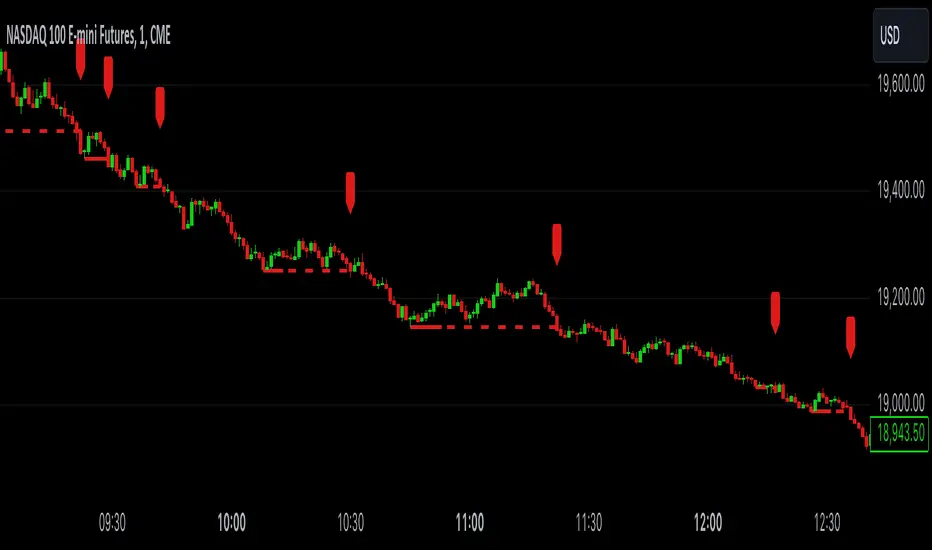
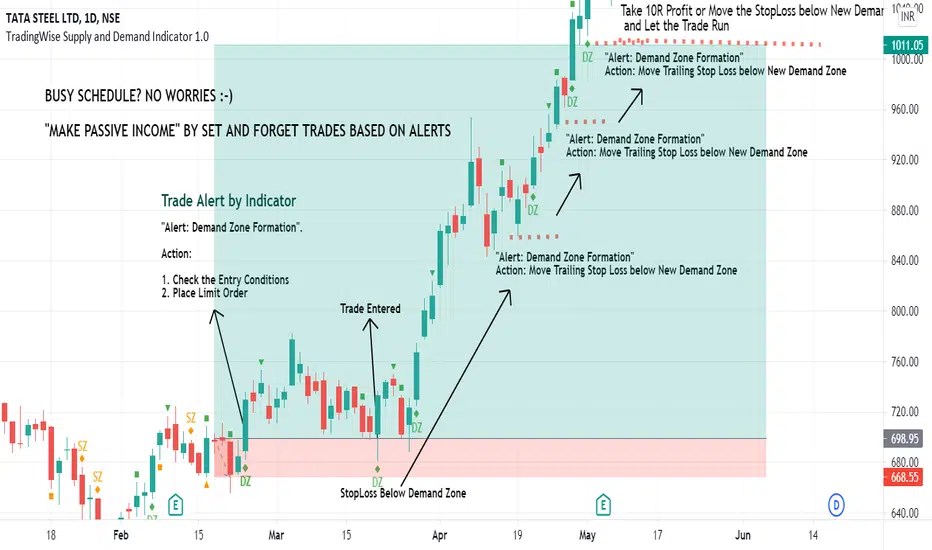
TradingWise Supply and Demand Indicator 1.0TradingWise Supply and Demand Indicator 1.0 is based on the Price Action candlestick patterns to identify the Supply and Demand zones in the charts (Areas of liquidity). It works on all Timeframes and Asset Classes. This Script helps the traders to identify the demand and supply zones with identifications on the candle stick patterns indicating the origin of the Strong move. Also it generates Alerts automatically once the supply or demand area is formed thus by reducing the hours spent on the charts and reducing the missed trade Opportunities as well. This Indicator is extremely helpful for those on Full time Jobs/ Busy Schedule.
Buy/Sell Alerts by Indicator:
Green Diamond + DZ Sign ---> Indicates the Demand Zone Formation. Place Buy Trade upon Entry Criteria Met
Orange Diamond + SZ Sign ---> Indicates the Supply Zone Formation. Place Sell Trade upon Entry Criteria Met
Binance Futures BasisCONCEPT
The futures basis for multiple coins based on the Binance coin margin quarterly futures contracts.
If you need a run down of what the futures basis is, check out this short educational post (click on the chart):
In short: the futures basis is the premium at which futures contracts are trading compared to the spot market.
FEATURES
Futures basis for the following coins:
BTC
ETH
LTC
BNB
ADA
DOT
BCH
LINK
There's also an average futures basis which is an average premium of all the coins I just listed.
As you can see there's also a zero line which you can turn on in the settings.
This is quite useful for when the futures start trading in or close to backwardation.
It's possible to show all the premiums at the same time.
This makes it easy to look for outliers.
You can choose the candle source too.
By default it's set on "close" which probably makes the most sense.
All data will be based on candle closes.
However if you're looking at higher timeframes sometimes crucial info is lost when you keep it on "close".
As you can see in this BTC futures basis example with "close" as a candle source you don't seen anything peculiar even though there were two violent liquidation cascades that temporarily had a huge impact on the futures basis.
If you then select "ohlc4" for example which uses an average value of each candle you can clearly see the impact that those drops had.
Basically when you're looking at most recent data I prefer candle close, but when looking at higher timeframes for historic data the ohlc4 option is more useful.
At the time of publishing this indicator it's using the September quarterly futures contracts (which is the closest expiration).
I'll update this every time the expiration happens.
However, in the settings you'll find the code for these futures contracts.
If you want to take a look at the next expiration for example, which is December right now, you can just fill in the Binance code of those contracts and it'll re-calculate everything and print the futures basis for the December futures.
This way you can also update the indicator yourself each time contracts expire (to make sure the indicator keeps working just in case I were to disappear or something).
The code for the current (September) contracts is U2021.
The code for the next expiration (December) is Z2021.
This will become out dated of course.
TRADING
You can find more info on how it's useful for trading in the educational post I linked.
Some short notes...
This premium works very similar to the perpetuals basis or funding.
Simply put a high premium could be a sign that the market is overbought and a very low premium could be a sign that the market is oversold.
Backwardation (below 0) is very rare and usually only happens after a violent crash. Historically those are good buying opportunities.
Divergences also often work really well.
If you want access send me a private message so we can discuss it.
Cheers.

CryptoKillerCryptoKiller is a trend following trading system. It provides entry and exit points, a money management system and a trade management system.
The entry points (fuchsia line) are determined by CryptoKiller Oscillator (see other published script to understand how the oscillator works).
The trade management system provides the exit points in profit and in loss. This script works with multiple take profits (green lines), the initial position is liquidated little by little as the trend reaches the profit targets. Trade management also provides trailing stop exits to save the remaining profits.
Stop loss (red line) take into account the recent past of the chart to be determined, while take profits are fixed and have been calculated based on historical volatility.
The money management system is very simple, it plans to enter a position with a fixed percentage with respect to equity.
CryptoKiller, during an operation, also draws supports and resistances on the chart - determined by the oscillator (orange lines) these supports and resistances are used as a filter to understand where there is the greatest probability of trend development (some entry points provided by the oscillator will therefore not be considered by CryptoKiller as entry points, as in disagreement with the traced supports / resistances).
We know that an error appears in the backtest calculation, where the script is said to suffer from a bias, so the backtest calculation may not be accurate. Actually this happens in high times like H4 or daily, but CryptoKiller is not designed for these timeframes. it is a short-term strategy.
For more information read the author's instructions to contact us, we will send a PDF file with a more complete explanation of the strategy accompanied by screenshots.
Access to this script is granted along with access to CryptoKiller Oscillator.
Aggregated Futures BasisCONCEPT
An indicator that shows you the futures basis, which is the premium that classic futures contracts are trading at compared to the spot market.
By default its settings are for bitcoin quarterly contracts (closest expiration date), although there's a lot of customizing possible.
You could also use this indicator for other coins but then you'll have to change the inputs.
I'll manually update the contracts when they get close to expiration, but you could do this yourself as well (just in case I disappear for some reason and don't update it anymore).
For more info on what the futures basis is exactly check out this short educational post (click chart):
FEATURES
As previously mentioned, the default settings are for bitcoin.
The index used is the Bitmex BXBT index. It's a dynamic and volume weighted spot index which is perfect to get an average price of the spot market.
If you want to look at the ethereum futures basis for example then I suggest using the BETH Bitmex index, same concept as the BXBT chart but for ETH.
The futures used are quarterly contracts of the most prominent exchanges in crypto.
There's also an option to add an average plot (or only show the average: use the selection box) which calculates the average premium of all the futures contracts selected (you can also choose to exclude certain contracts).
The standard settings show you the premium in percentage terms, but there's also an options to show the annualized premium.
If I don't update the indicator when the contracts expire you'll have to fill in the tickers of the next quarterlies and you'll also have to change the expiration date to make sure this annualized premium still works.
There's a "zero line" you can add which is useful for when the futures get close to backwardation.
And you can set up bullish and bearish signals of your choosing. By default it shows a bull signal when the premium goes below zero and a bear signal when the premium goes above 10 (if you put it on annualized you'll want to change this threshold).
TRADING
The futures basis can be very useful to gauge market sentiment.
It can give you a better idea of how aggressive market participants are by looking at how much the futures are going up or down relatively to spot.
Divergences also often have an impact.
If you want access to this indicator send me a private message so we can discuss it.
Cheers.
