Specific Date Series (llnylk's)Show specific dates/bars (useful for Ichimoku cloud) Show where are -9th bar, -20th bar, -26th bar, -52th bars in the pastPenunjuk Pine Script®oleh llnylk1117
ICHIMOKU Crypto Swing StrategyThis is a crypto swing strategy designed for timeframes bigger than 1h. The main components are ICHOMOKU KDJ Average High Average Low Rules for entry For long: we have the ichimoku crosses between tenkan and baselines, we have a rising kdj line and at the same time we have a increase in the average high For short: we have the ichimoku crosses between tenkan and baselines, we have a falling kdj line and at the same time we have an increase in the average low Rules for exit We exit when we have inverse conditions than the initial ones used for entry. Caution This strategy does not use a risk management, so be careful with it ! If you have any questions let me know !Strategi Pine Script®oleh exluxTelah dikemas kini 33354
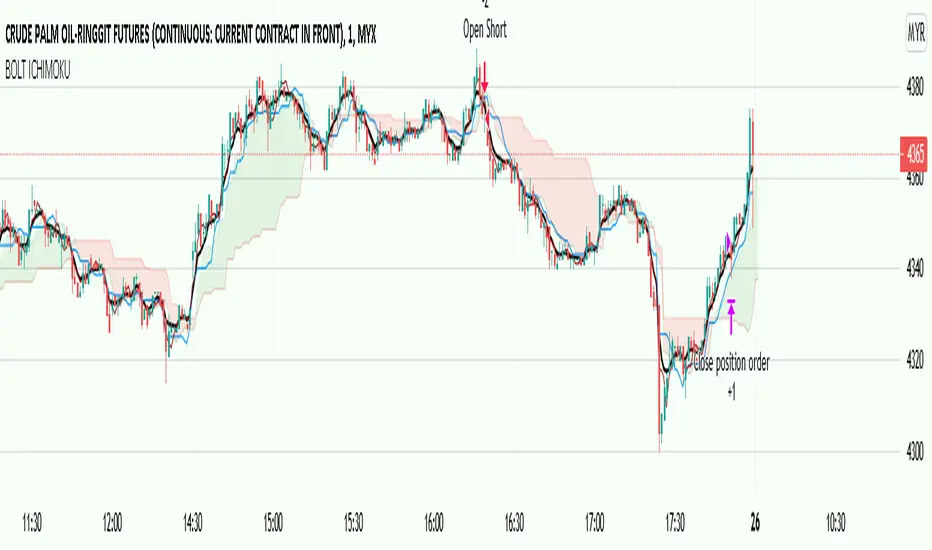
BOLT ICHIMOKUThis strategy is based on custom ichimoku cloud to be used best in 1 minute time-frame. The buy and sell condition must met 3 conditions before it is legit. The strategy backed by ichimoku cloud for initial trend identification, RSI for momentum bias and EMA for major trend bias. Currently, only tested in Futures Crude Palm Oil (FCPO) market. Maybe can be used in other different markets, user have to test it by themselves. User can toggle/enable the stop-loss and take-profit value at the bottom of the settings. Strategi Pine Script®oleh ShukAzriy114
BOLT ICHI M1A no cut-loss strategy based on custom ichimoku cloud to suit 1 minute timeframe strategy for FCPO market. However, there is a toggle button to enable stop-loss and take profit at the bottom that based on money value (RM) not tick count. Strategi Pine Script®oleh ShukAzriyTelah dikemas kini 23
Ichimoku Cloud Strategy IdeaThis strategy idea uses the famous Ichimoku Cloud (Forward-shifted SMA-9 and SMA-26) and Chiku (52-candle lagged close price) with its default parameters. This strategy is slow and issues few signals. However, this is one of the most performant long-term trend trading strategies. It usually works well on 1D and 4H timeframes and even better on trending instruments. This is the implementation used in QuantCT app. You can set operation mode to be Long/Short or long-only. You also can set a fixed stop-loss or ignore it so that the strategy act solely based on entry and exit signals. Trade Idea When both close price and chiku are above the cloud, market is considered rising (bullish) and the plotted cloud becomes green. When both close price and chiku are below the cloud, market is considered falling (bearish) and the plotted cloud becomes red. Otherwise, market is considered ranging and the plotted cloud becomes orange. Entry/Exit rules Enter LONG right after both close price and chiku went above the cloud (i.e. when the end of the plotted cloud becomes green). Enter SHORT right after both close price and chiku went below the cloud (i.e. when the end of the plotted cloud becomes red). EXIT market when close price enters the cloud. CAUTION It's just a bare trading idea - but a profitable one. You can enhance this idea and turn it into a full trading strategy with enhanced risk/money management and optimizing it, and you ABSOLUTELY should do this! DON'T insist on using Long/Short mode on all instruments! This strategy performs much better in Long-Only mode on several instruments (Like BTC , ETH, etc.), and also performs better in Long/Short mode on other instruments (Like VET, BNT, etc.). Strategi Pine Script®oleh QuantCT55228
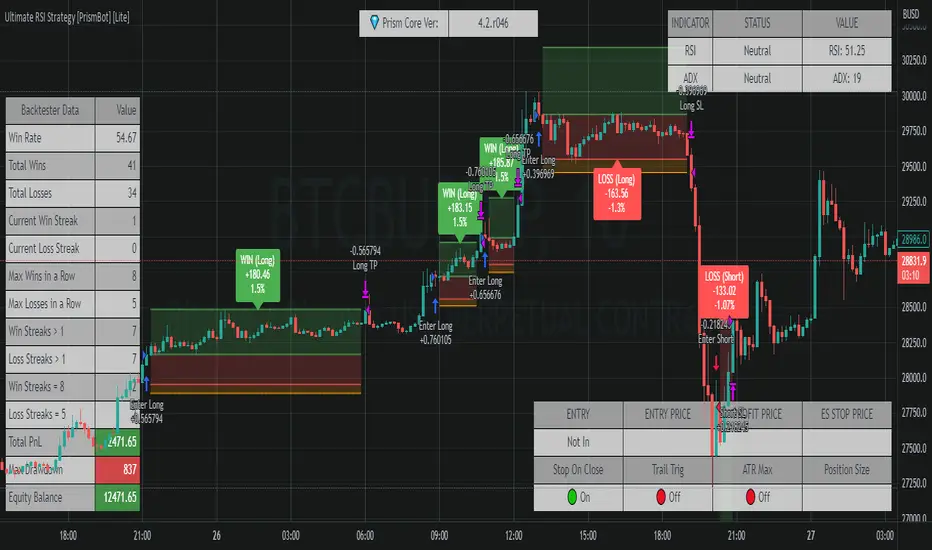
Ultimate RSI Strategy [PrismBot] [Lite]Included in this Ultimate MACD Lite Strategy: ✔️ Tweak a multitude of specific settings (MA lengths, R:R, SL distance etc) ✔️ Enable advanced setup filters ✔️ Use money management and risk calculations ✔️ Draw trade info directly to chart (eg. SL size in percent, win rate etc) ✔️ Use various filters (eg. time filter, date filter, MA slope angle etc) ✔️ Manage risk per position when auto-trading forex through AutoView ✔️ Choose from various alert conditions! ✔️ Sync to any bot or algorithmic trading system Some details about this strategy: There are several strategies that people use for the RSI , and one of my favorites is very different than one you have probably heard from every online RSI strategy source. In order to compliment the RSI , there is also a built-in ADX / DMI strategy (per our All-In-One strategy on my profile as well) and you will also find a Global Trend filter (200 EMA by default). You can also use a pullback confirmation prior to a trade entering. I.E., you have the RSI signal, wait for a pullback to the pullback EMA , and then the strategy will enter a trade. You can easily enable and disable strategies using the checkbox. This strategy incorporates a risk to reward system where the user can select between ATR and Percent based stop losses and take profit targets. This means that the user has much better control over money management when utilizing this strategy and it doesn't require you to babysit the strategy to ensure it's entering and existing strategies in an ideal place. Strategi Pine Script®oleh PrismBotTelah dikemas kini 66280
Confluence TradingThis indicator makes use of the Kumo Cloud, 3EMA and ADX/DI+/DI- indicators. While these can be used separately (green bars show where to long and red bars show where to short), this indicator also shows how their use together can create a more precise estimate on when to enter and exit the market. It is interesting to note that while each of the three indicators individually can predict movements and trend reversals early, having their signals converge into one makes a slower prediction but also a more accurate one. It is a great visual representation of why combining multiple trading techniques or analysis increases odds of winning trades (confluence trading). Do feel free to message me if you wish for me to add any other indicator to the mix or to fix any bugs. The ADX indicator makes use of robertkowalski's code.Penunjuk Pine Script®oleh antondmtTelah dikemas kini 22147
FTRS PROThe script works differently on different time frame. Works best in 1 min time frame. The script take advantage on ichimoku cloud for trend analysis, RSI for 2nd trend identification and a custom command to identify point of entry for the market bias. This is NOT a counter trend strategy, it is purely to capture the market bias on the chart. User able to customize based on their preferences risk to reward ratio and play along with user's own risk appetite. Strategi Pine Script®oleh ShukAzriyTelah dikemas kini 2210
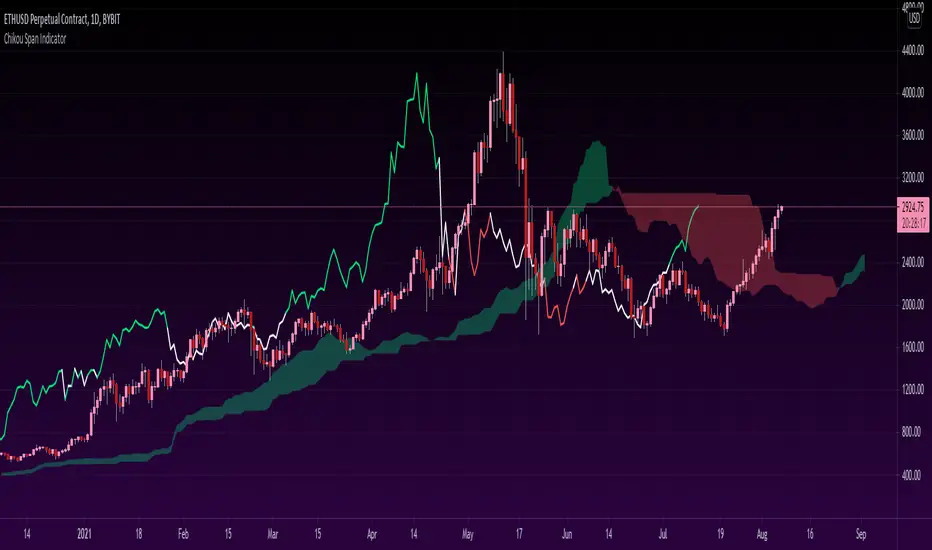
Chikou Span 'Open Space' ColorsThe Ichimoku Clouds strategy has been one of my favorite scripts to work with since I came across it a few months ago, so I thought I'd share one of the automated features I created for the strategy. For the purpose of this script, I'll only explain the Chikou Span aspect of it since there are plenty of other explanations about Ichimoku Clouds. The Chikou Span is one of the most useful aspects of the Ichimoku Clouds strategy despite it not being used in most people's strategies. It is calculated by simply taking the current closing value and plotting it backwards 26 bars. The Chikou Span is used to identify large trend moves and trend reversals by what is referred to as 'open space'. This occurs when the Chikou Span is not intersecting any candlestick within 10 bars (if you were to draw a horizontal line from the tip of the Chikou Span, it would not touch any part of a candle within 10 bars). The purpose of this script is to better identify the Chikou Span reaching 'open space' by coloring the Chikou Span's line: - Green when it is in upwards open space (bullish trend), and - Red when it is in downwards open space (bearish trend). I've also included my personal color scheme for the Ichimoku Clouds strategy as well as inputs to turn on/off every aspect of the strategy. ** Disclaimer: THIS IS NOT TRADING ADVICE. The Chikou Span should not be used on its own to make any trades. When trading with the Ichimoku Cloud strategy, one should utilize all 5 lines of the strategy to make realistic trades. If you'd like to learn more, I'd recommend reading "Trading with Ichimoku Clouds - The Essential Guide to Ichimoku Kinko Hyo Technical Analysis" **Penunjuk Pine Script®oleh OztheWoz1313212
Ichimoku + RSI Crypto trending strategyThis is a crypto trending strategy designed for big timeframes such as 3-4h+. Its components are: RSI ICHIMOKU full pack Heikin Ashi candles for logic calculation inside Rules for entry. For long : we have a long cross condition on ichimoku and price is above the ichimoku lines, and at the same time RSI value is > 50. For long : we have a short cross condition on ichimoku and price is below the ichimoku lines, and at the same time RSI value is < 50. Rules for exit We exit whenever we receive an opposite signal of the initial entry. SInce this strategy is using no risk management inside, I recommend to be careful with it . If you have any questions, let me know !Strategi Pine Script®oleh exlux234
Sola Fide [Strategy]Sola Fide High Accuracy with ATR R:R Indicators used: - Stochastic RSI - Chopiness Index - RSI - Ichimoku Cloud - ATR Script has been set up in strategy format to give backtesting data. The strategy has been made for BTC and ETH pairs against USDT on the hourly timerframe Currently outperforming the Buy and Hold Return on both assets. This script has been made to make it easier to automate strategies on 3commas In the settings you will see options for BTC strategy or ETH strategy Choose the asset you are on, copy your 3commas Bot ID and Email token and paste them into the settings box for eachever asset you are on. To receive the alerts set up within the strategy, in your alert message box use " {{strategy.order.alert_message}}" This will then be able to send any orders taken on the tradingview script directly to your long or short bot on 3commas This strategy is set up with a strict set of rules on the ATR for the Take profits and Losses. There is a repaint warning because the code uses heikin ashi candles through the security function, the given entry and exit signals do not repaint, I have been automating this for myself with no errors. You don't need to use more than 3x leverage... Past results do not guarentee future results. Strategi Pine Script®oleh TradingWolf6662
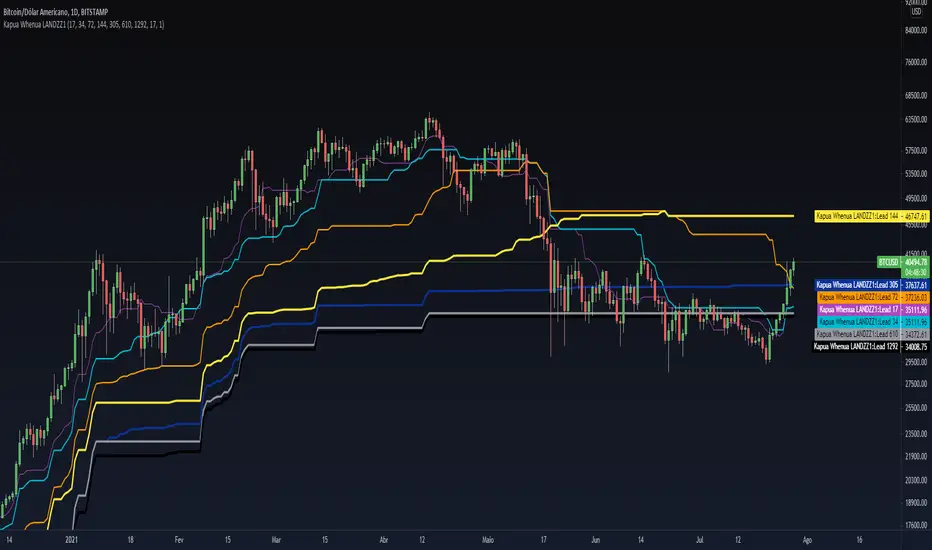
Kapua Whenua LANDZZ1Kapua Whenua means Earth's Clouds in Maori language, this indicator was created to show impulses and trends of the asset's price movement both up and down. The Indicator was made based on key numbers of the golden ratio: Conversion Line: Kw 17 (Purple Color) Kw 34 - Short Period Fractal (Light Blue Color) Kw 72 - Short/Medium Period Fractal (Orange) Kw 144 - Medium Period Fractal (Yellow Color) Kw 305 - Medium/Long Period Fractal (Dark Blue Color) Kw 610 - Long Period Fractal (Grey) Kw 1292 - Long Period Fractal+ (Black Color) The baseline or also called the conversion line is identified by the Color Purple of value 17. How to read the indicator: Every time the conversion line (Purple Color 17 periods) crosses a Kw value (Kapua Whenua) it will always look for the next KW line above or below the value as support or resistance. For example: If we are in a bull market, and the price crosses below the KW17 conversion line it will go towards KW 34 as support, if the price breaks KW 34 it will go towards the next line below KW 34 as support. Every time the conversion line or the price crosses a higher value of Kapua Whenua (KW) this trend will be stronger, it means, if the conversion line (KW 17) crosses above KW 305 it will indicate more strength than if it had crossed above the KW 72 or 144 for example. So to get better results trading with the trend, always observe if the conversion line and the price are below or above some Medium/Long Period KW. Note also that, in an uptrend, it could be that all KW are below each other. In a downtrend, it could be that all KW are on top of each other. This indicates that the farther the price is from the fractals the stronger the trend is, also, when there is a narrowing of the fractals means that the price will start to go sideways. If the price is between 2 or more Fractals, it will indicate consolidation. A really good trend is considered when the price or the Short/Medium Period Fractals are all above or below at KW 610, which is a long period fractal, meaning a strong uptrend or downtrend. A larger KW can be at the same point as a smaller KW, however, the stronger color will be shown above the weaker one. ***Larger chart timeframes are better to see longer KW fractals that are above or below the price, if your chart timeframe doesn't show a bigger support or resistance fractal, change the chart time to another longer period** Tip - Get used to looking at line colors as your indicators, just like moving averages. You can also take or place any fractal at any time in the configuration menu.Penunjuk Pine Script®oleh landzz15585
ICHIMOKU Trading betaIchimoku Kinko Hyo is a trend-following trading system with 5 indicators. All the five indicators have a different purpose and successful Ichimoku trading required in-depth analysis of all indicators. The script interpreted each indicator and develop a score to indicate the overall strength. I have taken the idea from the book “Trading with Ichimoku Clouds by MANESH PATEL”. The scoring system is mine to get an idea about how all the indicators are performing together. If most of the indicators are confirming then the score will be high. I am very new to Pinescript, so waiting for your comments and review. You can view all comments by turning the comments on. Penunjuk Pine Script®oleh tanayroyTelah dikemas kini 2222366
Equilibriums -- Based on Ichimoku Kinko HyoIntro: Hello dear traders. Lately I have been studying Ichimoku for trading. Personaly I find myself in a long lasting quest of creating an automated trading strategy that works. Let me tell you it aint easy. On this route I made countless of indicators some of which are worthless, others that have some potential. I did not publish these indicators as I do not want to bother people with sub par indicators that waste your time. My belief is strong and some day I will probably succeed in creating a working strategy. About the indicator: While researching Ichimoku Kinko Hyo (thanks chaostrader69 for providing such invaluable knowledge) I came across the numbers that define ichimoku. The Tenkan-sen and Kijun-sen lines and even the cloud are based on these numbers and create market equilibrium. The market always wants to return to this equilibrium. As a pine scripter and curious individual I made this indicator to expand the Tenkan and Kijun lines to more of these ichimoku number periods. Ofcourse this creates a mess of an indicator especialy when combined with the real ichimoku which is already too much info to grasp and apply correctly for most traders. I can not recommend any strategy with this indicator and that is why I want to deliver this simple script to the public. Opinions and trading theorys regarding these lines are very welcome. As you can see by the chart on the publication of this script the lines where nice and open and not crossing eachother in a clear uptrend. While when it was trading sideways the lines did not show direction at all and where close to eachother and crossing. Thx for taking the time to read this and possibly giving feedback. Feedback on the colors/line thickness is also welcome as I want my indicators to be beautiful!Penunjuk Pine Script®oleh Honestcowboy162
Ichimoku Cloud Strategy Long Only [Bitduke]Slightly modificated and optimized for Pine Script 4.0, Ichimoku Cloud Strategy which, suddenly, good suitable for the several crypto assets. Details: Enter position when conversion line crosses base line up, and close it when the opposite happens. Additional condition for open / close the trade is lagging span, it should be higher than cloud to open position and below - to close it. Backtesting: Backtested on SOLUSDT ( FTX, Binance ) +150% for 2021 year, 8% dd +191% for all time, 32% dd Disadvantages: - Small number of trades - Need to vary parameters for different coins (not very robust) Should be tested carefully for other coins / stock market. Different parameters could be needed or even algo modifications. Strategy doesn't repaint.Strategi Pine Script®oleh Bitduke11346
Ichimoku [xdecow]The Ichimoku Kinko Hyo (Ichimoku Cloud) is a popular indicator / system. In this version you will have a panel that shows the main signs of this system. Each signal can have its status as bullish (weak, neutral or strong), consolidation and bearish (weak, neutral or strong). Signals Kijun-Sen Cross Occurs when the price closes above/below the Kijun-sen. Weak Bullish: Occurs below the Kumo. Weak Bearish: Occurs above the Kumo. Bullish/Bearish Neutral: Occurs inside the Kumo. Strong Bullish: Occurs above the Kumo. Strong Bearish: Occurs below the Kumo. TK Cross Occurs when the Tenkan-sen crosses the Kijun-sen. Weak Bullish: Occurs when the crossing is below the Kumo. Weak Bearish: Occurs when the crossing is above the Kumo. Bullish/Bearish Neutral: Occurs when the crossing is inside the Kumo. Strong Bullish: Occurs when the crossing is above the Kumo. Strong Bearish: Occurs when the crossing is below the Kumo. Chikou Span Cross Occurs when the Chikou Span crosses the price. Weak Bullish: Occurs when current price is below the Kumo. Weak Bearish: Occurs when current price is above the Kumo. Bullish/Bearish Neutral: Occurs when current price is inside the Kumo. Strong Bullish: Occurs when current price is above the Kumo. Strong Bearish: Occurs when current price is below the Kumo. Kumo Breakout Occurs when the price closes above/below the Kumo. Kumo Twist Occurs when the Senkou Span A crosses the Senkou Span B ahead. Weak Bullish: Occurs when current price is below the Kumo. Weak Bearish: Occurs when current price is above the Kumo. Bullish/Bearish Neutral: Occurs when current price is inside the Kumo. Strong Bullish: Occurs when current price is above the Kumo. Strong Bearish: Occurs when current price is below the Kumo. In addition, Senkou Span B turns golden when it is flat and the cloud is lighter when it is thin (default is half the average of the last 610).Penunjuk Pine Script®oleh xdecowTelah dikemas kini 1616539
Ichimoku all signalsIchimoku Cloud All Signals! This indicator shows all Ichimoku Cloud signals for (entering/exiting/confirming/or even staying) in a position. you can choose a signal related to your strategy and use it. you can choose which signals to be shown on the chart by changing the settings. here are some examples of signals that you can get from this indicator: Crossover/under conversion line & base line Crossover/under lead line1 & lead line2 Crossover/under conversion line & lead line1 Crossover/under base line & lead line1 Crossover/under conversion line & lead line2 Crossover/under base line & lead line2 Crossover/under close & base line Cloud Breakouts in both directions! and 74 signals more !!!! Penunjuk Pine Script®oleh salarkamjooTelah dikemas kini 3030 1.8 K
Ichimoku cross and kumo switch Indicator [Mehdihz]This script has both cross and switch indicators. ** For switch indicator without shift, use 1 for DisplacementPenunjuk Pine Script®oleh UnknownUnicorn30015885599
Ichimoku breakoutIf you use Ichimoku Cloud strategies, this indicator is very useful for you! This code indicates the candles that break the ichimoku cloud in both directions! conversion line, base line and lagging span are disable by default, you can enable it from settings window. green triangles under the candles with green backgrounds show break out the red clouds. red triangles at the top of the candles with red backgrounds show break out the red clouds. you can set alerts to be notified when an Ichimoku Cloud is broken.Penunjuk Pine Script®oleh salarkamjoo674
SeaSide420 StrategyThis Strategy by SeaSide420 uses IchiMoku, Engulfing candles and 3 moving averages to find entry to buy and sell orders. It will hold buys and sells at the same time, it will close orders by StopLoss, or Trailing StopLoss or Target Profit. In the example chart here, only the trailing stop is active. It does have commission already included in this result. The initial test equity is set to 1 (1 BTC) so if you use this on say, a FOREX pair, you might want to check your settings, for example, set the initial equity to 100,000 USD as it normally is. I set this to 1 BTC to show that Holding 1 BTC for 2 years would not be as profitable as trading 1 BTC with this strategy for 2 years. The commission level is the same as Binance (0.1%), and the example pair is a Binance instrument, where Bitcoin trades can be in and out this way (CFD). Here it is shown on Daily chart, and with other timeframes/pairs, you may need to adjust the settings (MA period etc). New settings are achieved by you testing them yourself. This is published as an experimental script for use through API to do Automated trading on crypto exchanges. Questions welcome. Strategy free to use, Script private (PM me about it) I have not tested the alerts, but i did include alerts when open and close orders. Let me know if it works or not.Strategi Pine Script®oleh SeaSide4201717380
Ichimoku EMA RSI - Crypto only long StrategyHey there! Here I show you an Ichimoku Cloud Strategy. I discovered the strategy on a YouTube channel and tried to transfer it as a strategy into a script. He said in his video that you would make more profit with this strategy than holding the coin. Tested with the crypto pair ETH/USDT in the four hour chart. Period: beginning of 2017 until today. The strategy should also work with foreign exchange. But then the settings have to be adjusted. There is the possibility to activate two EMA's and a Stochastic RSI . ----------------------------------------------------------------------------------- How does the strategy work? ENTRY The green Ichimoku lead line must above the red Ichimoku lead line - only the two lead lines are activated. A green candle must closed above the green lead line. EXIT A red candle must close below the green Ichimoku lead line. OPTIONAL ENTRY EMA Once you activate the EMA , long positions will only be taken once the EMA1 is above the EMA2. Thereby I could observe a significant increase of the profit as well as a decrease of the maximum drawdown. RSI As soon as you activate the Stochastic RSI , long positions are only taken when the K line is above the D line. In the future, I may add an oversold - undersold parameter. The results of the strategy are without commissions and levers. If you have any questions or feedback, please let me know in the comments. If you need more information about the strategy and want to know exactly how to apply it, check out my profile. I wish you good luck with the strategy!Strategi Pine Script®oleh TradingStrategyCheckTelah dikemas kini 77534
[Kai]Ichimoku 一目均衡表LOG Computable Ichimoku clouds Ichimoku Kinko Hyo Expected to be used on LOG scale Please note that the value is calculated slightly smaller because it is calculated in LOG. The usage seems to be the same as the normal Ichimoku clouds Ichimoku Kinko Hyo * By default, LOG MODE is setting so if you need normal display, set it to FALSE. LOG計算可能な]Ichimok clouds 一目均衡表です LOGスケールでの使用を想定しています LOG計算しているので値は若干小さめに算出されるので注意が必要です 使用方法は通常のIchimok clouds 一目均衡表と同じで良いと思われます ※デフォルトではLOG MODE設定になっていますので、通常の表示が必要な場合は設定でFALSEにしてくださいPenunjuk Pine Script®oleh xinolia66104
BT CloudBT Cloud is a trading system with an advanced chart overlay showing a very reliable Trend Indicator based off Price, Trend, Momentum, and Market Structure. Inspired by the Ichimoku Cloud, Parabolic SAR, and Exponential Moving Averages the BT Cloud removes the unnecessary fluff and focuses on the Golden Zone 0.618 to 0.50 Levels on the current time frame for typical RSI length (14) settings. User should pay attention to where the cloud reverses directions. These areas are 50% ranges of significance and have a high chance of acting like target zones for support and resistance in the future. This indicator will allow the user to make observations around how extended the trends against each other as well as serving as basis for divergence and trendline studies drawn in manually by the user. The oscillator will turn green/red as observable on the main chart overlay.Penunjuk Pine Script®oleh itsCblast1919 2 K