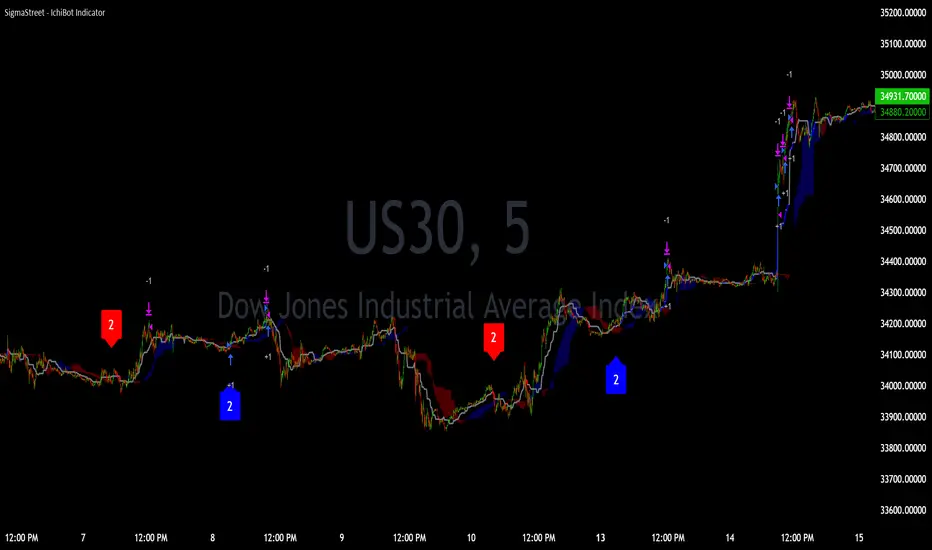
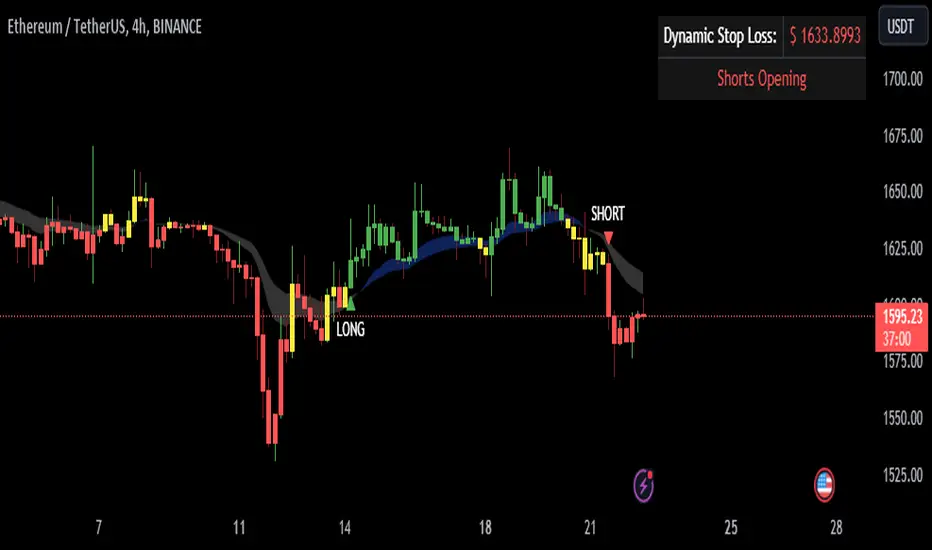
Ichimoku Cloud with RSI (By Coinrule)The Ichimoku Cloud is a collection of technical indicators that show support and resistance levels, as well as momentum and trend direction. It does this by taking multiple averages and plotting them on a chart. It also uses these figures to compute a “cloud” that attempts to forecast where the price may find support or resistance in the future.
The Ichimoku Cloud was developed by Goichi Hosoda, a Japanese journalist, and published in the late 1960s. It provides more data points than the standard candlestick chart. While it seems complicated at first glance, those familiar with how to read the charts often find it easy to understand with well-defined trading signals.
The Ichimoku Cloud is composed of five lines or calculations, two of which comprise a cloud where the difference between the two lines is shaded in.
The lines include a nine-period average, a 26-period average, an average of those two averages, a 52-period average, and a lagging closing price line.
The cloud is a key part of the indicator. When the price is below the cloud, the trend is down. When the price is above the cloud, the trend is up.
The above trend signals are strengthened if the cloud is moving in the same direction as the price. For example, during an uptrend, the top of the cloud is moving up, or during a downtrend, the bottom of the cloud is moving down.
This strategy combines the Ichimoku Cloud with the RSI indicator to better enter trades.
Long/Short orders are placed when three basic signals are triggered.
Long Position:
Tenkan-Sen is above the Kijun-Sen
Chikou-Span is above the close of 26 bars ago
Close is above the Kumo Cloud
RSI is greater less than 50
Short Position:
Tenkan-Sen is below the Kijun-Sen
Chikou-Span is below the close of 26 bars ago
Close is below the Kumo Cloud
RSI is greater than 50
The script is backtested from 1 June 2022 and provides good returns.
The strategy assumes each order is using 30% of the available coins to make the results more realistic and to simulate you only ran this strategy on 30% of your holdings. A trading fee of 0.1% is also taken into account and is aligned to the base fee applied on Binance.
This script also works well on SOL (45m timeframe), BNB (1h timeframe), and ETH (1h timeframe).
Awan Ichimoku
MTF Ichimoku Cloud MonitorIchimoku Kinko Hyo is a technical analysis method that builds on candlestick charting to improve the accuracy of forecast price moves.
his Indicator build for Monitor SenkouSpanA & SenkouSpanB Lines (Kumo Cloud) status and you can watch 3 Time Frames Status on one bar and in one timeframe.
You can select timeframe and set Inputs for lines from Indicator setting.
Good trading to all ...
Chiko-Span Momentum_PineScript_Version5This is Momentum indicator based on "Chiko-span" of Ichimoku Kinko-Hyo.
Differ from normal momentum indicator, this indicator is using "close" and "open" as default parameter which is based on 9 week-candle chart Invented by Ichimoku-Sanjin. And, It is located 26 period before to match chiko-span.
(Parameters can change as you like)
The usage is same as normal momentum indicator so please check momentum indicator usage. However, due to use this indicator, it may support to compare momentum of chiko-span movement and to predict effect 5 lines of ichimoku.
For example, when price break out tenkan-sen, you can measure slope or period of chiko-span momentum and compare previously chiko-span momentum. If momentum is stronger than previously price, we can think that price try to out kijun- sen, touch cloud or break out cloud.
I wish, this indicator helps ichimoku users.
Ichimoku Cloud with EMAThis is a standard Ichimoku Cloud indicator that uses the exponential moving average (EMA) instead of the Tenkan and Kijun Sen.
It provides similar signals as the original but just looks nicer in my opinion.
pickle financialversion 1.0
A multi-use indicator
FEATURES:
1) Robust VWAP with up to 3 deviations that can be adjusted for Session, Week, Month, Quarter, Year, Decade, Century, Earnings , Dividend, & Split intervals
2) 20 customizable Moving Averages that can be changed to EMAs, SMAs , WMAs, SMMAs, and VWMAs; can also be adjusted to Candle Closes, Highs, Lows, Opens, HLC3, HL2 , OHLC4, & HLCC4
-Praise be lady VWAP
Ichimoku ImbalanceYou may have heard the word balance or imbalance
This indicator is designed based on Ichimoku periods to display imbalances in each period
When you see a black mark, it means that one of the Ichimoku periods is saturated or unbalanced
If the current candle was equal to the lowest price on 9/26/52 of the last period and the highest price was equal to the last candle from left on 9/26/52 of the last period
If the current candle was equal to the highest price on 9/26/52 of the last period and the lowest price was equal to the last candle from right on 9/26/52 of the last period
This indicator is a useful and powerful tool for Ichimoku traders to understand overbought and oversold points in different time periods.
Note: This is an auxiliary tool and does not issue buy and sell signals
HLM Trend Line (High-Low-Midpoint / Ichimoku Line)Ichimoku style trend line .
Some strategies call for a custom Ichimoku style line (midpoint of range's high/low).
This allows you to use or replace a single line without having to customize a full Ichimoku setup.
Trendlines Boll Ichi S1 by GammaprodI. How to use this indicator :
------------------------------
I.1. Set your teadingview theme to dark theme.
I.2. Gammaprod indicator is valid for forex, stock and but more valid for crypto.
I.3. Use three timeframe for more validation (choose between those, that fit to your trading style) :
- Timeframe 1m, 5m, and 15m for Scalping
- Timeframe 30m, 1h and 4h for Intraday
- Timeframe 4h, 1D and 1W for Swing Trading
I.4 Always use THREE INDICATORS FROM GAMMAPROD, those three indicators is back to back each other, by the way, I only made those three indicators only (for now) :
- Trendlines Boll Ichi S1 by Gammaprod
- MACD Volume S2 by Gammaprod
- Stoch RSI Divs Zone S2 by Gammaprod
============================================================================
II. How to setting :
--------------------
II.1. Trendlines Boll Ichi Crypto by Gammaprod
II.1.A. Support and Resistance
- Well if you familiar with this indicator you can add it, but recommended for Timeframe 30m or more
II.1.B. Trendlines Primary or Trendlines Secondary
- Timeframe 1m you DON'T NEED Trendlines Primary or Trendlines Secondary
- Timeframe 5m you DON'T NEED Trendlines Secondary, but you CAN ADD Trendlines Primary if you fell it helpful (for me, it is helpful to find where the candles start or the end trend or a consolidation or where the candles will surpass a resistance or a support).
- Timeframe 15m you DON'T NEED Trendlines Secondary, DEFENITELY add Trendlines Primary it will help to find where the candles stop or a consolidation or where the candles will surpass a resistance or a support).
- Timeframe 30m or more, DEFENITELY NEED BOTH Trendlines Primary and Secondary Trendlines, it will help to find where the candle stop or consolidation or where the candle will surpass a resistance or support).
II.1.C. Bollinger, Ichimoku Cloud and Lagging Span
- Please DON'T CHANGE IT at all, it's really helpful to know when and where to make an entry decesion or a trend or a consolidation, if you don't understand how to read it, you better to learn it first (on "how to read" section and "How to OPEN position" the section below)
II.2. Stoch RSI Divs Zone Crypto by Gammaprod (DON'T CHANGE IT)
II.3. MACD Volume Crypto by Gammaprod (DON'T CHANGE IT)
============================================================================
III. How to read :
------------------
III.1. Sell or Buy Priority :
III.1.A. Sell Priority
- Color background on macd and stoch rsi is pink or purple sell is the priority, (if you're not sure to buy, just wait until the best moment to sell)
III.1.B. Buy Priority
- Color background on macd and stoch rsi Teal or light green buy is the priority, (if you're not sure to sell, just wait until the best moment to buy)
III.1.C. Indecision / Golden Moment
- Color background on stoch rsi yellow is indecision / golden moment of reversal pattern (wait until it formed background only on Stoch RSI), please be careful at this moment.
III.2. Trend / Consolidation :
III.2.A. BULLISH trend
- When Stoch RSI and MACD have teal or light green background that's means BULLISH trend, better to confirm by the candle is above green cloud and lagging span (red line) is also above the candle.
III.2.B. BEARISH trend
- When Stoch RSI and MACD have the Pink or purple background that's means BEARISH trend, better to confirm by the candle is above purple cloud and lagging span (red line) is also below the candle.
III.2.C. CONSOLIDATION
- When Stoch RSI have the mix background that's means CONSOLIDATION, better to confirm by the candle is in or near to green / purple cloud and lagging span (red line) is also on the candle.
III.3. Special Mark
III.3.A. Ideal Bullish :
- Near line 20 and green / teal background = When Stoch RSI have the char R / H on lime color label, that's means divergence or hidden divergence for buy position, if you not see this label that's means just a standard confirmation for buy
III.3.B. Not an Ideal Bullish :
- Near line 80 and green / teal background = if this happens make sure you know what happen, it could be a false signal or bullish continual pattern
III.3.C. Ideal Bearish :
- Near line 80 and pink / purple background = When Stoch RSI have the char R / H on lime color label, that's means divergence or hidden divergence for buy position, if you not see this label that's means just a standard confirmation for sell position.
III.3.D. Not an Ideal Bearish:
- Near line 20 and pink / purple background = if this happens make sure you know what happen, it could be a false signal or bearish continual pattern
III.3.E. The Beginning of Reversal (from BEARISH to BULLISH) :
- When Stoch RSI line shaping GREEN position is near 20.
- MACD lines still PINK, position lines is UNDER the HISTOGRAM, but the HISTOGRAM start to SHAPE FALL PINK (light pink) and the BACKGROUND still PINK / PURPLE.
- Position CANDLES NEAR BLUE line, NEAR PURPLE CLOUD, and lagging span (red line) STILL ON the area candle. (it used to be confirmed with the golden moment).
III.3.F. The Beginning of Reversal (from BULLISH to BEARISH) :
- When Stoch RSI line shaping PINK position is near 80.
- MACD lines still GREEN, position lines is ABOVE the HISTOGRAM, but the HISTOGRAM start to SHAPE FALL GREEN (light green) and the BACKGROUND still TEAL / GREEN.
- Position CANDLES NEAR WHITE line, NEAR TEAL CLOUD, and lagging span (red line) STILL ON the area candle. (it used to be confirmed with the golden moment).
III.3.G. False Signals, or It could be a Golden Moment (better to see it on TF 15 or bigger):
- Near line 20 or 80 and yellow background = When Stoch RSI have the char R / H on color label, that's means divergence or hidden divergence for buy / sell position, if you not see this label that's means just a standard confirmation for buy / sell depends on where the Stoch RSI line if near 20 that's means buy, near 80 means sell
============================================================================
IV. How to OPEN position:
-------------------------
IV.1. Bullish
IV.1.A. Trendlines Boll Ichi S1 by Gammaprod
- The candles above the green cloud.
- Lagging span (red line) above the candles.
- then open buy near yellow line (the first option) / blue line (the second option) (always confirm the position with two other indicators below).
IV.1.B. MACD Volume S2 by Gammaprod
- Teal or Green background.
- The lines is shaped or shaping green.
- Better if at the green histogram.
IV.1.C. Stoch RSI Divs Zone S3 by Gammaprod
- Teal or Green background.
- The lines is shaping green.
- Better if on the bottom (at a range 20).
IV.2. Bearish
IV.2.A. Trendlines Boll Ichi S1 by Gammaprod
- The candles below the purple cloud.
- Lagging span (red line) below the candles.
- then open buy near yellow line (the first option) / white line (the second option) (always confirm the position with two other indicators below).
IV.2.B. MACD Volume S2 by Gammaprod
- Pink or purple background.
- The lines are shaped or shaping green.
- Better if at the pink histogram.
IV.2.C. Stoch RSI Divs Zone S3 by Gammaprod
- Pink or purple background.
- The lines are shaping pink.
- Better if the line on the top (at a range 80).
IV.3. Consolidation
IV.3.A. Trendlines Boll Ichi S1 by Gammaprod
- The candles on the cloud (green or purple).
- Lagging span (red line) on the candles.
- then open buy near the white or blue line (always confirm the position with two other indicators below).
IV.3.B. MACD Volume S2 by Gammaprod
- Changing the background.
- The line is near the middle line.
- Have small Histogram.
IV.3.C. Stoch RSI Divs Zone S3 by Gammaprod
- Mix background specially on a timeframe 15m or more.
- The line move fast up and down.
- Better if on the bottom or the top of the lines (at a range 20 or 80).
============================================================================
>> The secret ingredient is comparing the timeframe :
The example scalping (Timeframe 1m, 5m and 15m)
- TF 1m is for making an open position.
- TF 5m is for making a judgement of the trend market.
- TF 15m is to confirm that judgement from TF 5m, be careful if it not similar then it used to be a consolidation or the beginning of the reversal.
There's a lot a way to open the position than above information that i gave it to you, but consider there are a limit chars on this column, I hope it will help your trading and make a more profit on it.
SUPERTREND MIXED ICHI-DMI-DONCHIAN-VOL-GAP-HLBox@RLSUPERTREND MIXED ICHI-DMI-VOL-GAP-HLBox@RL
by RegisL76
This script is based on several trend indicators.
* ICHIMOKU (KINKO HYO)
* DMI (Directional Movement Index)
* SUPERTREND ICHIMOKU + SUPERTREND DMI
* DONCHIAN CANAL Optimized with Colored Bars
* HMA Hull
* Fair Value GAP
* VOLUME/ MA Volume
* PRICE / MA Price
* HHLL BOXES
All these indications are visible simultaneously on a single graph. A data table summarizes all the important information to make a good trade decision.
ICHIMOKU Indicator:
The ICHIMOKU indicator is visualized in the traditional way.
ICHIMOKU standard setting values are respected but modifiable. (Traditional defaults = .
An oriented visual symbol, near the last value, indicates the progression (Ascending, Descending or neutral) of the TENKAN-SEN and the KIJUN-SEN as well as the period used.
The CLOUD (KUMO) and the CHIKOU-SPAN are present and are essential for the complete analysis of the ICHIMOKU.
At the top of the graph are visually represented the crossings of the TENKAN and the KIJUN.
Vertical lines, accompanied by labels, make it possible to quickly visualize the particularities of the ICHIMOKU.
A line displays the current bar.
A line visualizes the end of the CLOUD (KUMO) which is shifted 25 bars into the future.
A line visualizes the end of the chikou-span, which is shifted 25 bars in the past.
DIRECTIONAL MOVEMENT INDEX (DMI) : Treated conventionally : DI+, DI-, ADX and associated with a SUPERTREND DMI.
A visual symbol at the bottom of the graph indicates DI+ and DI- crossings
A line of oriented and colored symbols (DMI Line) at the top of the chart indicates the direction and strength of the trend.
SUPERTREND ICHIMOKU + SUPERTREND DMI :
Trend following by SUPERTREND calculation.
DONCHIAN CHANNEL: Treated conventionally. (And optimized by colored bars when overshooting either up or down.
The lines, high and low of the last values of the channel are represented to quickly visualize the level of the RANGE.
SUPERTREND HMA (HULL) Treated conventionally.
The HMA line visually indicates, according to color and direction, the market trend.
A visual symbol at the bottom of the chart indicates opportunities to sell and buy.
VOLUME:
Calculation of the MOBILE AVERAGE of the volume with comparison of the volume compared to the moving average of the volume.
The indications are colored and commented according to the comparison.
PRICE: Calculation of the MOBILE AVERAGE of the price with comparison of the price compared to the moving average of the price.
The indications are colored and commented according to the comparison.
HHLL BOXES:
Visualizes in the form of a box, for a given period, the max high and min low values of the price.
The configuration allows taking into account the high and low wicks of the price or the opening and closing values.
FAIR VALUE GAP :
This indicator displays 'GAP' levels over the current time period and an optional higher time period.
The script takes into account the high/low values of the current bar and compares with the 2 previous bars.
The "gap" is generated from the lack of overlap between these bars. Bearish or bullish gaps are determined by whether the gap is above or below HmaPrice, as they tend to fill, and can be used as targets.
NOTE: FAIR VALUE GAP has no values displayed in the table and/or label.
Important information (DATA) relating to each indicator is displayed in real time in a table and/or a label.
Each information is commented and colored according to direction, value, comparison etc.
Each piece of information indicates the values of the current bar and the previous value (in "FULL" mode).
The other possible modes for viewing the table and/or the label allow a more synthetic view of the information ("CONDENSED" and "MINIMAL" modes).
In order not to overload the vision of the chart too much, the visualization box of the RANGE DONCHIAN, the vertical lines of the shifted marks of the ICHIMOKU, as well as the boxes of the HHLL Boxes indicator are only visualized intermittently (managed by an adjustable time delay ).
The "HISTORICAL INFO READING" configuration parameter set to zero (by default) makes it possible to read all the information of the current bar in progress (Bar #0). All other values allow to read the information of a historical bar. The value 1 reads the information of the bar preceding the current bar (-1). The value 10 makes it possible to read the information of the tenth bar behind (-10) compared to the current bar, etc.
At the bottom of the DATAS table and label, lights, red, green or white indicate quickly summarize the trend from the various indicators.
Each light represents the number of indicators with the same trend at a given time.
Green for a bullish trend, red for a bearish trend and white for a neutral trend.
The conditions for determining a trend are for each indicator:
SUPERTREND ICHIMOHU + DMI: the 2 Super trends together are either bullish or bearish.
Otherwise the signal is neutral.
DMI: 2 main conditions:
BULLISH if DI+ >= DI- and ADX >25.
BEARISH if DI+ < DI- and ADX >25.
NEUTRAL if the 2 conditions are not met.
ICHIMOKU: 3 main conditions:
BULLISH if PRICE above the cloud and TENKAN > KIJUN and GREEN CLOUD AHEAD.
BEARISH if PRICE below the cloud and TENKAN < KIJUN and RED CLOUD AHEAD.
The other additional conditions (Data) complete the analysis and are present for informational purposes of the trend and depend on the context.
DONCHIAN CHANNEL: 1 main condition:
BULLISH: the price has crossed above the HIGH DC line.
BEARISH: the price has gone below the LOW DC line.
NEUTRAL if the price is between the HIGH DC and LOW DC lines
The 2 other complementary conditions (Datas) complete the analysis:
HIGH DC and LOW DC are increasing, falling or stable.
SUPERTREND HMA HULL: The script determines several trend levels:
STRONG BUY, BUY, STRONG SELL, SELL AND NEUTRAL.
VOLUME: 3 trend levels:
VOLUME > MOVING AVERAGE,
VOLUME < MOVING AVERAGE,
VOLUME = MOVING AVERAGE.
PRICE: 3 trend levels:
PRICE > MOVING AVERAGE,
PRICE < MOVING AVERAGE,
PRICE = MOVING AVERAGE.
If you are using this indicator/strategy and you are satisfied with the results, you can possibly make a donation (a coffee, a pizza or more...) via paypal to: lebourg.regis@free.fr.
Thanks in advance !!!
Have good winning Trades.
**************************************************************************************************************************
SUPERTREND MIXED ICHI-DMI-VOL-GAP-HLBox@RL
by RegisL76
Ce script est basé sur plusieurs indicateurs de tendance.
* ICHIMOKU (KINKO HYO)
* DMI (Directional Movement Index)
* SUPERTREND ICHIMOKU + SUPERTREND DMI
* DONCHIAN CANAL Optimized with Colored Bars
* HMA Hull
* Fair Value GAP
* VOLUME/ MA Volume
* PRIX / MA Prix
* HHLL BOXES
Toutes ces indications sont visibles simultanément sur un seul et même graphique.
Un tableau de données récapitule toutes les informations importantes pour prendre une bonne décision de Trade.
I- Indicateur ICHIMOKU :
L’indicateur ICHIMOKU est visualisé de manière traditionnelle
Les valeurs de réglage standard ICHIMOKU sont respectées mais modifiables. (Valeurs traditionnelles par défaut =
Un symbole visuel orienté, à proximité de la dernière valeur, indique la progression (Montant, Descendant ou neutre) de la TENKAN-SEN et de la KIJUN-SEN ainsi que la période utilisée.
Le NUAGE (KUMO) et la CHIKOU-SPAN sont bien présents et sont primordiaux pour l'analyse complète de l'ICHIMOKU.
En haut du graphique sont représentés visuellement les croisements de la TENKAN et de la KIJUN.
Des lignes verticales, accompagnées d'étiquettes, permettent de visualiser rapidement les particularités de l'ICHIMOKU.
Une ligne visualise la barre en cours.
Une ligne visualise l'extrémité du NUAGE (KUMO) qui est décalé de 25 barres dans le futur.
Une ligne visualise l'extrémité de la chikou-span, qui est décalée de 25 barres dans le passé.
II-DIRECTIONAL MOVEMENT INDEX (DMI)
Traité de manière conventionnelle : DI+, DI-, ADX et associé à un SUPERTREND DMI
Un symbole visuel en bas du graphique indique les croisements DI+ et DI-
Une ligne de symboles orientés et colorés (DMI Line) en haut du graphique, indique la direction et la puissance de la tendance.
III SUPERTREND ICHIMOKU + SUPERTREND DMI
Suivi de tendance par calcul SUPERTREND
IV- DONCHIAN CANAL :
Traité de manière conventionnelle.
(Et optimisé par des barres colorées en cas de dépassement soit vers le haut, soit vers le bas.
Les lignes, haute et basse des dernières valeurs du canal sont représentées pour visualiser rapidement la fourchette du RANGE.
V- SUPERTREND HMA (HULL)
Traité de manière conventionnelle.
La ligne HMA indique visuellement, selon la couleur et l'orientation, la tendance du marché.
Un symbole visuel en bas du graphique indique les opportunités de vente et d'achat.
*VI VOLUME :
Calcul de la MOYENNE MOBILE du volume avec comparaison du volume par rapport à la moyenne mobile du volume.
Les indications sont colorées et commentées en fonction de la comparaison.
*VII PRIX :
Calcul de la MOYENNE MOBILE du prix avec comparaison du prix par rapport à la moyenne mobile du prix.
Les indications sont colorées et commentées en fonction de la comparaison.
*VIII HHLL BOXES :
Visualise sous forme de boite, pour une période donnée, les valeurs max hautes et min basses du prix.
La configuration permet de prendre en compte les mèches hautes et basses du prix ou bien les valeurs d'ouverture et de fermeture.
IX - FAIR VALUE GAP
Cet indicateur affiche les niveaux de 'GAP' sur la période temporelle actuelle ET une période temporelle facultative supérieure.
Le script prend en compte les valeurs haut/bas de la barre actuelle et compare avec les 2 barres précédentes.
Le "gap" est généré à partir du manque de recouvrement entre ces barres.
Les écarts baissiers ou haussiers sont déterminés selon que l'écart est supérieurs ou inférieur à HmaPrice, car ils ont tendance à être comblés, et peuvent être utilisés comme cibles.
NOTA : FAIR VALUE GAP n'a pas de valeurs affichées dans la table et/ou l'étiquette.
Les informations importantes (DATAS) relatives à chaque indicateur sont visualisées en temps réel dans une table et/ou une étiquette.
Chaque information est commentée et colorée en fonction de la direction, de la valeur, de la comparaison etc.
Chaque information indique la valeurs de la barre en cours et la valeur précédente ( en mode "COMPLET").
Les autres modes possibles pour visualiser la table et/ou l'étiquette, permettent une vue plus synthétique des informations (modes "CONDENSÉ" et "MINIMAL").
Afin de ne pas trop surcharger la vision du graphique, la boite de visualisation du RANGE DONCHIAN, les lignes verticales des marques décalées de l'ICHIMOKU, ainsi que les boites de l'indicateur HHLL Boxes ne sont visualisées que de manière intermittente (géré par une temporisation réglable ).
Le paramètre de configuration "HISTORICAL INFO READING" réglé sur zéro (par défaut) permet de lire toutes les informations de la barre actuelle en cours (Barre #0).
Toutes autres valeurs permet de lire les informations d'une barre historique. La valeur 1 permet de lire les informations de la barre précédant la barre en cours (-1).
La valeur 10 permet de lire les information de la dixième barre en arrière (-10) par rapport à la barre en cours, etc.
Dans le bas de la table et de l'étiquette de DATAS, des voyants, rouge, vert ou blanc indique de manière rapide la synthèse de la tendance issue des différents indicateurs.
Chaque voyant représente le nombre d'indicateur ayant la même tendance à un instant donné. Vert pour une tendance Bullish, rouge pour une tendance Bearish et blanc pour une tendance neutre.
Les conditions pour déterminer une tendance sont pour chaque indicateur :
SUPERTREND ICHIMOHU + DMI : les 2 Super trends sont ensemble soit bullish soit Bearish. Sinon le signal est neutre.
DMI : 2 conditions principales :
BULLISH si DI+ >= DI- et ADX >25.
BEARISH si DI+ < DI- et ADX >25.
NEUTRE si les 2 conditions ne sont pas remplies.
ICHIMOKU : 3 conditions principales :
BULLISH si PRIX au dessus du nuage et TENKAN > KIJUN et NUAGE VERT DEVANT.
BEARISH si PRIX en dessous du nuage et TENKAN < KIJUN et NUAGE ROUGE DEVANT.
Les autres conditions complémentaires (Datas) complètent l'analyse et sont présents à titre informatif de la tendance et dépendent du contexte.
CANAL DONCHIAN : 1 condition principale :
BULLISH : le prix est passé au dessus de la ligne HIGH DC.
BEARISH : le prix est passé au dessous de la ligne LOW DC.
NEUTRE si le prix se situe entre les lignes HIGH DC et LOW DC
Les 2 autres conditions complémentaires (Datas) complètent l'analyse : HIGH DC et LOW DC sont croissants, descendants ou stables.
SUPERTREND HMA HULL :
Le script détermine plusieurs niveaux de tendance :
STRONG BUY, BUY, STRONG SELL, SELL ET NEUTRE.
VOLUME : 3 niveaux de tendance :
VOLUME > MOYENNE MOBILE, VOLUME < MOYENNE MOBILE, VOLUME = MOYENNE MOBILE.
PRIX : 3 niveaux de tendance :
PRIX > MOYENNE MOBILE, PRIX < MOYENNE MOBILE, PRIX = MOYENNE MOBILE.
Si vous utilisez cet indicateur/ stratégie et que vous êtes satisfait des résultats,
vous pouvez éventuellement me faire un don (un café, une pizza ou plus ...) via paypal à : lebourg.regis@free.fr.
Merci d'avance !!!
Ayez de bons Trades gagnants.
Ichimoku Kinko HyoThis indicator is adding to the original indicator Ichimoku Cloud some visual informations.
Be aware of settings that are by default 10, 30, 60, while in the original indicator, default settings are 9, 26, 52. These are commonly consider like "crypto settings".
Tenkan = blue line
Kijun = orange line
SSB = red line
This indicator display three categories of signals that are given by the Ichimoku indicator:
- tenkan / kijun crosses ;
- breaks of mid prices for the different time horizon ;
- bar coloring depending of the trend
Let's review more in deep each of these elements.
Tenkan / Kijun crosses
When the tenkan crossover the kijun, this is called gold cross and it's display by a green triangle at the bottom of the chart.
When the tenkan crossunder the kijun, this is called death cross and it's display by a red triangle at the top of the chart.
I advise to not enter long or short only on this signal because it can be fake, especially during ranges.
To confirm the signal, we need to wait for a movement of the kijun in the same side of the cross. See first arrow on the chart.
Breaks of mid prices
Ichimoku is composed of three han-le lines that displays mid-price of the last candles depending on the settings (10, 30, 60).
Tenkan show us the mid-price of the last 10 candles (short term)
Kijun show us the mid-price of the last 30 candles (mid term)
SSB show us the mid-price of the last 60 candles (long term)
Break of tenkan by the price is the first signal that Ichimoku gives us before a reversal of the trend. This signal is display by a blue triangle.
Then, happened the break of kijun line follow by the break of the SSB. These are display respectively by an orange triangle and a red triangle.
Same advise, don't enter long or short only on break of these lines.
However, tenkan and kijun breaks can be used as exit point.
Bar coloring
The bar coloring display the strength of the trend:
- green candle: strong bullish trend - this happen when the current price is above tenkan, kijun and SSB ;
- blue candle: potential starting of a bullish trend - this happen when the current price is above tenkan and kijun but below the SSB ;
- no colored candle: no trend, market is in a range - this happen when the current price is above tenkan and below kijun and SSB or when the current price is below tenkan and above kijun and SSB ;
- orange candle: potential starting of a bearish trend - this happen when the current price is below tenkan and kijun but above SSB ;
- red candle: strong bearish trend - this happen when the current price is below tenkan, kijun and SSB
How to use to enter / exit trades
First of all, we need confirmations to enter in the side of the trend.
The first signal that the indicator gives us is the break of tenkan, follow by the break of kijun. Candles becomes blue / orange depending of the side.
Then, we wait for a cross of tenkan and kijun. This cross has to be confirmed by a movement of kijun. A flat kijun tell us this is a fake cross.
When the movement of kijun happened in the same side of the cross it is possible to enter a trade if you are aggresive.
Otherwise, you can wait for the third signal to take place: break of SSB, candle become green / red, depending on the side.
You can then enter a trade.
Then hold the position and wait to exit for break of tenkan or kijun, depending on your horizon (short / mid term).
If you have other questions or some features that are missing, pm me. Thanks.
Jupiter MAyou can use this srtategy multitime but the best time is your chart should be on5 min and multitime 1 should be on15 then when the the red an green line cross blue line get long position and get short position when upside down
SuperIchi StrategyTRADE CONDITIONS
Long entry:
Tenkan-Sen is above Kijun-Sen (blue line above red line)
Price closes above both Tenkan-Sen and Kijun-Sen (price closes above both blue and red lines)
Tenkan-Sen and Kijun-Sen is above Senkou Span (both blue and red lines are above cloud)
Senkou Span is green (cloud is green)
Price pulled back and closed below both Tenkan-Sen and Kijun-Sen within last X (configurable in settings) candles (price pulled back below blue and red lines)
Short entry:
Tenkan-Sen is below Kijun-Sen (blue line below red line)
Price closes below both Tenkan-Sen and Kijun-Sen (price closes below both blue and red lines)
Tenkan-Sen and Kijun-Sen is below Senkou Span (both blue and red lines are below cloud)
Senkou Span is red (cloud is red)
Price pulled back and closed above both Tenkan-Sen and Kijun-Sen within last X (configurable in settings) candles (price pulled back above blue and red lines)
Risk management:
Each trade risks 2% of account (configurable in settings)
SL size determined by swing low/high of previous X candles (configurable in settings) or using the ATR override (configurable in settings) where the max of swing high/low or ATR value will be used to calculate SL
TP is calculated by Risk:Reward ratio (configurable in settings)
TIPS
Timeframe: I have found best results running on anything 5M and above
CREDITS
SuperIchi by LuxAlgo
Ichimoku [2022] [v5] [keivanipchihagh]A more personalized ichimoki indicator with more configurations.
This indicator is exactly like the original ichimoku indicator, but with 104 Line (x4 timeframe) , 208 Line (x8 timeframe) , Quality Line and Tenken-sen & Kijun-sen crossovers added as well. The extras added to the indicator can simply be hidden in order to make the chart look less full.
104 Line : The formula is to average the highest and lowest point of the last 104 candles. This is to see the x4 time-frame as well, which shows a strong support and resistance line.
208 Line : The formula is to average the highest and lowest point of the last 208 candles. This is to see the 84 time-frame as well, which shows even a stronger support and resistance line.
Quality Line : It's exactly the same the Kijun-sen but with a positive offset of 26.
Tenken-sen & Kijun-sen Crossoveers : Just to make it easier to see the crossovers.
In future updates, I'm going to add more components and make it more insightful than it currently is. Ideas would be appreciated (:
Scalping Alice 3/5INTRO
Scalping Alice is a work in progress. I made it to help with my Scalping Long strategy as a helper for entrances.
This instance of the indicator is for 3min and 5min chart analysis only.
It still needs to further adopt and calibrate multi-frame data, but for the moment it takes from the Daily, the Hourly and the 15min.
It is meant to be used WITHOUT candles. This is because, one of the goals I'm trying to achieve is to compress data and leave out unwanted noise.
The 3min and 5min candles are very dynamic (specially in the crypto market), so I don't need to know the whole OHLC, but I do need a range.
COMPONENTS
Small Blob
The first component is the current time-frame Price Blob. The top line is the candle Highs and the bottom line is the candle Lows.
The Price Blob's Color changes according to a Double RSI which you can modify the values for.
The default is 13 for the Fast RSI and 34 for the Slow RSI.
When the Fast RSI is on top it turns Green. When the Slow RSI is on top it turns Red.
Big Blob
The Outer Blob is the same as the inner blob, but in the 15min time-frame. It changes color the exact same way, but with 15min values.
WMA Line
The closest line to the blob is the WMA line. You can change the default value, which is 21.
The color changes according to a complex modifier, that I will try to explain, but most likely fail.
It takes a sort of Tenkan (see Ichimoku Cloud if you don't know what a Tenkan is) value from the 15min chart and the Hourly chart.
It then compares the difference from these Tenkans and adds it to the 15min mid price.
And finally tries to find a fast Trend of the movement of the price for the last 3 candles.
The Tenkan value can be changed from it's default 3. Be wary, this changes the Tenkans for all the timeframes.
Blue Tenkan
The slower line is an Hourly Tenkan but with a value of 9.
Saturation Clouds
The last piece are the orange Saturation Clouds. These appear in bigger price movements and work weirdly.
They are differences between Hourly Tenkan and current frame Tenkan, along added to the mid point of the price and a little bit of Bollinger math.
Again, hard to explain, but they are very useful. Maybe one of the most useful parts of Alice.
BULL AND BEAR
Bullish :
- Green Small Blob
- Green Big Blob
- Green WMA
- Small Price Blob Above WMA
- Small Price Blob Above Blue Tenkan
- Small Price Blob Inside Upper Saturation Cloud
- Lower Saturation Cloud appears but DOES NOT touch Small Price Blob
Bearish
- Red Small Blob
- Red Big Blob
- Red WMA
- Small Price Blob Below WMA
- Small Price Blob Below Blue Tenkan
- Small Price Blob Inside Lower Saturation Cloud
- Upper Saturation Cloud appears but DOES NOT touch Small Price Blob
SMALL TIPS
Saturation Clouds
When the Saturation Clouds appear, it is an indication of strong price decision.
If it appears but it is far from the Small Blob then this indicates Price Reversal.
Most likely a nice moment to enter an opposite trend trade.
If the cloud appears touching the Small Blob and the Small Blob enters the cloud, this is Trend Confirmation.
The price is going to go strongly towards the Trend is is on.
Most likely a nice moment to enter an accompanying trend trade.
Price Bounce
The Small Blob bounces inside the Big Blob. This is very useful for numerous short plays.
You have better chances opening longs when the price is on the Lower parts of the Blobs.
The same goes for shorts on the Upper Parts.
Slow and Fast
The color of the WMA is a very fast indicator, it's the least reliable one.
Then comes the Small Blob color, then comes the WMA itself.
Following that you have the Big Blob color, then the blue Tenkan.
And finally the Saturation Clouds are the most reliable part.
FINAL THOUGHTS
This is a publishable version of this strategy. I hope to keep working on these types of strategies, maybe even upgrading this one.
Enjoy, share and leave comments!
Ichimoku PeeksThis indicator uses the Ichimoku Tenkan / Kijun trend line formulas to predict what those values will be in the future if current price action does not violate the period highs and lows.
Because of the way Ichimoku formulates the trend, it contains (but does not visualize) this predictive information in a way that moving averages do not.
Sharp chart readers can infer upcoming changes by counting back candles, but the process can be automated, as I've shown here.
This description does not seem to be editable so implementation details and usage will be covered in code commentary.
[_ParkF]MDRPThis indicator indicates that 'Momentum Discrepancy Reversal Point' = 'MDRP'.
Mixing and modifying several general indicators to find support and resistance
It is created to predict the change point of the trend by overlaying it on the chart.
The 4 support and resistance lines are drawn live, and the changed support and resistance lines are
It erases the line and overlays it again with a new line.
For each support and resistance , you can modify the color or line thickness, number of expressions, etc. in the input menu.
1. _____RSI-SR
Based on Wilder's RSI formula, overbought and oversold
Changes are detected and overlaid on the chart in the form of 2 resistances and 2 supports.
2. _____STOCHRSI-SR
Using the general stochastic and Wilder's RSI calculations,
Detect changes in overbought and oversold areas
It overlays the chart in the form of 1 resistance and 1 support.
3. _____PV-SR
Pivot-based support and resistance will be overlaid on the chart,
By default, 10 pivot lines are drawn, but by modifying the count in the input menu,
You can modify the number of overlays.
4. _____FVG
'Fair value gaps' refers to gaps within consecutive candles.
This section is overlaid in the form of a box,
The default is to draw 10 FVG boxes, but set count in the input menu.
You can modify the number of overlays by editing.
5. _____ZIGZAG
This is to find MDRP by overlaying the low and high prices of the current trend on the chart.
ZIGZAG labels near supports and resistances of 1, 2, 3 and 4 can increase the reliability of the MDRP.
The default value of live in the input menu is true, but if it is false, the closing price is checked and drawn.
Reduce false signals.
6. _____ICHIMOKU
The 5 lines of ICHIMOKU were overlaid with the default values of 9, 26, 52, 26,
Lines other than LeadLine A and B that are overlaid on the chart are overlaid on the chart only as much as the period value of each line.
* The _____FVG indicator cited the source of 'makuchaku'.
------------------------------------------------------------------------------------------------------------------------------------------------------------------------
이 지표는 'Momentum Discrepancy Reversal Point' = 'MDRP'를
찾기 위해 여러개의 일반적 지표들을 혼합, 수정하여 지지와 저항의 형태로
차트에 overlay 시켜 트렌드의 변화 지점을 예측 하기 위해 만들어졌습니다.
4개의 지지와 저항선은 실시간으로 그려지게 되며, 변화된 지지와 저항은 기존의
선을 지우고 새로운 선으로 다시 표시 됩니다.
각 지지와 저항은 input 메뉴에서 색 또는 선의 두께, 표현할 개수 등을 수정할 수 있습니다.
1. _____RSI-SR
Wilder's RSI 계산식을 기반으로 과매수, 과매도 영역에서의
변화를 감지하여 2개의 저항과 2개의 지지의 형태로 차트에 표시 됩니다.
2. _____STOCHRSI-SR
일반적 스토캐스틱과 Wilder's RSI의 계산식을 이용하여
과매수, 과매도 영역에서의 변화를 감지하여
1개의 저항과 1개의 지지의 형태로 차트에 표시됩니다.
3. _____PV-SR
Pivot을 기반으로 한 지지와 저항을 차트에 표시 하게 되며,
기본값은 10개의 Pivot선이 그려지게 되지만 input 메뉴에서 count를 수정하여
표시할 개수를 수정할 수 있습니다.
4. _____FVG
'Fair value gaps'는 연속된 캔들 안에서의 갭 구간을 말합니다.
이 구간을 박스의 형태로 표시한 것이며,
기본값은 10개의 FVG 박스가 그려지게 되지만 input 메뉴에서 count를
수정하여 표시할 개수를 수정할 수 있습니다.
5. _____ZIGZAG
현재 트렌드의 저가와 고가를 차트에 표시하여 MDRP를 찾기 위한 것으로
1, 2, 3, 4의 지지와 저항 부근에서의 ZIGZAG 라벨은 MDRP의 신뢰도를 높혀줄 수 있습니다.
input 메뉴에서의 live 기본값은 체크되어 있지만 체크를 해제하면 종가를 확인하고 그려지기에
거짓 신호를 줄일 수 있습니다.
6. _____ICHIMOKU
ICHIMOKU의 5개의 선은 기본값인 9, 26, 52, 26으로 표시하였으며,
차트에 표시되는 선행스팬 1과 2를 제외한 전환선, 기준선, 후행스팬은 각 선의 기간값만큼만 차트에 표시 되게 하였습니다.
Best Ichimoku Buy and Sell with alertsThis is Indicator is based on Ichimoku Clouds with Buy and Sell positions and alerts. Before using this indicator take note of the following:
1. This indicator is not Repaiting.
2. there are three ways to put your SL/TP:
* you can use the yellow line above or below the candles to put your SL and your R/R ratio will be 1:1, 1:2, 1:3 (depending on the timeframe and the pairs you choose; I advise you to backtest in your desired timeframe and your currency pairs to choose the right R/R)
* You can choose SL/TP based on Percentage or ATR (It is configurable in the setting; I again advise you to backtest in your desired timeframe and your currency pairs to choose the right R/R)
3. Please pay attention to the Green and Red circles. If there is a Green circle before the Buy position it gives it more confirmation and if there is a Red circle before the Sell position it gives more confirmation on the Sell position (pay attention that these circles appear with latency)
4. If the yellow line is below the candles and it gives Sell signal or the yellow line is above the candles and it gives Buy signal, it is better to avoid that signals.
4. Use this indicator with top 30 Crypto pairs (You can also backtest on other coins as well)
5. Please use this indicator at your discretion and backtest first.
6. If you have any idea to improve the results please let me know in the comments.
[_ParkF]MDRPThis indicator indicates that 'Momentum Discrepancy Reversal Point' = 'MDRP'.
Mixing and modifying several general indicators to find support and resistance
It is created to predict the change point of the trend by overlaying it on the chart.
The 4 support and resistance lines are drawn live, and the changed support and resistance lines are
It erases the line and overlays it again with a new line.
For each support and resistance, you can modify the color or line thickness, number of expressions, etc. in the input menu.
1. _____RSI-SR
Based on Wilder's RSI formula, overbought and oversold
Changes are detected and overlaid on the chart in the form of 2 resistances and 2 supports.
2. _____STOCHRSI-SR
Using the general stochastic and Wilder's RSI calculations,
Detect changes in overbought and oversold areas
It overlays the chart in the form of 1 resistance and 1 support.
3. _____PV-SR
Pivot-based support and resistance will be overlaid on the chart,
By default, 10 pivot lines are drawn, but by modifying the count in the input menu,
You can modify the number of overlays.
4. _____FVG
'Fair value gaps' refers to gaps within consecutive candles.
This section is overlaid in the form of a box,
The default is to draw 10 FVG boxes, but set count in the input menu.
You can modify the number of overlays by editing.
5. _____ZIGZAG
This is to find MDRP by overlaying the low and high prices of the current trend on the chart.
ZIGZAG labels near supports and resistances of 1, 2, 3 and 4 can increase the reliability of the MDRP.
The default value of live in the input menu is true, but if it is false, the closing price is checked and drawn.
Reduce false signals.
6. _____ICHIMOKU
The 5 lines of ICHIMOKU were overlaid with the default values of 9, 26, 52, 26,
Lines other than LeadLine A and B that are overlaid on the chart are overlaid on the chart only as much as the period value of each line.
* The _____FVG indicator cited the source of 'makuchaku'.
------------------------------------------------------------------------------------------------------------------------------------------------------------------------
이 지표는 'Momentum Discrepancy Reversal Point' = 'MDRP'를
찾기 위해 여러개의 일반적 지표들을 혼합, 수정하여 지지와 저항의 형태로
차트에 overlay 시켜 트렌드의 변화 지점을 예측 하기 위해 만들어졌습니다.
4개의 지지와 저항선은 실시간으로 그려지게 되며, 변화된 지지와 저항은 기존의
선을 지우고 새로운 선으로 다시 표시 됩니다.
각 지지와 저항은 input 메뉴에서 색 또는 선의 두께, 표현할 개수 등을 수정할 수 있습니다.
1. _____RSI-SR
Wilder's RSI 계산식을 기반으로 과매수, 과매도 영역에서의
변화를 감지하여 2개의 저항과 2개의 지지의 형태로 차트에 표시 됩니다.
2. _____STOCHRSI-SR
일반적 스토캐스틱과 Wilder's RSI의 계산식을 이용하여
과매수, 과매도 영역에서의 변화를 감지하여
1개의 저항과 1개의 지지의 형태로 차트에 표시됩니다.
3. _____PV-SR
Pivot을 기반으로 한 지지와 저항을 차트에 표시 하게 되며,
기본값은 10개의 Pivot선이 그려지게 되지만 input 메뉴에서 count를 수정하여
표시할 개수를 수정할 수 있습니다.
4. _____FVG
'Fair value gaps'는 연속된 캔들 안에서의 갭 구간을 말합니다.
이 구간을 박스의 형태로 표시한 것이며,
기본값은 10개의 FVG 박스가 그려지게 되지만 input 메뉴에서 count를
수정하여 표시할 개수를 수정할 수 있습니다.
5. _____ZIGZAG
현재 트렌드의 저가와 고가를 차트에 표시하여 MDRP를 찾기 위한 것으로
1, 2, 3, 4의 지지와 저항 부근에서의 ZIGZAG 라벨은 MDRP의 신뢰도를 높혀줄 수 있습니다.
input 메뉴에서의 live 기본값은 체크되어 있지만 체크를 해제하면 종가를 확인하고 그려지기에
거짓 신호를 줄일 수 있습니다.
6. _____ICHIMOKU
ICHIMOKU의 5개의 선은 기본값인 9, 26, 52, 26으로 표시하였으며,
차트에 표시되는 선행스팬 1과 2를 제외한 전환선, 기준선, 후행스팬은 각 선의 기간값만큼만 차트에 표시 되게 하였습니다.
Ichimoku Kinko Hyo [+Conditions]version 5 script - Future Cloud visible at real-time
This Ichimoku Indicator has 30 conditions identified for usage such:
Thick cloud identification (relative to the historic cloud thickness), Chikou in open area, Thin cloud identification (Relative to %), Price movements near Tenkan and Kijun and many more.
p.s. use 'calc_on_every_tick=false' in strategies to avoid repainting
Fukuiz Octa-EMA + Ichimoku (Strategy)This strategy is based EMA of 8 different period and Ichimoku Cloud which works better in 1hr 4hr and daily time frame.
#A brief introduction to Ichimoku #
The Ichimoku Cloud is a collection of technical indicators that show support and resistance levels, as well as momentum and trend direction. It does this by taking multiple averages and plotting them on a chart. It also uses these figures to compute a “cloud” that attempts to forecast where the price may find support or resistance in the future.
#A brief introduction to EMA#
An exponential moving average ( EMA ) is a type of moving average (MA) that places a greater weight and significance on the most recent data points. The exponential moving average is also referred to as the exponentially weighted moving average . An exponentially weighted moving average reacts more significantly to recent price changes than a simple moving average ( SMA ), which applies an equal weight to all observations in the period.
#How to use#
The strategy will give entry points itself, you can monitor and take profit manually(recommended), or you can use the exit setup.
EMA (Color) = Bullish trend
EMA (Gray) = Bearish trend
#Condition#
Buy = All Ema (color) above the cloud.
SELL= All Ema turn to gray color.
Ichimoku Cloud Smooth OscillatorThe Ichimoku Cloud is a powerful indicator to track trends. By smoothing it and placing it in a separate chart, the signals can be easily identified without cluttering the display. The bold line is the signal: green indicates a buy signal while red indicates a sell signal. Gray represents a possible change in direction and the lack of a trend. The thinner line is the width of the cloud which can be used to further determine the direction.
MTF Ichimoku Cross MonitorIchimoku Kinko Hyo is a technical analysis method that builds on candlestick charting to improve the accuracy of forecast price moves and Crossing TenkanSen ((HH + LL)/2 for the last 9 periods) & KijunSen (HH + LL)/2 for the last 26 periods) is One of major strategies on Ichimoku.
This Indicator build for Monitor Tenkansen & Kijunsen Lines status and you can watch 3 Time Frames Status on one bar and in one timeframe.
You can select timeframe and set Inputs for lines from Indicator setting.
Good trading to all ...