Dexie Indicator v1.0The Dexie Indicator is a complete Forex trading system built for the 5 min chart. It is suitable for Nadex users and provides BUY/SELL signals with alerts and comes with a series of 8 custom built Moving Averages designed to reduce the need for chart drawing.
This indicator can be used by beginners out of the box and requires very little trading experience to be successful.
The more advanced trader can work with this tool to greatly increase their success rate and make for a much more enjoyable trading experience.
Please contact for more details.
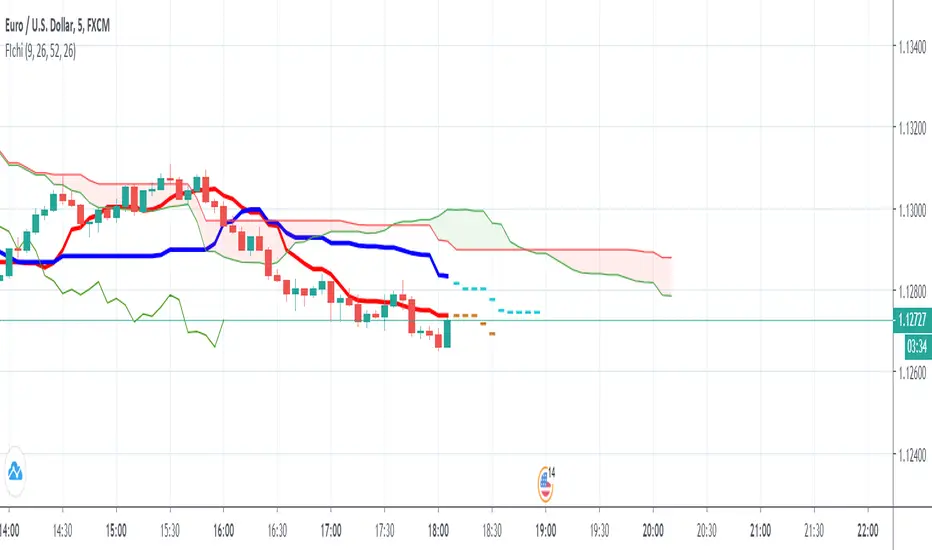
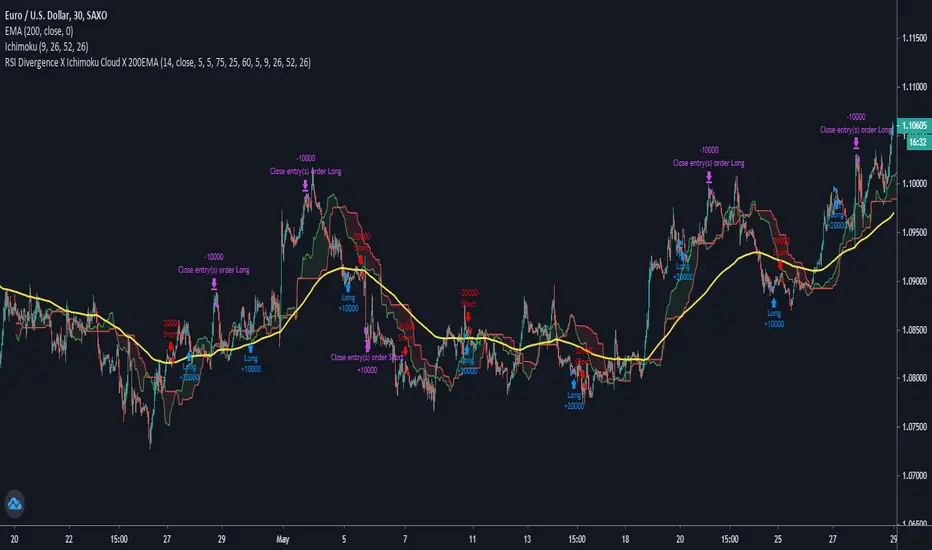
Dexie Indicator with BUY/SELL signals displayed only:
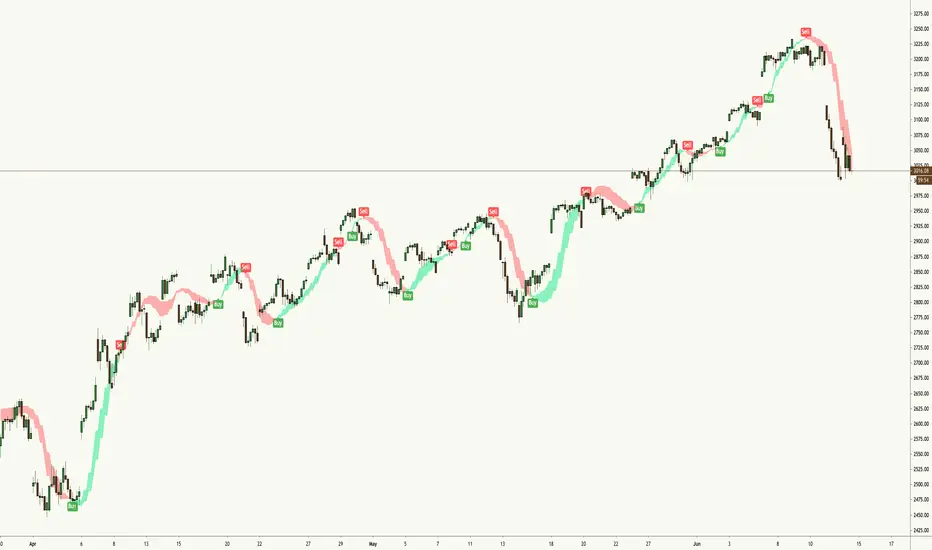
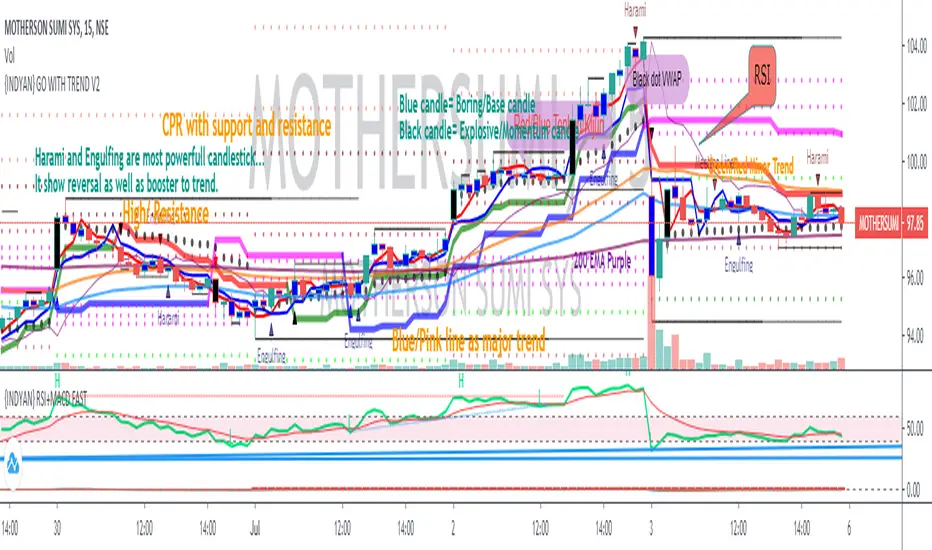
Dexie Indicator with BUY/SELL signals, Bollinger Bands and custom Moving Averages
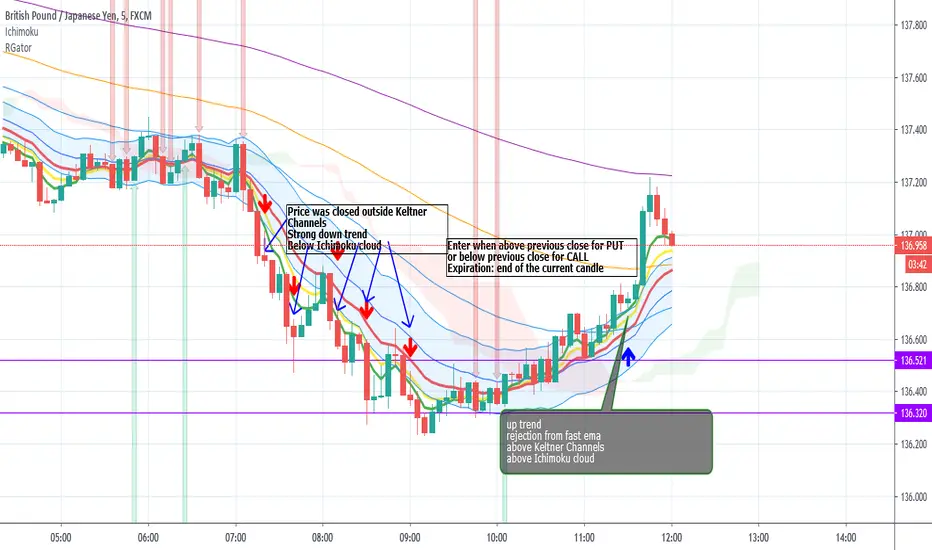
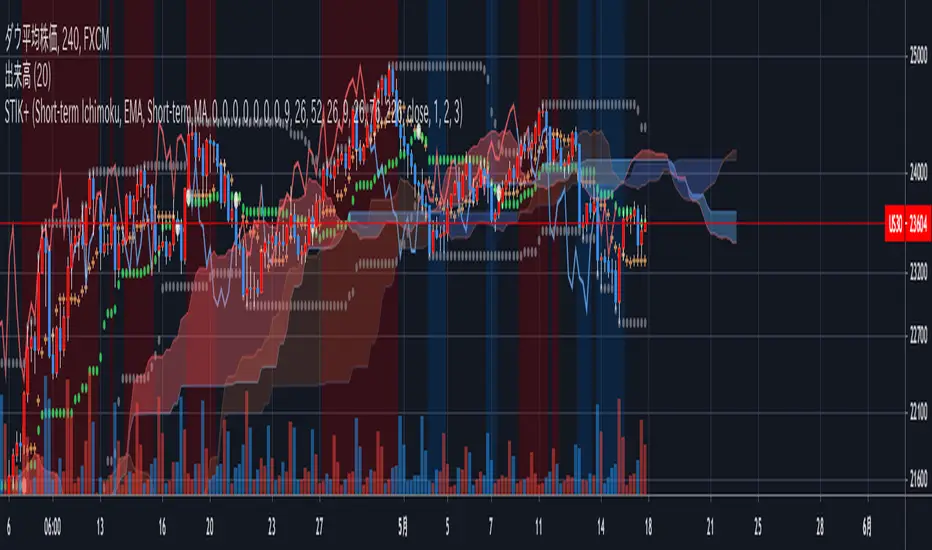
Dexie Indicator with all custom Moving Averages displayed
Penunjuk Pine Script®