ICT IPDA Lookback / Cast-forwardThis script automatically displays 20/40/60 daily range highs and lows.
Known as IPDA ranges, a term popularised by Inner Circle Trader (ICT). IPDA = Interbank Price Delivery Algorithm.
You can also add 80 day lines (my own addition) . IPDA labels are shown for Daily highs, and an equivalent line is drawn at IPDA Daily lows - but without the label to keep your chart as clean as possible. You can use this on hourly timeframes as well.
ICT is "flexible" on IPDA data ranges in his mentorship regarding whether you should use the first day of each month, or go recalculate day by day, and that's why this script lets you do both + also has an option to set a hard specified date - useful for more advanced purposes.
You can also Cast-forward the displayed 20/40/60 (+80) IPDA ranges with this tool.
You can use IPDA ranges to forecast Highs and Lows that price will be attracted to on a Daily timeframe and where price is in its P/D range, being in a discount or premium. You can also use this knowledge to help guide lower timeframe scalps.
Longer term traders can reference the 40 and 60 Day Look Back lines for an indication of current market conditions.
Ipda

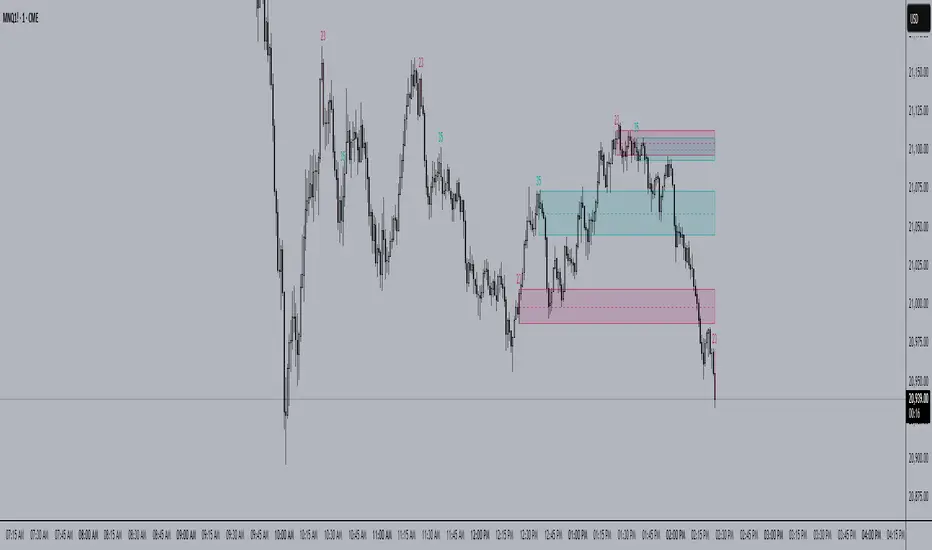
23/35 SR Channels23/35 SR Channels Indicator
The 23/35 SR Channels Indicator is designed to automatically identify key algorithmic support and resistance zones during intraday trading by focusing on specific candle patterns at the 23rd and 35th minutes of each hour.
How It Works:
Key Candle Detection:
The indicator monitors the 23rd and 35th minute candles of every hour. At these moments, it uses the candle’s high and low (or a three‑candle range centered on those minutes) to define the boundaries of a support/resistance channel.
Channel Construction and Mitigation:
Once a channel is formed from a key candle, a rectangular box is drawn to represent the channel. If a new channel (from a later 23 or 35 minute candle) overlaps an existing channel of the same type, the older channel is automatically considered "mitigated" and is removed from the chart, ensuring that only the most recent (and typically more relevant) level is displayed.
Visual Enhancement:
The indicator can also color the 23 and 35 minute candles, making them easier to identify. The channels themselves extend to the right for a fixed number of bars, providing a visual area where price might interact with these important levels, or can be extended to the current bar/until mitigated.
Benefits for Traders:
Automated Level Detection:
By focusing on the 23rd and 35th minute candles, the indicator automatically captures key support/resistance zones without manual intervention.
Dynamic Channel Updates:
As new candles form, overlapping channels are replaced with newer ones, helping to keep the chart clear and focused on the most relevant levels.
Intraday Focus:
The targeted timing helps intraday traders quickly spot potential reversal or breakout areas, enhancing decision-making during fast-moving markets.
ICT IPDA Liquidity Matrix By AlgoCadosThe ICT IPDA Liquidity Matrix by AlgoCados is a sophisticated trading tool that integrates the principles of the Interbank Price Delivery Algorithm (IPDA), as taught by The Inner Circle Trader (ICT). This indicator is meticulously designed to support traders in identifying key institutional levels and liquidity zones, enhancing their trading strategies with data-driven insights. Suitable for both day traders and swing traders, the tool is optimized for high-frequency and positional trading, providing a robust framework for analyzing market dynamics across multiple time horizons.
# Key Features
Multi-Time Frame Analysis
High Time Frame (HTF) Levels : The indicator tracks critical trading levels over multiple days, specifically at 20, 40, and 60-day intervals. This functionality is essential for identifying long-term trends and significant support and resistance levels that aid in strategic decision-making for swing traders and positional traders.
Low Time Frame (LTF) Levels : It monitors price movements within 20, 40, and 60-hour intervals on lower time frames. This granularity provides a detailed view of intraday price actions, which is crucial for scalping and short-term trading strategies favored by day traders.
Daily Open Integration : The indicator includes the daily opening price, providing a crucial reference point that reflects the market's initial sentiment. This feature helps traders assess the market's direction and volatility, enabling them to make informed decisions based on the day's early movements, which is particularly useful for day trading strategies.
IPDA Reference Points : By leveraging IPDA's 20, 40, and 60-period lookbacks, the tool identifies Key Highs and Lows, which are used by IPDA as Draw On Liquidity. IPDA is an electronic and algorithmic system engineered for achieving price delivery efficiency, as taught by ICT. These reference points serve as benchmarks for understanding institutional trading behavior, allowing traders to align their strategies with the dominant market forces and recognize institutional key levels.
Dynamic Updates and Overlap Management : The indicator is updated daily at the beginning of a new daily candle with the latest market data, ensuring that traders operate with the most current information. It also features intelligent overlap management that prioritizes the most relevant levels based on the timeframe hierarchy, reducing visual clutter and enhancing chart readability.
Comprehensive Customization Options : Traders can tailor the indicator to their specific needs through an extensive input menu. This includes toggles for visibility, line styles, color selections, and label display preferences. These customization options ensure that the tool can adapt to various trading styles and preferences, enhancing user experience and analytical capabilities.
User-Friendly Interface : The tool is designed with a user-friendly interface that includes clear, concise labels for all significant levels. It supports various font families and sizes, making it easier to interpret and act upon the displayed data, ensuring that traders can focus on making informed trading decisions without being overwhelmed by unnecessary information.
# Usage Note
The indicator is segmented into two key functionalities:
LTF Displays : The Low Time Frame (LTF) settings are exclusive to timeframes up to 1 hour, providing detailed analysis for intraday traders. This is crucial for traders who need precise and timely data to make quick decisions within the trading day.
HTF Displays : The High Time Frame (HTF) settings apply to the daily timeframe and any shorter intervals, allowing for comprehensive analysis over extended periods. This is beneficial for swing traders looking to identify broader trends and market directions.
# Inputs and Configurations
BINANCE:BTCUSDT
Offset: Adjustable setting to shift displayed data horizontally for better visibility, allowing traders to view past levels and make informed decisions based on historical data.
Label Styles: Choose between compact or verbose label formats for different levels, offering flexibility in how much detail is displayed on the chart.
Daily Open Line: Customizable line style and color for the daily opening price, providing a clear visual reference for the start of the trading day.
HTF Levels: Configurable high and low lines for HTF with options for style and color customization, allowing traders to highlight significant levels in a way that suits their trading style.
LTF Levels: Similar customization options for LTF levels, ensuring flexibility in how data is presented, making it easier for traders to focus on the most relevant intraday levels.
Text Utils: Settings for font family, size, and text color, allowing for personalized display preferences and ensuring that the chart is both informative and aesthetically pleasing.
# Advanced Features
Overlap Management : The script intelligently handles overlapping levels, particularly where multiple timeframes intersect, by prioritizing the more significant levels and removing redundant ones. This ensures that the charts remain clear and focused on the most critical data points, allowing traders to concentrate on the most relevant market information.
Real-Time Updates : The indicator updates its calculations at the start of each new daily bar, incorporating the latest market data to provide timely and accurate trading signals. This real-time updating is crucial for traders who rely on up-to-date information to execute their strategies effectively and make informed trading decisions.
# Example Use Cases
Scalpers/Day traders: Can utilize the LTF features to make rapid decisions based on hourly market movements, identifying short-term trading opportunities with precision.
Swing Traders: Will benefit from the HTF analysis to identify broader trends and key levels that influence longer-term market movements, enabling them to capture significant market swings.
By providing a clear, detailed view of key market dynamics, the ICT IPDA Liquidity Matrix by AlgoCados empowers traders to make more informed and effective trading decisions, aligning with institutional trading methodologies and enhancing their market understanding.
# Usage Disclaimer
This tool is designed to assist in trading decisions, but it should be used in conjunction with other analysis methods and risk management strategies. Trading involves significant risk, and it is essential to understand the market conditions thoroughly before making trading decisions.

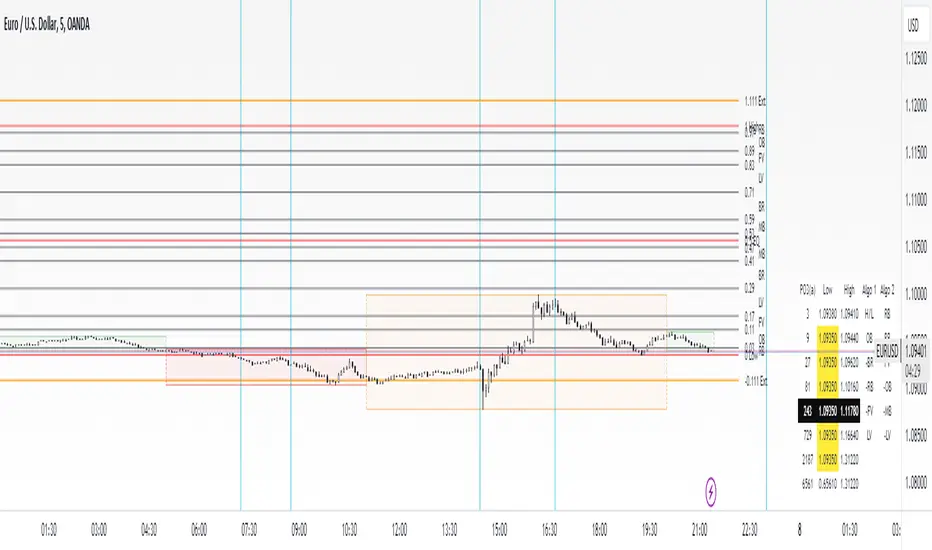
itradesize /\ IPDA Look Back - for any timeframeThe script automatically calculates the 20-40-60 look-back periods and their premium and discount ranges.
The base concept is from ICT’s IPDA which should be applied to the daily timeframe but now you can use that same concept on the lower timeframes .
The higher the timeframes you use the more reliable it will be ( when we are talking about lower timeframes than Daily ).
- With the use of the indicator you can apply it on any timeframe with ease.
- You can customize the coloring of premium & discount, frame lines, and even the look of it.
- Hide or show the EQ levels
Below the IPDA texts the indicator shows the actual percentage of the selected range based on the current price fluctuations.
The script handles the 20-40-60 days look-back as fractals so it can be applied on lower timeframes.
The basics:
- The Interbank Price Delivery Algorithm (IPDA): The algorithm creates a shift on the daily chart every 20, 40, and 60 trading days.
- These are the IPDA look-back periods. Every 20 trading days or so there is a new liquidity pool forming on both sides of the market based on ICT concepts.
- Determine the IPDA Data Range of the land 20 trading days.
- Note the highest high & lowest low in the past 20 trading days. Identify the institutional order flow and mark the relevant PD arrays in the selected IPDA look-back period we deemed useful for our trading style.
- This is your current dealing range.
- If the price consolidates for 20 days, consider switching to a 40-day look back.
Inside this dealing range, we look for the next draw on liquidity. Is it reaching for a liquidity pool or is it looking to rebalance at a particular PD Array. This is going to the Bias.
Which IPDA data range should you use?
IPDA20 can be our Short Term range - fit for intraday traders at most
IPDA40 can be our Swing Trade range - have a clear indication of the market profile
IPDA60 can be our range for position trading - have a clear indication of the market profile

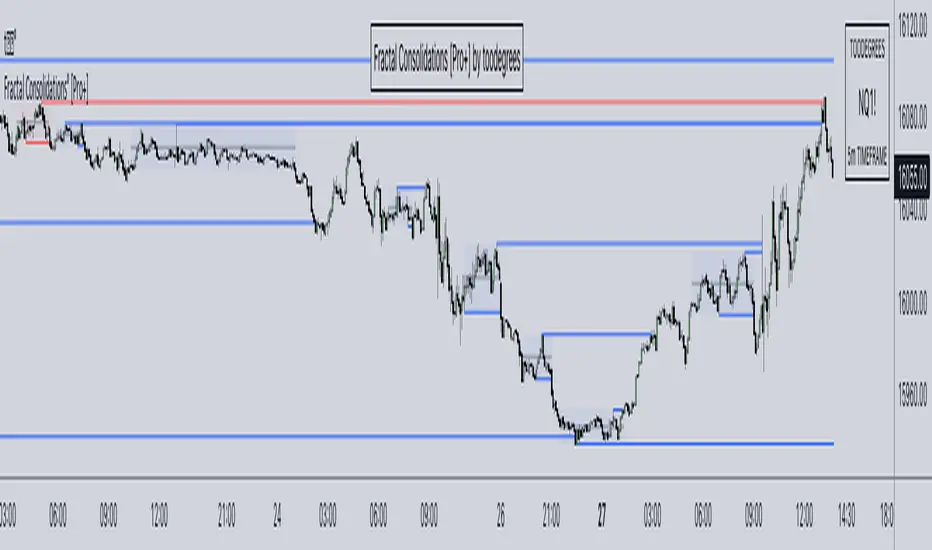
Fractal Consolidations [Pro+]Introduction:
Fractal Consolidations Pro+ pushes the boundaries of Algorithmic Price Delivery Analysis. Tailored for traders seeking precision and efficiency to unlock hidden insights, this tool empowers you to dissect market Consolidations on your terms, live, in all asset classes.
What is a Fractal Consolidation?
Consolidations occur when price is trading in a range. Normally, Consolidation scripts use a static number of "lookback candles", checking whether price is continuously trading inside the highest and lowest price points of said Time window.
After years spent studying price action and numerous programming attempts, this tool succeeds in veering away from the lookback candle approach. This Consolidation script harnesses the delivery mechanisms and Time principles of the Interbank Price Delivery Algorithm (IPDA) to define Fractal Consolidations – solely based on a Timeframe Input used for context.
Description:
This concept was engineered around price delivery principles taught by the Inner Circle Trader (ICT). As per ICT, it's integral for an Analyst to understand the four phases of price delivery: Consolidation , Expansion , Retracement , and Reversal .
According to ICT, any market movement originates from a Consolidation, followed by an Expansion .
When Consolidation ranges begin to break and resting liquidity is available, cleaner Expansions will take place. This tool's value is to visually aid Analysts and save Time in finding Consolidations in live market conditions, to take advantage of Expansion moves.
CME_MINI:ES1! 15-Minute Consolidation setting up an Expansion move, on the 10 Minute Chart:
Fractal Consolidations Pro+ doesn't only assist in confirming Higher Timeframe trend continuations and exposing opportunities on Lower Timeframes. It's also designed for both advanced traders and new traders to save Time and energy in navigating choppy or rangebound environments.
CME_MINI:ES1! 30 Minute Consolidation forming Live, on the 5 Minute Chart:
By analyzing past price action, traders will find algorithmic signatures when Consolidations are taking place, therefore providing a clearer view of where and when price is likely to contract, continue consolidating, breakout, retrace, or reverse. A prominent signature to consider when using this script is ICT's Market Maker Buy/Sell Models. These signatures revolve around the engineering of Consolidations to manipulate price in a specific direction, to then reverse at the appropriate Time. Each stage of the Market Maker Model can be identified and taken advantage of using Fractal Consolidations.
CME_MINI:NQ1! shift of the Delivery Curve from a Sell Program to a Buy Program, Market Maker Buy Model
Key Features:
Tailored Timeframes: choose the Timeframe that suits your model. Whether you're a short-term enthusiast eyeing 1 Hour Consolidations or a long-term trend follower analyzing 4 Hour Consolidations, this tool gives you the freedom to choose.
FOREXCOM:EURUSD Fractal Consolidations on a 15 Minute Chart:
Auto-Timeframe Convenience: for those who prefer a more dynamic and adaptive approach, our Auto Timeframe feature effortlessly adjusts to the most relevant Timeframe, ensuring you stay on top of market consolidations without manually adjusting settings.
Consolidation Types: define consolidations as contractions of price based on either its wick range or its body range.
COMEX:GC1! 4 Hour Consolidation differences between Wick-based and Body-based on a 1 Hour Chart:
Filtering Methods: combine previous overlapping Consolidations, merging them into one uniform Consolidation. This feature is subject to repainting only while a larger Consolidation is forming , as smaller Consolidations are confirmed. However once established, the larger Consolidation will not repaint .
FOREXCOM:GBPUSD 15 Minute Consolidation Differences between Filter Consolidations ON and OFF:
IPDA Data Range Filtering: this feature gives the Analyst control for selective visibility of Consolidations in the IPDA Data Range Lookback . The Analyst can choose between 20, 40, and 60 days as per ICT teachings, or manually adjust through Override.
INDEX:BTCUSD IPDA40 Data Range vs. IPDA20 Data Range:
Extreme Float: this feature provides reference points when the price is outside the highest or lowest liquidity levels in the chosen IPDA Data Range Lookback. These Open Float Extremes offer critical insights when the market extends beyond the Lookback Consolidation Liquidity Levels . This feature helps identify liquidity extremes of interest that IPDA will consider, which is crucial for traders in understanding market movements beyond the IPDA Data Ranges.
INDEX:ETHUSD Extreme Float vs. Non-Extreme Float Liquidity:
IPDA Override: the Analyst can manually override the default settings of the IPDA Data Range Lookback, enabling more flexible and customized analysis of market data. This is particularly useful for focusing on recent price actions in Lower Timeframes (like viewing the last 3 days on a 1-minute timeframe) or for incorporating a broader data range in Higher Timeframes (like using 365 days to analyze Weekly Consolidations on a daily timeframe).
Liquidity Insight: gain a deeper understanding of market liquidity through customizable High Resistance Liquidity Run (HRLR) and Low Resistance Liquidity Run (LRLR) Consolidation colors. This feature helps distinguishing between HRLR (high resistance, delayed price movement) and LRLR (low resistance, smooth price movement) Consolidations, aiding in quick assessment of market liquidity types.
TVC:DXY Low Resistance vs. High Resistance Consolidation Liquidity Behaviour and Narrative:
Liquidity Raid Type: decide whether to categorize a Consolidation liquidity raid by a wick or body trading through a level.
CBOT:ZB1! Wick vs. Body Liquidity Raid Type:
Customizable User Interface: tailor the visual representation to align with your preferences. Personalize your trading experience by adjusting the colors of consolidation liquidity (highs and lows) and equilibrium, as well as line styles.
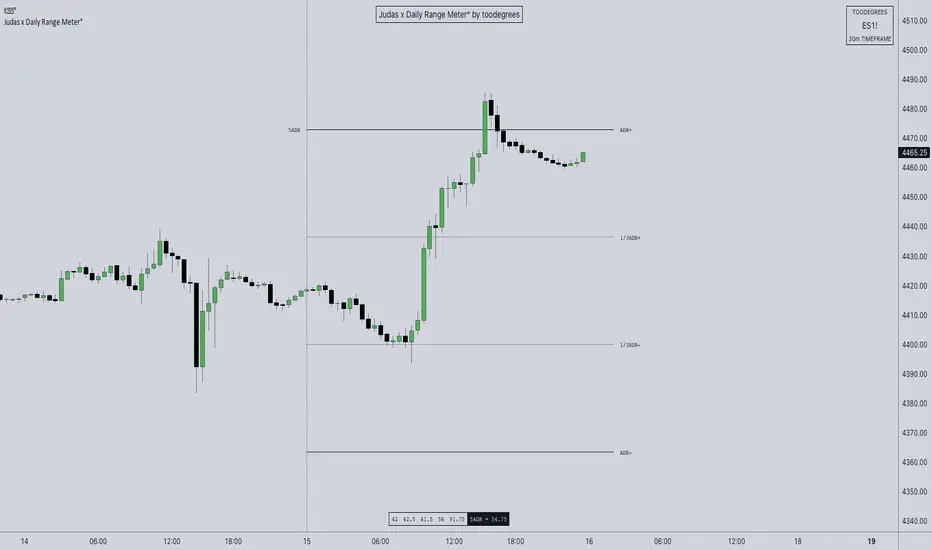
ICT ADR Levels - Judas x Daily Range Meter°The Average Daily Range (ADR) is a common metric used to measure volatility in an asset. It calculates the average difference between the highest and lowest price over a time interval – normally five days.
The Inner Circle Trader teaches the importance of this metric from an algorithmic point of view; in particular the 1/3ADR price level is deemed to be a threshold used to determine the area at which a Judas Swing – false move to trick market participants, protraction, manipulation – might exhaust. Another key difference in the ICT-use of this metric compared to the classic approach is that the average range is calculated from New York midnight Time, rather than the daily candle's open .
It is crucial to remember that the elements of Time are key when it comes to interpreting how price action will, or won't, react to this level: what Time of the day is it? what day of the week? what week of the month?
Let's consider the Time of the day. If one thinks about the Power of Three of the daily candle (Accumulation, Manipulation Distribution), it is highly unlikely that a Manipulation event will happen later in the day – whereas seeing the 1/3ADR hold in London session or New York open gives undeniable edge to an Analyst.
Apart from the 1/3ADR level seen from a Judas perspective, the opposing 1/3 level, and the full ADR projections, are excellent algorithmic levels at which we will see orderflow or reactions worth studying. These can be take profit targets, reversal opportunities, pyramid entries, ... Study them, and find what works for you!
Features:
Display a table with the previous N days' ranges and the current ADR value
Decide whether to consider daily candles, or New York (00:00 to 00:00 NY Time) for the basis of the calculation
See the ADR Range, the ADR price levels and 1/3ADR price levels by hovering over the text labels
Plot the ADR levels from the Midnight Anchor, or as offset markers on the side for a cleaner look
Show/Hide all elements individually
Examples:
– CBOT_MINI:YM1! at Equity Open
– INDEX:BTCUSD Perfect Buy Day Signature
– FX:EURUSD Clean Break = No Judas
– TSX:GC Repeated Attempts = Liquidity Engineering
Market Profile @joshuuuTime is fractal. Every candle has an open, low, high and closing price.
Depending on what timeframe you are on, some opening prices could be more interesting than others.
This indicator tracks, which timeframe you are currently on and displays different things accordingly, so that the chart is never messy.
Below the hourly timeframe, the indicator highlights ICT Killzones, times of the day where most volume occurs and price moves the "cleanest". There are different versions to display those sessions in the settings.
From the hourly timeframe up to the daily timeframe, the indicator shows the "Weekly Profile". It plots the weekly opening line, can highlight daily highs and lows and daily opens and shows the name of the days on the chart.
On the daily timeframe, the indicator switches to a monthly profile. It shows the monthly open, weekly highs/lows AND it shows another concept taught by ICT, the IPDA Lookback.
ICT teaches that especially the last 20, 40 and 60 days PD Arrays and Highs/Lows are important and this indicator highlights those lookback windows accordingly.
The indicator has a lot of settings to make it allow maximum individuality.

ICT Algorithmic Macro Tracker° (Open-Source) by toodegreesDescription:
The ICT Algorithmic Macro Tracker° Indicator is a powerful tool designed to enhance your trading experience by clearly and efficiently plotting the known ICT Macro Times on your chart.
Based on the teachings of the Inner Circle Trader , these Time windows correspond to periods when the Interbank Price Delivery Algorithm undergoes a series of checks ( Macros ) and is probable to move towards Liquidity.
The indicator allows traders to visualize and analyze these crucial moments in NY Time:
- 2:33-3:00
- 4:03-4:30
- 8:50-9:10
- 9:50-10:10
- 10:50-11:10
- 11:50-12:10
- 13:10-13:50
- 15:15-15:45
By providing a clean and clutter-free representation of ICT Macros, this indicator empowers traders to make more informed decisions, optimize and build their strategies based on Time.
Massive shoutout to @reastruth for his ICT Macros Indicator , and for allowing to create one of my own, go check him out!
Indicator Features:
– Track ongoing ICT Macros to aid your Live analysis.
- Gain valuable insights by hovering over the plotted ICT Macros to reveal tooltips with interval information.
– Plot the ICT Macros in one of two ways:
"On Chart": visualize ICT Macro timeframes directly on your chart, with automatic adjustments as Price moves.
Pro Tip: toggle Projections to see exactly where Macros begin and end without difficulty.
"New Pane": move the indicator two a New Pane to see both Live and Upcoming Macro events with ease in a dedicated section
Pro Tip: this section can be collapsed by double-clicking on the main chart, allowing for seamless trading preparation.
This indicator is available only on the TradingView platform.
⚠️ Open Source ⚠️
Coders and TV users are authorized to copy this code base, but a paid distribution is prohibited. A mention to the original author is expected, and appreciated.
⚠️ Terms and Conditions ⚠️
This financial tool is for educational purposes only and not financial advice. Users assume responsibility for decisions made based on the tool's information. Past performance doesn't guarantee future results. By using this tool, users agree to these terms.

ICT Macros by CryptoforICT Macros by Cryptofor
Time periods in which the price is most volatile. At this time, the algorithm is programmed to attack liquidity or fill a significant FVG from which the OF can continue.
Plots of macros:
1. London Macros:
02:33 - 03:00
04:03 - 04:30
2. New York AM Macros:
08:50 - 09:10
09:50 - 10:10
10:50 - 11:10
3. New York Lunch + PM Macros:
11:50 - 12:10
13:10 - 13:40
15:15 - 15:45
Features:
Flexible line settings
Flexible text settings
Display data for all time or for the last 24 hours
Switch for each type of macro
Macro background color settings

ICT MacrosThis script allows traders to visualize the range of time when a macro (an automated series of instructions/trades from large fund traders, executed by an algorithm) will likely occur in the market. It does this by drawing vertical lines and labels on the chart at these specific times:
(Macro Open) - 9:50 AM EST
(Macro Close) - 10:10 AM EST
(Macro Open) - 10:50 AM EST
(Macro Close) - 11:10 AM EST
(Macro Open) - 1:10 PM EST
(Macro Close) - 1:40 PM EST
(Macro Open) - 3:15 PM EST
(Macro Close) - 3:45 PM EST
The theory behind the use of these macros - is that the market will either seek buy side or sell side liquidity, or seek to rebalance price at a point of interest in between the open and close of the macro. Traders who follow this theory can use that information to anticipate how price might behave.
When a macro occurs, the script draws a vertical line on the chart using a dotted line style with a user-defined color. Additionally, a label is placed above the line to indicate whether it is a Macro Open or Macro Close event.
To preserve space, the labels are abbreviated on chart - "Macro Open" (M.O.) and "Macro Close" (M.C.) for both the morning and afternoon trading sessions. The labels may be turned on/off by the user.
The script also includes alerts that can notify traders when a macro occurs. These alerts can be set to go off once per bar close, and the alert message indicates the specific macro type and time.
This script is entirely open-source, meaning that traders can read the code and modify it as needed. Credit to the foundation of this script goes to TradingView user @rickyzcarroll for his open source Strat Assistant Hour Flip script. Important changes include the specific time changes and alert function.

dmn's ICT AMD-Goldbach█ OVERVIEW
This script is built on ICT time & price theory and the theory of algorithmic market maker models, and visualizes the intraday divided using powers of three into accumulation, manipulation and distribution cycles.
It also includes an automatically calculated and plotted Goldbach level (a.k.a. IPDA level or Huddleston level) overlay, to help visualize where in the current market maker profile price is in relation to the AMD cycles, and where it might trade to.
█ CONCEPTS
Accumulation, Manipulation, Distribution Cycles
A 24 hour day, with the default set to start at 20:00 CET (the start of the Forex CLS Settlement operational timeline) is split in three parts - 9, 6 and 9 hours for the three cycles (roughly corresponding with Asia, London Open and New York + London Close sessions).
Since charts are fractals, there's also intra-cycle time fibs available in the script, to highlight the smaller fractal equivalents in each cycle.
These cycles are used to visualize the three phases (AMD) for easier identification of the current daily profile by analyzing during what cycle highs and lows of the day are made.
An example of a bullish day could be price rallying before making a low during the accumulation cycle, being manipulated higher and retracing to form an optimal trade entry during the manipulation cycle, expanding and creating the high of the day before selling off during the distribution cycle, with a potential reversal before it ends.
Goldbach levels
The Goldbach levels are based on the size of a price range (or price swing, if you will) expressed as a factor of power of three (3^n).
To decide what number to tell the script to use for the calculation, we look at what 3^n number best fits an average swing on the preferred timeframe we're trading.
For example; PO3 27 (3^3)might be fit for scalping, while PO3 243 (3^5) may correspond to the daily or weekly range, depending on the asset.
The script then calculates a range high and a range low using a power of three formula based on the current price and divides it into levels using Goldbach numbers.
At these levels one might expect to see price form various "blocks" as defined in concept by Michael J. Huddleston.
The blocks that correspond to the Goldbach levels are labeled with abbreviations as follows:
Ext = External range
Low = Range low
High = Range high
FVG = Fair value gap
RB = Rejection block
OB = Order block
LV = Liquidity void
BR = Breaker
MB = Mitigation block
Using these levels and said blocks we identify where in the current running market maker profile price is offered, and trade the preferred timeframe in line with the AMD cycles accordingly.
█ FEATURES
Custom AMD time cycles session times.
Custom time fib for fractal cycles.
Color and style customization.
Show only current or also historical cycles.
Equilibrium mode for Goldbach levels (show only high/low and midpoint)
Autodetection of asset type, with manual override.
█ NOTE
The default timings for the AMD cycles are set up for Forex pairs. For other asset types, such as indices, other timings are nessecary for optimal results.
Goldbach levels requires the correct symbol type setting for the calculation to work properly. Disable the script's autodetection and enable/disable the Forex option according to the type of chart if it fails.
dmn's ICT ToolkitThis is my quality of life indicator for forex trading using the methods and concepts of ICT.
The idea is to automate marking up important price levels and times of the day instead of doing it manually every day.
Killzones
Marks the most volatile times of the day on the chart, during which the intraday high/low usually takes place.
Particularly impactful when there's news released during these times.
London Open (02:00-05:00 EST)
New York Open (08:30-11:00 EST)
London Close (10:00-11:30 EST)
True Day delineation
Vertical line at the start of the "true day" (00:00 EST), start of the algorithmic trading day and aids in visualizing the intraday direction.
New York midnight price level
Noteworthy price level at the start of the "true day".
This price level is referenced by the interbank trading algorithms during the day. Buy below it on bullish days, sell above it on bearish days.
Daily open price level
Reference level for optimal trade entries. Buy below it on bullish days, sell above it on bearish days.
Central Banks Dealers Range (CBDR) (14:00-20:00 EST) &
Central Banks Dealers Flout (CBDF) (15:00-24:00 EST) &
Asian Range (AR) (20:00-24:00 EST)
The standard deviation lines available are used to make predictions for short-term future highs/lows when the CBDR and AR are smaller than 40 pips.
Trade them by looking for 5/15min key levels that converge with the projection levels.
X days Average Daily Range (ADR)
Default to 5 days back, gives an idea of how much movement to expect intraday when the ADR high/low is converging with CBDR/CBDF/AR standard deviations.
Current Daily Range (CDR)
Used for comparison against the ADR to help determine if there's enough intraday range left to enter a trade.
Dynamically changes color based on percentage of the ADR. Green below 50% of ADR, orange between 50 and 100%, red when CDR exceeds ADR.
All of the above are used in conjunction with each other and higher timeframe levels of importance to find entries and target.
Note: Preferably use New York's time zone for your charts.

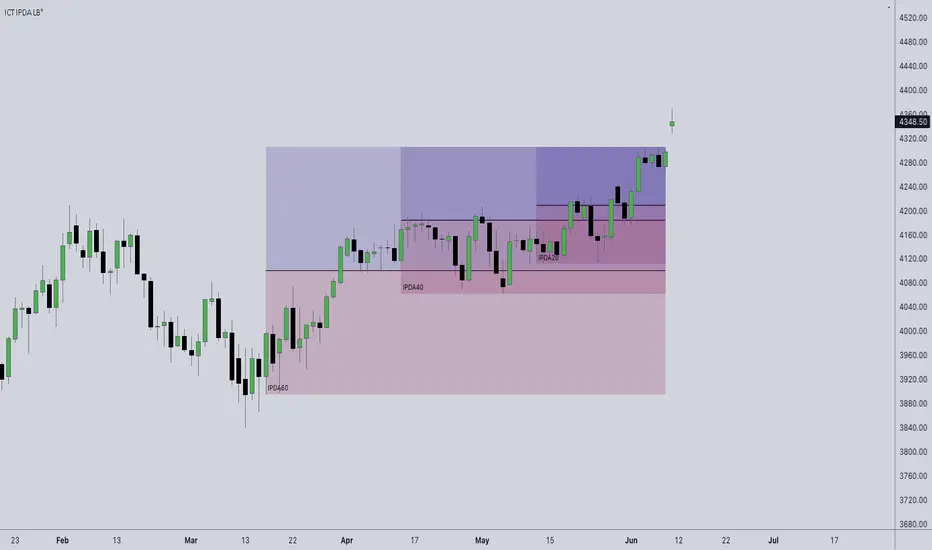
ICT Anchored IPDA RangesThis script is an anchored variation of my "ICT IPDA Look Back" script. Similarly, it calculates ICT's daily IPDA look back time intervals and their respective discount / equilibrium / premium; however, it also applies the Forward Cast IPDA daily ranges.
The Forward Cast can be used to estimate the time at which IPDA might initiate a change in institutional order flow. This depends on several factors such as time of the year, and time of daily structure break.
> IPDA Basics:
IPDA stands for Interbank Price Delivery Algorithm. Said algorithm appears to be referencing the past 20, 40 , and 60 days intervals as points of reference to define ranges and related PD arrays.
Intraday traders can find most value in the 20 Day Look Back box, by observing imbalances and points of interest.
Longer term traders can reference the 40 and 60 Day Look Back boxes for a clear indication of current market conditions.
Thanks to @atradesdaily for the suggestion.

ICT IPDA Look BackThis script automatically calculates and updates ICT's daily IPDA look back time intervals and their respective discount / equilibrium / premium, so you don't have to :)
IPDA stands for Interbank Price Delivery Algorithm. Said algorithm appears to be referencing the past 20, 40, and 60 days intervals as points of reference to define ranges and related PD arrays.
Intraday traders can find most value in the 20 Day Look Back box, by observing imbalances and points of interest.
Longer term traders can reference the 40 and 60 Day Look Back boxes for a clear indication of current market conditions.
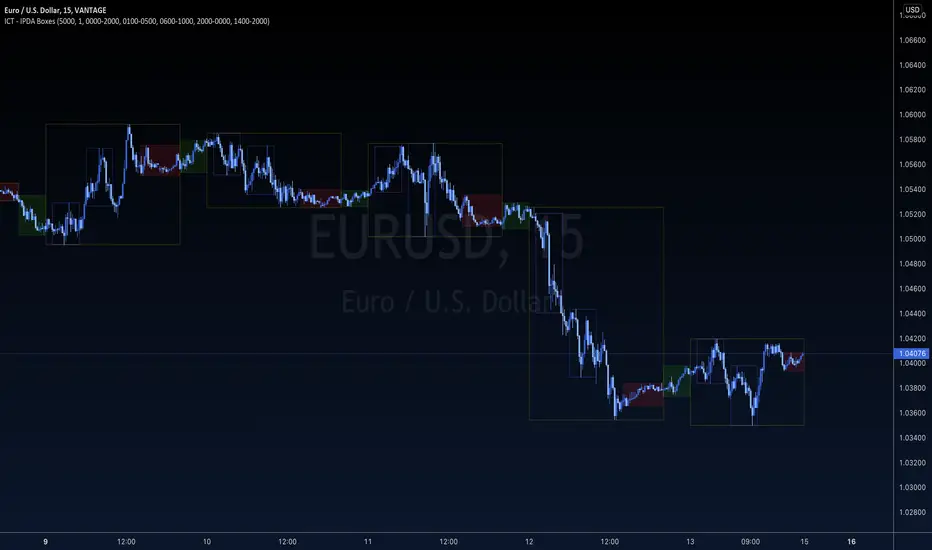
ICT - IPDA BoxesICT - IPDA Boxes indicator encapsulate important (TRUE DAY) time zones based on ICT concepts.
Standard settings will plot True Day, CBDR, Asian Range, London and NY Open Kill-Zones. It is designed to keep a minimalistic and clean look for your charts using TradingView's Dark theme, but you can adjust any specific line or background color transparency of your choice. If you want to add other session (like NY close for example), just paste again the indicator to your chart and set the correct session duration and colors of your preference. You can log, study, backtest and use it for your analysis if you are familiar with ICT concepts.
Check indicator time lines and adjust session times for your own TradingView's personal settings it before using.
ANY fault, bug or mismatch in this script is only mine and I will be glad to correct it if you let me know.
The ownership of all this concepts belongs to ICT - Michael Huddleston and it is published with his permission.
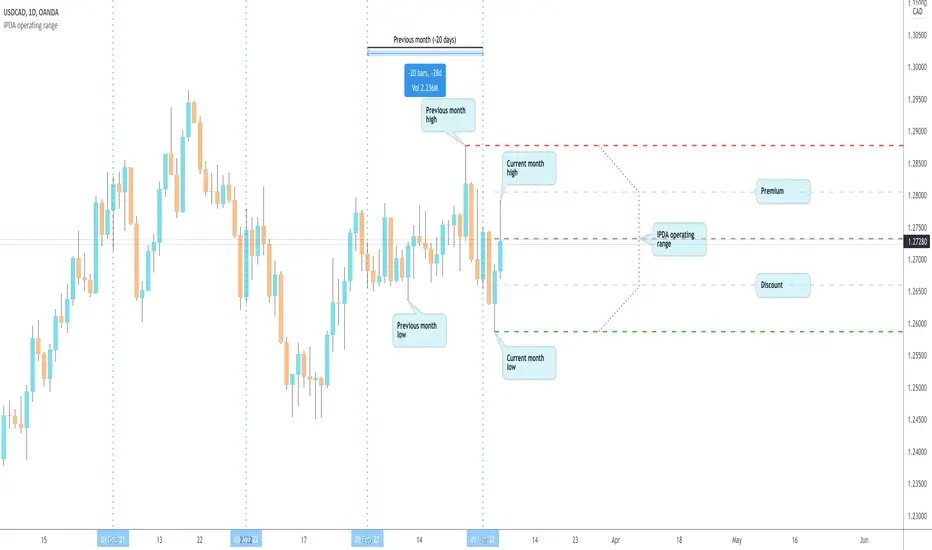
IPDA operating range by makuchakuDetermining operating range is critical for trading.
You *need* to sell in premium & buy in discount.
This script determines an operating range by stepping back on an HTF timeframe to calculate that HTF candle's range. If the current candle in HTF breaks out, the range expands accordingly.
The timeframe mapping I've used is
Intraday & <= 2H : use Daily as HTF range
Intraday & > 2H : use Weekly as HTF range
Daily : use Monthly as HTF range
Weekly : use 6 Months as HTF range
The HTF mapping is my own personal preference. If you prefer, you can easily copy the indicator and create your own mapping.
Once the HTF range is known, the indicator also plots 0%, 25%, 50% and 100% levels.