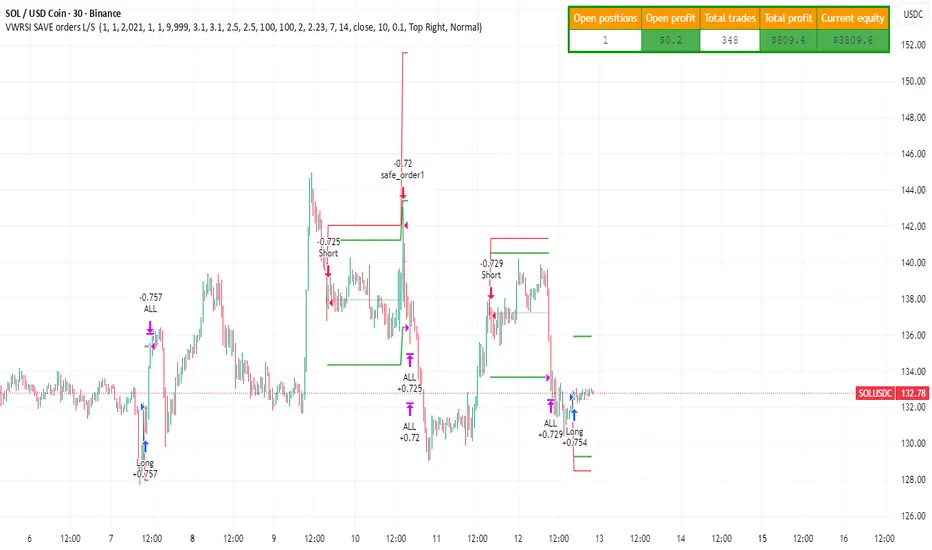
Strategy with VWRSI and SAVE orders Long or Short or BothVWRSI is very powerful indicator coded by Algo Alpha and I Make Strategy of it
But there is no stop loss instate the Strategy is using Save orders to minimize the market manipulation
The best to used is side way market with long and short enable
The Strategy trigger long or short market order -
long - ta.crossover(rsi, 20)
short - ta.crossunder(rsi, 80)
And if is not take profit from the first trade start with the save trades until will do
the sum of the first order - base order and the save order can be adjust from the user
as well the deviation from the first order
IF some user have questions let me know
Pengayun
[SM-021] Gaussian Trend System [Optimized]This script is a comprehensive trend-following strategy centered around a Gaussian Channel. It is designed to capture significant market movements while filtering out noise during consolidation phases. This version (v2) introduces code optimizations using Pine Script v6 Arrays and a new Intraday Time Control feature.
1. Core Methodology & Math
The foundation of this strategy is the Gaussian Filter, originally conceptualized by @DonovanWall.
Gaussian Poles: Unlike standard moving averages (SMA/EMA), this filter uses "poles" (referencing signal processing logic) to reduce lag while maintaining smoothness.
Array Optimization: In this specific iteration, the f_pole function has been refactored to utilize Pine Script Arrays. This improves calculation efficiency and rendering speed compared to recursive variable calls, especially when calculating deep historical data.
Channel Logic: The strategy calculates a "Filtered True Range" to create High and Low bands around the main Gaussian line.
Long Entry: Price closes above the High Band.
Short Entry: Price closes below the Low Band.
2. Signal Filtering (Confluence)
To reduce false signals common in trend-following systems, the strategy employs a "confluence" approach using three additional layers:
Baseline Filter: A 200-period (customizable) EMA or SMA acts as a regime filter. Longs are only taken above the baseline; Shorts only below.
ADX Filter (Volatility): The Average Directional Index (ADX) is used to measure trend strength. If the ADX is below a user-defined threshold (default: 20), the market is considered "choppy," and new entries are blocked.
Momentum Check: A Stochastic RSI check ensures that momentum aligns with the breakout direction.
3. NEW: Intraday Session Filter
Per user requests, a time-based filter has been added to restrict trading activity to specific market sessions (e.g., the New York Open).
How it works: Users can toggle a checkbox to enable/disable the filter.
Configuration: You can define a specific time range (Default: 09:30 - 16:00) and a specific Timezone (Default: New York).
Logic: The strategy longCondition and shortCondition now check if the current bar's timestamp falls within this window. If outside the window, no new entries are generated, though existing trades are managed normally.
4. Risk Management
The strategy relies on volatility-based exits rather than fixed percentage stops:
ATR Stop Loss: A multiple of the Average True Range (ATR) is calculated at the moment of entry to set a dynamic Stop Loss.
ATR Take Profit: An optional Reward-to-Risk (RR) ratio can be set to place a Take Profit target relative to the Stop Loss distance.
Band Exit: If the trend reverses and price crosses the opposite band, the trade is closed immediately to prevent large drawdowns.
Credits & Attribution
Original Gaussian Logic: Developed by @DonovanWalll. This script utilizes his mathematical formula for the pole filters.
Strategy Wrapper & Array Refactor: Developed by @sebamarghella.
Community Request: The Intraday Session Filter was added to assist traders focusing on specific liquidity windows.
Disclaimer: This strategy is for educational purposes. Past performance is not indicative of future results. Please use the settings menu to adjust the Session Time and Risk parameters to fit your specific asset class.

Ichimoku Kijun OPTIMISED FOR 15MIN EURUSDWhen to Enter a Trade (The Kijun Bounce)
We only enter when the market is clearly trending and we get a good pullback to the Kijun-sen (the red line).
Market Quality Check (Anti-Chop):
The price must be completely outside the Ichimoku Cloud (Kumo). This ensures we are not trading in a choppy, sideways market.
Buy (Long) Entry:
The price (low of the candle) drops down and touches the Kijun-sen (red line).
The candle then closes above the Kijun-sen, confirming the trend is holding and the bounce is real.
Sell (Short) Entry:
The price (high of the candle) rises up and touches the Kijun-sen (red line).
The candle then closes below the Kijun-sen, confirming the downtrend is holding and the rejection is real.
How to Manage Risk and Exit
We use a fixed profit target (Take Profit) and a dynamic Stop Loss (Trailing Stop) that follows the Kijun-sen.
Risk per Trade:
We risk 1.0 percent of the total account equity per trade.
The initial Stop Loss distance is limited to 1.0 times the ATR, and is strictly capped at 1.0 percent of the price to prevent any single catastrophic loss.
Take Profit (TP):
The fixed profit target is set to a 1.5 Risk to Reward ratio (1.5 R:R) . This means the profit target is 1.5 times the size of the initial stop loss.
Stop Loss (SL):
The Stop Loss is a Trailing Stop that automatically moves with the Kijun-sen (red line).
The Stop Loss will trail slightly below the Kijun-sen for a Buy trade, and slightly above the Kijun-sen for a Sell trade, protecting profits dynamically as the trend continues.
Understanding the Trade Signals
🟢🟡 The Round Dots (Entry Signals)
The small, round dots are placed directly on the candle where the strategy decided to enter a trade. The color tells you the direction:
Lime Green Dot: Signals a confirmed Long (Buy) Entry. This happens on the candle where the price successfully bounced off the Kijun-sen (red line) and closed higher, and the market was outside the Kumo (the cloud).
Red Dot: Signals a confirmed Short (Sell) Entry. This happens on the candle where the price was successfully rejected by the Kijun-sen (red line) and closed lower, and the market was outside the Kumo.
⬆️⬇️ The Arrows (Exit Signals)
The arrows appear at the exact price level where the trade was closed (exited). The direction of the arrow indicates where the exit occurred relative to the market action, but the color is more important for determining the result:
Exit Arrow (Often Green/Red): This signals a trade was closed for one of two reasons:
Take Profit (Limit Hit): The trade moved in your favor and hit the fixed 1.5 R:R profit target. This is a successful, profitable exit.
Stop Loss (Trailing Stop Hit): The market reversed against the position, and the trade was closed by the dynamic Kijun-sen Trailing Stop. This is a risk-controlled loss or a break-even exit.
The size of these arrows is the default setting used by the strategy.exit() function in Pine Script to clearly mark the exit price on the chart.
In Summary
The dots tell you when to get in (Entry) based on the Kijun Reversion rule, and the arrows tell you when you got out (Exit) due to hitting either the target profit or the trailing stop loss.

Trend Vector Pro v2.0Title: Trend Vector Pro v2.0
👨💻 Developed by: Mohammed Bedaiwi
💡 Strategy Overview & Coherence
Trend Vector Pro (TVPro) is a momentum-based trend & reversal strategy that uses a custom smoothed oscillator, an optional ADX filter, and classic Pivot Points to create a single, coherent trading framework.
Instead of stacking random indicators, TVPro is built around these integrated components:
A custom momentum engine (signal generation)
An optional ADX filter (trend quality control)
Daily Pivot Points (context, targets & S/R)
Swing-based “Golden Bar” trailing stops (trade management)
Optional extended bar detection (overextension alerts)
All parts are designed to work together and are documented below to address originality & usefulness requirements.
🔍 Core Components & Justification
1. Custom Momentum Engine (Main Signal Source)
TVPro’s engine is a custom oscillator derived from the bar midpoint ( hl2 ), similar in spirit to the Awesome Oscillator but adapted and fully integrated into the strategy. It measures velocity and acceleration of price, letting the script distinguish between strong impulses, weakening trends, and pure noise.
2. ADX Filter (Trend Strength Validation – Optional)
Uses Average Directional Index (ADX) as a gatekeeper.
Why this matters: This prevents the strategy from firing signals in choppy, non-trending environments (when ADX is below the threshold) and keeps trades focused on periods of clear directional strength.
3. Classic Pivot Points (Context & Targets)
Calculates Daily Pivot Points ( PP, R1-R3, S1-S3 ) via request.security() using prior session data.
Why this matters: Momentum gives the signal, ADX validates the environment, and Pivots add external structure for risk and target planning. This is a designed interaction, not a random mashup.
🧭 Trend State Logic (5-State Bar Coloring)
The strategy uses the momentum's value + slope to define five states, turning the chart into a visual momentum map:
🟢 STRONG BULL (Bright Green): Momentum accelerating UP. → Strong upside impulse.
🌲 WEAK BULL (Dark Green): Momentum decelerating DOWN (while positive). → Pullback/pause zone.
🔴 STRONG BEAR (Bright Red): Momentum accelerating DOWN. → Strong downside impulse.
🍷 WEAK BEAR (Dark Red): Momentum decelerating UP (while negative). → Rally/short-covering zone.
🔵 NEUTRAL / CHOP (Cyan): Momentum is near zero (based on noise threshold). → Consolidation / low volatility.
🎯 Signal Logic Modes
TVPro provides two selectable entry styles, controlled by input:
Reversals Only (Cleaner Mode – Default): Targets trend flips. Entry triggers when the current state is Bullish (or Bearish) and the previous state was not. This reduces noise and over-trading.
All Strong Pulses (Aggressive Mode): Targets acceleration phases. Entry triggers when the bar turns to STRONG BULL or STRONG BEAR after any other state. This mode produces more trades.
📌 Risk Management Tools
Golden Bars – Trailing Stops: Yellow “Trail” Arrows mark confirmed Swing Highs/Lows. These are used as logical trailing stop levels based on market structure.
Extended Bars: Detects when price closes outside a 2-standard-deviation channel, flagging overextension where a pullback is more likely.
Pivot Points: Used as external targets for Take Profit and structural stop placement.
⚙️ Strategy Defaults (Crucial for Publication Compliance)
To keep backtest results realistic and in line with House Rules, TVPro is published with the following fixed default settings:
Order Size: 5% of equity per trade ( default_qty_value = 5 )
Commission: 0.04% per order ( commission_value = 0.04 )
Slippage: 2 ticks ( slippage = 2 )
Initial Capital: 10,000
📘 How to Trade with Trend Vector Pro
Entry: Take Long when a Long signal appears and confirm the bar is Green (Bull state). Short for Red (Bear state).
Stop Loss: Place the initial SL near the latest swing High/Low, or near a relevant Pivot level.
Trade Management: Follow Golden (Trail) Arrows to trail your stop behind structure.
Exits: Exit when: the trailing stop is hit, Price reaches a major Pivot level, or an opposite signal prints.
🛑 Disclaimer
This script is for educational purposes only and does not constitute financial advice. Past performance does not guarantee future results. Always forward-test and use proper risk management before applying any strategy to live trading.

Trend Vector Pro v2.0Trend Vector Pro v2.0
👨💻 Developed by: Mohammed Bedaiwi
💡 Strategy Overview & Coherence
Trend Vector Pro (TVPro) is a momentum-based trend & reversal strategy that uses a custom smoothed oscillator, an optional ADX filter, and classic Pivot Points to create a single, coherent trading framework.
Instead of stacking random indicators, TVPro is built around these integrated components:
A custom momentum engine (signal generation)
An optional ADX filter (trend quality control)
Daily Pivot Points (context, targets & S/R)
Swing-based “Golden Bar” trailing stops (trade management)
Optional extended bar detection (overextension alerts)
All parts are designed to work together and are documented below to address originality & usefulness requirements.
🔍 Core Components & Justification
1. Custom Momentum Engine (Main Signal Source)
TVPro’s engine is a custom oscillator derived from the bar midpoint ( hl2 ), similar in spirit to the Awesome Oscillator but adapted and fully integrated into the strategy. It measures velocity and acceleration of price, letting the script distinguish between strong impulses, weakening trends, and pure noise.
2. ADX Filter (Trend Strength Validation – Optional)
Uses Average Directional Index (ADX) as a gatekeeper.
Why this matters: This prevents the strategy from firing signals in choppy, non-trending environments (when ADX is below the threshold) and keeps trades focused on periods of clear directional strength.
3. Classic Pivot Points (Context & Targets)
Calculates Daily Pivot Points ( PP, R1-R3, S1-S3 ) via request.security() using prior session data.
Why this matters: Momentum gives the signal, ADX validates the environment, and Pivots add external structure for risk and target planning. This is a designed interaction, not a random mashup.
🧭 Trend State Logic (5-State Bar Coloring)
The strategy uses the momentum's value + slope to define five states, turning the chart into a visual momentum map:
🟢 STRONG BULL (Bright Green): Momentum accelerating UP. → Strong upside impulse.
🌲 WEAK BULL (Dark Green): Momentum decelerating DOWN (while positive). → Pullback/pause zone.
🔴 STRONG BEAR (Bright Red): Momentum accelerating DOWN. → Strong downside impulse.
🍷 WEAK BEAR (Dark Red): Momentum decelerating UP (while negative). → Rally/short-covering zone.
🔵 NEUTRAL / CHOP (Cyan): Momentum is near zero (based on noise threshold). → Consolidation / low volatility.
🎯 Signal Logic Modes
TVPro provides two selectable entry styles, controlled by input:
Reversals Only (Cleaner Mode – Default): Targets trend flips. Entry triggers when the current state is Bullish (or Bearish) and the previous state was not. This reduces noise and over-trading.
All Strong Pulses (Aggressive Mode): Targets acceleration phases. Entry triggers when the bar turns to STRONG BULL or STRONG BEAR after any other state. This mode produces more trades.
📌 Risk Management Tools
🟡 Golden Bars – Trailing Stops: Yellow “Trail” Arrows mark confirmed Swing Highs/Lows. These are used as logical trailing stop levels based on market structure.
Extended Bars: Detects when price closes outside a 2-standard-deviation channel, flagging overextension where a pullback is more likely.
Pivot Points: Used as external targets for Take Profit and structural stop placement.
⚙️ Strategy Defaults (Crucial for Publication Compliance)
To keep backtest results realistic and in line with House Rules, TVPro is published with the following fixed default settings:
Order Size: 5% of equity per trade ( default_qty_value = 5 )
Commission: 0.04% per order ( commission_value = 0.04 )
Slippage: 2 ticks ( slippage = 2 )
Initial Capital: 10,000
📘 How to Trade with Trend Vector Pro
Entry: Take Long when a Long signal appears and confirm the bar is Green (Bull state). Short for Red (Bear state).
Stop Loss: Place the initial SL near the latest swing High/Low, or near a relevant Pivot level.
Trade Management: Follow Golden (Trail) Arrows to trail your stop behind structure.
Exits: Exit when: the trailing stop is hit, Price reaches a major Pivot level, or an opposite signal prints.
🛑 Disclaimer
This script is for educational purposes only and does not constitute financial advice. Past performance does not guarantee future results. Always forward-test and use proper risk management before applying any strategy to live trading.

Gyspy Bot Trade Engine - V1.2B - Strategy 12-7-25 - SignalLynxGypsy Bot Trade Engine (MK6 V1.2B) - Ultimate Strategy & Backtest
Brought to you by Signal Lynx | Automation for the Night-Shift Nation 🌙
1. Executive Summary & Architecture
Gypsy Bot (MK6 V1.2B) is not merely a strategy; it is a massive, modular Trade Engine built specifically for the TradingView Pine Script environment. While most strategies rely on a single dominant indicator (like an RSI cross or a MACD flip) to generate signals, Gypsy Bot functions as a sophisticated Consensus Algorithm.
The engine calculates data from up to 12 distinct Technical Analysis Modules simultaneously on every bar closing. It aggregates these signals into a "Vote Count" and only executes a trade entry when a user-defined threshold of concurring signals is met. This "Voting System" acts as a noise filter, requiring multiple independent mathematical models—ranging from volume flow and momentum to cyclical harmonics and trend strength—to agree on market direction before capital is committed.
Beyond entries, Gypsy Bot features a proprietary Risk Management suite called the Dump Protection Team (DPT). This logic layer operates independently of the entry modules, specifically scanning for "Moon" (Parabolic) or "Nuke" (Crash) volatility events to force-exit positions, overriding standard stops to preserve capital during Black Swan events.
2. ⚠️ The Philosophy of "Curve Fitting" (Must Read)
One must be careful when applying Gypsy Bot to new pairs or charts.
To be fully transparent: Gypsy Bot is, by definition, a very advanced curve-fitting engine. Because it grants the user granular control over 12 modules, dozens of thresholds, and specific voting requirements, it is extremely easy to "over-fit" the data. You can easily toggle switches until the backtest shows a 100% win rate, only to have the strategy fail immediately in live markets because it was tuned to historical noise rather than market structure.
To use this engine successfully, you must adopt a specific optimization mindset:
Ignore Raw Net Profit: Do not tune for the highest dollar amount. A strategy that makes $1M in the backtest but has a 40% drawdown is useless.
Prioritize Stability: Look for a high Profit Factor (1.5+), a high Percent Profitable, and a smooth equity curve.
Regular Maintenance is Mandatory: Markets shift regimes (e.g., from Bull Trend to Crab Range). Parameters that worked perfectly in 2021 may fail in 2024. Gypsy Bot settings should be reviewed and adjusted at regular intervals (e.g., quarterly) to ensure the voting logic remains aligned with current market volatility.
Timeframe Recommendations:
Gypsy Bot is optimized for High Time Frame (HTF) trend following. It generally produces the most reliable results on charts ranging from 1-Hour to 12-Hours, with the 4-Hour timeframe historically serving as the "sweet spot" for most major cryptocurrency assets.
3. The Voting Mechanism: How Entries Are Generated
The heart of the Gypsy Bot engine is the ActivateOrders input (found in the "Order Signal Modifier" settings).
The engine constantly monitors the output of all enabled Modules.
Long Votes: GoLongCount
Short Votes: GoShortCount
If you have 10 Modules enabled, and you set ActivateOrders to 7:
The engine will ONLY trigger a Buy Entry if 7 or more modules return a valid "Buy" signal on the same closed candle.
If only 6 modules agree, the trade is rejected.
This allows you to mix "Leading" indicators (Oscillators) with "Lagging" indicators (Moving Averages) to create a high-probability entry signal that requires momentum, volume, and trend to all be in alignment.
4. Technical Deep Dive: The 12 Modules
Gypsy Bot allows you to toggle the following modules On/Off individually to suit the asset you are trading.
Module 1: Modified Slope Angle (MSA)
Logic: Calculates the geometric angle of a moving average relative to the timeline.
Function: It filters out "lazy" trends. A trend is only considered valid if the slope exceeds a specific steepness threshold. This helps avoid entering trades during weak drifts that often precede a reversal.
Module 2: Correlation Trend Indicator (CTI)
Logic: Based on John Ehlers' work, this measures how closely the current price action correlates to a straight line (a perfect trend).
Function: It outputs a confidence score (-1 to 1). Gypsy Bot uses this to ensure that we are not just moving up, but moving up with high statistical correlation, reducing fake-outs.
Module 3: Ehlers Roofing Filter
Logic: A sophisticated spectral filter that combines a High-Pass filter (to remove long-term drift) with a Super Smoother (to remove high-frequency noise).
Function: It attempts to isolate the "Roof" of the price action. It is excellent at catching cyclical turning points before standard moving averages react.
Module 4: Forecast Oscillator
Logic: Uses Linear Regression forecasting to predict where price "should" be relative to where it is.
Function: When the Forecast Oscillator crosses its zero line, it indicates that the regression trend has flipped. We offer both "Aggressive" and "Conservative" calculation modes for this module.
Module 5: Chandelier ATR Stop
Logic: A volatility-based trend follower that hangs a "leash" (ATR multiple) from the highest high (for longs) or lowest low (for shorts).
Function: Used here as an entry filter. If price is above the Chandelier line, the trend is Bullish. It also includes a "Bull/Bear Qualifier" check to ensure structural support.
Module 6: Crypto Market Breadth (CMB)
Logic: This is a macro-filter. It pulls data from multiple major tickers (BTC, ETH, and Perpetual Contracts) across different exchanges.
Function: It calculates a "Market Health" percentage. If Bitcoin is rising but the rest of the market is dumping, this module can veto a trade, ensuring you don't buy into a "fake" rally driven by a single asset.
Module 7: Directional Index Convergence (DIC)
Logic: Analyzes the convergence/divergence between Fast and Slow Directional Movement indices.
Function: Identifies when trend strength is expanding. A buy signal is generated only when the positive directional movement overpowers the negative movement with expanding momentum.
Module 8: Market Thrust Indicator (MTI)
Logic: A volume-weighted breadth indicator. It uses Advance/Decline data and Up/Down Volume data.
Function: This is one of the most powerful modules. It confirms that price movement is supported by actual volume flow. We recommend using the "SSMA" (Super Smoother) MA Type for the cleanest signals on the 4H chart.
Module 9: Simple Ichimoku Cloud
Logic: Traditional Japanese trend analysis using the Tenkan-sen and Kijun-sen.
Function: Checks for a "Kumo Breakout." Price must be fully above the Cloud (for longs) or below it (for shorts). This is a classic "trend confirmation" module.
Module 10: Simple Harmonic Oscillator
Logic: Analyzes the harmonic wave properties of price action to detect cyclical tops and bottoms.
Function: Serves as a counter-trend or early-reversal detector. It tries to identify when a cycle has bottomed out (for buys) or topped out (for sells) before the main trend indicators catch up.
Module 11: HSRS Compression / Super AO
Logic: Two options in one.
HSRS: Hirashima Sugita Resistance Support. Detects volatility compression (squeezes) relative to dynamic support/resistance bands.
Super AO: A combination of the Awesome Oscillator and SuperTrend logic.
Function: Great for catching explosive moves that result from periods of low volatility (consolidation).
Module 12: Fisher Transform (MTF)
Logic: Converts price data into a Gaussian normal distribution.
Function: Identifies extreme price deviations. This module uses Multi-Timeframe (MTF) logic to look at higher-timeframe trends (e.g., looking at the Daily Fisher while trading the 4H chart) to ensure you aren't trading against the major trend.
5. Global Inhibitors (The Veto Power)
Even if 12 out of 12 modules vote "Buy," Gypsy Bot performs a final safety check using Global Inhibitors. If any of these are triggered, the trade is blocked.
Bitcoin Halving Logic:
Hardcoded dates for past and projected future Bitcoin halvings (up to 2040).
Trading is inhibited or restricted during the chaotic weeks immediately surrounding a Halving event to avoid volatility crushes.
Miner Capitulation:
Uses Hash Rate Ribbons (Moving averages of Hash Rate).
If miners are capitulating (Shutting down rigs due to unprofitability), the engine flags a "Bearish" regime and can flip logic to Short-only or flat.
ADX Filter (Flat Market Protocol):
If the Average Directional Index (ADX) is below a specific threshold (e.g., 20), the market is deemed "Flat/Choppy." The bot will refuse to open trend-following trades in a flat market.
CryptoCap Trend:
Checks the total Crypto Market Cap chart. If the broad market is in a downtrend, it can inhibit Long entries on individual altcoins.
6. Risk Management & The Dump Protection Team (DPT)
Gypsy Bot separates "Entry Logic" from "Risk Management Logic."
Dump Protection Team (DPT)
This is a specialized logic branch designed to save the account during Black Swan events.
Nuke Protection: If the DPT detects a volatility signature consistent with a flash crash, it overrides all other logic and forces an immediate exit.
Moon Protection: If a parabolic pump is detected that violates statistical probability (Bollinger deviations), DPT can force a profit take before the inevitable correction.
Advanced Adaptive Trailing Stop (AATS)
Unlike a static trailing stop (e.g., "trail by 5%"), AATS is dynamic.
Penthouse Level: If price is at the top of the HSRS channel (High Volatility), the stop loosens to allow for wicks.
Dungeon Level: If price is compressed at the bottom, the stop tightens to protect capital.
Staged Take Profits
TP1: Scalp a portion (e.g., 10%) to cover fees and secure a win.
TP2: Take the bulk of profit.
TP3: Leave a "Runner" position with a loose trailing stop to catch "Moon" moves.
7. Recommended Setup Guide
When applying Gypsy Bot to a new chart, follow this sequence:
Set Timeframe: 4 Hours (4H).
Reset: Turn OFF Trailing Stop, Stop Loss, and Take Profits. (We want to see raw entry performance first).
Tune DPT: Adjust "Dump/Moon Protection" inputs first. These have the highest impact on net performance.
Tune Module 8 (MTI): This module is a heavy filter. Experiment with the MA Type (SSMA is recommended).
Select Modules: Enable/Disable modules 1-12 based on the asset's personality (Trending vs. Ranging).
Voting Threshold: Adjust ActivateOrders. A lower number = More Trades (Aggressive). A higher number = Fewer, higher conviction trades (Conservative).
Final Polish: Re-enable Stop Losses, Trailing Stops, and Staged Take Profits to smooth the equity curve and define your max risk per trade.
8. Technical Specs
Engine Version: Pine Script V6
Repainting: This strategy uses Closed Candle data for all Risk Management and Entry decisions. This ensures that Backtest results align closely with real-time behavior (no repainting of historical signals).
Alerts: This script generates Strategy alerts. If you require visual-only alerts, see the source code header for instructions on switching to "Study" (Indicator) mode.
Disclaimer:
This script is a complex algorithmic tool for market analysis. Past performance is not indicative of future results. Use this tool to assist your own decision-making, not to replace it.
9. About Signal Lynx
Automation for the Night-Shift Nation 🌙
Signal Lynx focuses on helping traders and developers bridge the gap between indicator logic and real-world automation. The same RM engine you see here powers multiple internal systems and templates, including other public scripts like the Super-AO Strategy with Advanced Risk Management.
We provide this code open source under the Mozilla Public License 2.0 (MPL-2.0) to:
Demonstrate how Adaptive Logic and structured Risk Management can outperform static, one-layer indicators
Give Pine Script users a battle-tested RM backbone they can reuse, remix, and extend
If you are looking to automate your TradingView strategies, route signals to exchanges, or simply want safer, smarter strategy structures, please keep Signal Lynx in your search.
License: Mozilla Public License 2.0 (Open Source).
If you make beneficial modifications, please consider releasing them back to the community so everyone can benefit.

Profitable Pair Correlation Divergence Scanner v6This strategy identifies divergence opportunities between two correlated assets using a combination of Z-Score spread analysis, trend confirmation, RSI & MACD momentum checks, correlation filters, and ATR-based stop-loss/take-profit management. It’s optimized for positive P&L and realistic trade execution.
Key Features:
Pair Divergence Detection:
Measures deviation between returns of two assets and identifies overbought/oversold spread conditions using Z-Score.
Trend Alignment:
Trades only in the direction of the primary asset’s trend using a fast EMA vs slow EMA filter.
Momentum Confirmation:
Confirms trades with RSI and MACD to reduce false signals.
Correlation Filter:
Ensures the pair is strongly correlated before taking trades, avoiding noisy signals.
Risk Management:
Dynamic ATR-based stop-loss and take-profit ensures proper reward-to-risk ratio.
Exit Conditions:
Automatically closes positions when Z-Score normalizes, or ATR-based exits are hit.
How It Works:
Calculate Returns:
Computes returns for both assets over the selected timeframe.
Z-Score Spread:
Calculates the spread between returns and normalizes it using moving average and standard deviation.
Trend Filter:
Only takes long trades if the fast EMA is above the slow EMA, and short trades if the fast EMA is below the slow EMA.
Momentum Confirmation:
Confirms trade direction with RSI (>50 for longs, <50 for shorts) and MACD alignment.
Correlation Check:
Ensures the pair’s recent correlation is strong enough to validate divergence signals.
Trade Execution:
Opens positions when Z-Score crosses thresholds and all conditions align. Positions close when Z-Score normalizes or ATR-based SL/TP is hit.
Plot Explanation:
Z-Score: Blue line shows divergence magnitude.
Entry Levels: Red/Green lines mark long/short thresholds.
Exit Zone: Gray lines show normalization zone.
EMA Trend Lines: Purple (fast), Orange (slow) for trend alignment.
Correlation: Teal overlay shows current correlation strength.
Usage Tips:
Use highly correlated pairs for best results (e.g., EURUSD/GBPUSD).
Run on higher timeframe charts (1h or 4h) to reduce noise.
Adjust ATR multiplier based on volatility to avoid premature stops.
Combine with alerts for automated notifications or webhook execution.
Conclusion:
The Profitable Pair Correlation Divergence Scanner v6 is designed for traders who want systematic, low-risk, positive P&L trading opportunities with minimal manual monitoring. By combining trend alignment, momentum confirmation, correlation filters, and dynamic exits, it reduces false signals and improves execution reliability.
Run it on TradingView and watch how it captures divergence opportunities while maintaining positive P&L across trades.

Momentum Reversal / Dip Buyer [Score Based]Strategy Overview
Momentum Reversal / Dip Buyer is a quantitative reversal engine designed to fade stretched moves and buy dips / sell rallies when multiple momentum and context factors line up. It’s built for liquid instruments especially for ticker CME_MINI:ES1! and works best on intraday timeframes like the 5-minute or 1-minute chart.
Core Logic
This strategy builds a composite Momentum Score by combining:
Price Location: Relative to 100 SMA, 1000 EMA, and VWAP (trend / regime filter).
RSI: Overbought/oversold and mid-zone strength.
VWMO (Volume-Weighted Momentum): Direction and strength of volume-weighted price drift.
ADX: Trend strength filter (high vs low trend environment).
Full Stoch (%K): Short-term exhaustion and mean-reversion context.
CCI: Overbought/oversold turns (key trigger).
MFI: Volume-confirmed buying/selling pressure.
ATR Regime: High vs low volatility environment.
Cumulative Delta: Whether net aggressor flow is rising or falling.
From this, a single Momentum Score is computed each bar:
Longs: Taken when the score is depressed (scoreLow) and CCI crosses up from oversold.
Shorts: Taken when the score is elevated (scoreHigh) and CCI crosses down from overbought.
Risk Management & Trade Logic
Max Daily Trades: Hard cap on entries per day.
Hard Stop: Fixed % stop based on entry price.
Profit Target: Target ATR Multiplier × main ATR from entry.
Breakeven Logic: Optional; moves stop to breakeven (plus optional offset) after price moves a configurable multiple of the main ATR in your favor.
Trailing Stop (Separate ATR): Optional; uses its own ATR length and ATR-based trigger and distance. This lets you run slower ATR for targets while using a tighter, more reactive ATR for the trail.
Session Control
Trading Window: Optional session filter (e.g., 09:30–16:00). Entries are only allowed inside the defined window.
Force Flat at Session End: Option to automatically close all open positions when the session ends.
Visuals
The script plots entry arrows and a compact dashboard displaying: current Momentum Score, daily trade usage, and CCI status.
Disclaimer:
This script is for educational and research purposes only and is not financial advice. Past performance does not guarantee future results. Always forward-test and adjust parameters to your own risk tolerance and market.
Shoutout and all credit goes to AuclairsCapital for building the base foundation of this strategy on ThinkScript

Bollinger Bands Mean Reversion using RSI [Krishna Peri]How it Works
Long entries trigger when:
- RSI reaches oversold levels, and
- At least one bullish candle closes inside the lower Bollinger Band
Short entries trigger when:
- RSI reaches overbought levels, and
- At least one bearish candle closes inside the upper Bollinger Band
This approach aims to capture exhaustion moves where price pushes into extreme deviation from its mean and then snaps back toward the middle band.
Important Disclaimer
This is a mean-reversion strategy, which means it performs best in sideways, ranging, or slowly oscillating market conditions. When markets shift into strong trends, Bollinger Bands expand and volatility increases, which may cause some signals to become inaccurate or fail altogether.
For best results, combine this script with:
- Price action
- Market structure
- Higher-timeframe trend context
- Previous day/week/month highs & lows
- Untested liquidity levels or imbalance zones
- Session timing (Asia, London, NY)
Using these confluences helps filter out low-probability trades and significantly improves consistency and precision.

XRP Non-Stop Strategy (TP 25% / SL 15%)This strategy performs continuous automated trading exclusively on XRP. It opens long positions during favorable trend conditions, using a fixed Take Profit target of 25% above the entry price and a fixed Stop Loss of 15% below the entry. Once a trade is closed (either TP or SL), the strategy automatically re-enters on the next valid signal, enabling uninterrupted trading.
The script includes:
Dynamic Take Profit & Stop Loss lines
Optional EMA trend filter
Visual BUY and EXIT markers
TradingView alerts for automation or notifications
This strategy is built for traders who want a simple, price-action-driven system without fixed price levels, relying only on percentage-based movement from each entry.


Oleg_Aryukov_StrategyTrader Oleg Aryukov's strategy, based on a variety of oscillators, allows him to try to catch reversals in cryptocurrencies.

The Oracle: Dip & Top Adaptive Sniper [Hakan Yorganci]█ OVERVIEW
The Oracle: Dip & Top Adaptive Sniper is a precision-focused trend trading strategy designed to solve the biggest problem in swing trading: Timing.
Most trend-following strategies chase price ("FOMO"), buying when the asset is already overextended. The Oracle takes a different approach. It adopts a "Sniper" mentality: it identifies a strong macro trend but patiently waits for a Mean Reversion (pullback) to execute an entry at a discounted price.
By combining the structural strength of Moving Averages (SMA 50/200) with the momentum precision of RSI and the volatility filtering of ADX, this script filters out noise and targets high-probability setups.
█ HOW IT WORKS
This strategy operates on a strictly algorithmic protocol known as "The Yorganci Protocol," which involves three distinct phases: Filter, Target, and Execute.
1. The Macro Filter (Trend Identification)
* SMA 200 Rule: By default, the strategy only scans for buy signals when the price is trading above the 200-period Simple Moving Average. This ensures we are always trading in the direction of the long-term bull market.
* Adaptive Switch: A new feature allows users to toggle the Only Buy Above SMA 200? filter OFF. This enables the strategy to hunt for oversold bounces (dead cat bounces) even during bearish or neutral market structures.
2. The Volatility Filter (ADX Integration)
* Sideways Protection: One of the main weaknesses of moving average strategies is "whipsaw" losses during choppy, ranging markets.
* Solution: The Oracle utilizes the ADX (Average Directional Index). It will BLOCK any trade entry if the ADX is below the threshold (Default: 20). This ensures capital is only deployed when a genuine trend is present.
3. The Sniper Entry (Buying the Dip)
* Instead of buying on breakout strength (e.g., RSI > 60), The Oracle waits for the RSI Moving Average to dip into the "Value Zone" (Default: 45) and cross back up. This technique allows for tighter stops and higher Risk/Reward ratios compared to traditional breakout systems.
█ EXIT STRATEGY
The Oracle employs a dynamic dual-exit mechanism to maximize gains and protect capital:
* Take Profit (The Peak): The strategy monitors RSI heat. When the RSI Moving Average breaches the Overbought Threshold (Default: 75), it signals a "Take Profit", securing gains near the local top before a potential reversal.
* Stop Loss (Trend Invalidated): If the market structure fails and the price closes below the 50-period SMA, the position is immediately closed to prevent deep drawdowns.
█ SETTINGS & CONFIGURATION
* Moving Averages: Fully customizable lengths for Support (SMA 50) and Trend (SMA 200).
* Trend Filter: Checkbox to enable/disable the "Bull Market Only" rule.
* RSI Thresholds:
* Sniper Buy Level: Adjustable (Default: 45). Lower values = Deeper dips, fewer trades.
* Peak Sell Level: Adjustable (Default: 75). Higher values = Longer holds, potentially higher profit.
* ADX Filter: Checkbox to enable/disable volatility filtering.
█ BEST PRACTICES
* Timeframe: Designed primarily for 4H (4-Hour) charts for swing trading. It can also be used on 1H for more frequent signals.
* Assets: Highly effective on trending assets such as Bitcoin (BTC), Ethereum (ETH), and high-volume Altcoins.
* Risk Warning: This strategy is designed for "Long Only" spot or leverage trading. Always use proper risk management.
█ CREDITS
* Original Concept: Inspired by the foundational work of Murat Besiroglu (@muratkbesiroglu).
* Algorithm Development & Enhancements: Developed by Hakan Yorganci (@hknyrgnc).
* Modifications include: Integration of ADX filters, Mean Reversion entry logic (RSI Dip), and Dynamic Peak Profit taking.


Super-AO with Risk Management Strategy Template - 11-29-25Super-AO Strategy with Advanced Risk Management Template
Signal Lynx | Free Scripts supporting Automation for the Night-Shift Nation 🌙
1. Overview
Welcome to the Super-AO Strategy. This is more than just a buy/sell indicator; it is a complete, open-source Risk Management (RM) Template designed for the Pine Script community.
At its core, this script implements a robust swing-trading strategy combining the SuperTrend (for macro direction) and the Awesome Oscillator (for momentum). However, the real power lies under the hood: a custom-built Risk Management Engine that handles trade states, prevents repainting, and manages complex exit conditions like Staged Take Profits and Advanced Adaptive Trailing Stops (AATS).
We are releasing this code to help traders transition from simple indicators to professional-grade strategy structures.
2. Quick Action Guide (TL;DR)
Best Timeframe: 4 Hours (H4) and above. Designed for Swing Trading.
Best Assets: "Well-behaved" assets with clear liquidity (Major Forex pairs, BTC, ETH, Indices).
Strategy Type: Trend Following + Momentum Confirmation.
Key Feature: The Risk Management Engine is modular. You can strip out the "Super-AO" logic and insert your own strategy logic into the template easily.
Repainting: Strictly Non-Repainting. The engine calculates logic based on confirmed candle closes.
3. Detailed Report: How It Works
A. The Strategy Logic: Super-AO
The entry logic is based on the convergence of two classic indicators:
SuperTrend: Determines the overall trend bias (Green/Red).
Awesome Oscillator (AO): Measures market momentum.
The Signal:
LONG (+2): SuperTrend is Green AND AO is above the Zero Line AND AO is Rising.
SHORT (-2): SuperTrend is Red AND AO is below the Zero Line AND AO is Falling.
By requiring momentum to agree with the trend, this system filters out many false signals found in ranging markets.
B. The Risk Management (RM) Engine
This script features a proprietary State Machine designed by Signal Lynx. Unlike standard strategies that simply fire orders, this engine separates the Signal from the Execution.
Logic Injection: The engine listens for a specific integer signal: +2 (Buy) or -2 (Sell). This makes the code a Template. You can delete the Super-AO section, write your own logic, and simply pass a +2 or -2 to the RM_EngineInput variable. The engine handles the rest.
Trade States: The engine tracks the state of the trade (Entry, In-Trade, Exiting) to prevent signal spamming.
Aggressive vs. Conservative:
Conservative Mode: Waits for a full trend reversal before taking a new trade.
Aggressive Mode: Allows for re-entries if the trend is strong and valid conditions present themselves again (Pyramiding Type 1).
C. Advanced Exit Protocols
The strategy does not rely on a single exit point. It employs a "Layered Defense" approach:
Hard Stop Loss: A fixed percentage safety net.
Staged Take Profits (Scaling Out): The script allows you to set 3 distinct Take Profit levels. For example, you can close 10% of your position at TP1, 10% at TP2, and let the remaining 80% ride the trend.
Trailing Stop: A standard percentage-based trailer.
Advanced Adaptive Trailing Stop (AATS): This is a highly sophisticated volatility stop. It calculates market structure using Hirashima Sugita (HSRS) levels and Bollinger Bands to determine the "floor" and "ceiling" of price action.
If volatility is high: The stop loosens to prevent wicking out.
If volatility is low: The stop tightens to protect profit.
D. Repainting Protection
Many Pine Script strategies look great in backtesting but fail in live trading because they rely on "real-time" price data that disappears when the candle closes.
This Risk Management engine explicitly pulls data from the previous candle close (close , high , low ) for its calculations. This ensures that the backtest results you see match the reality of live execution.
4. For Developers & Modders
We encourage you to tear this code apart!
Look for the section titled // Super-AO Strategy Logic.
Replace that block with your own RSI, MACD, or Price Action logic.
Ensure your logic outputs a 2 for Buy and -2 for Sell.
Connect it to RM_EngineInput.
You now have a fully functioning Risk Management system for your custom strategy.
5. About Signal Lynx
Automation for the Night-Shift Nation 🌙
This code has been in action since 2022 and is a known performer in PineScript v5. We provide this open source to help the community build better, safer automated systems.
If you are looking to automate your strategies, please take a look at Signal Lynx in your search.
License: Mozilla Public License 2.0 (Open Source). If you make beneficial modifications, please release them back to the community!

KAMA Flip strategyI built this strategy because I wanted something that doesn’t overcomplicate trading.
No 20 indicators, no guessing, no “maybe I should close here.”
Just a clear momentum flip, a defined stop, and a defined take profit. (for me on 1D BTC chart it works best with 6% stoploss and 3% takeprofit, lookback should be 40, everything else standard)
The idea is simple: when momentum shifts, I want to be on the right side of it.
KAMA is good for this because it speeds up when the market moves and slows down when it doesn’t.
I normalize it so it becomes a clean zero-line oscillator.
Above zero means momentum is turning up. Below zero means it’s turning down.
That’s the entire entry logic. A flip is a flip.
The exit logic is just as simple: one stop loss, one take profit, both fixed percentages from the entry.
The position closes 100% at the target or the stop. No scaling in, no scaling out, no trailing.
It’s straightforward and easy to analyze because every trade has the exact same structure.
I originally made this for BTC on the daily chart, but nothing stops you from trying it on other charts.
If you want it only to go long, only to go short, or take both sides, you can set that.
All the KAMA parameters are open so you can play with how reactive the signal is.
The visuals and SL/TP lines can be turned on or off depending on how clean you want your chart.
This isn’t financial advice. It’s just a system I like because it’s simple, objective, and does exactly what it’s supposed to do.
Test it, adjust it, break it, rebuild it — do whatever fits your own approach.

Third eye • StrategyThird eye • Strategy – User Guide
1. Idea & Concept
Third eye • Strategy combines three things into one system:
Ichimoku Cloud – to define market regime and support/resistance.
Moving Average (trend filter) – to trade only in the dominant direction.
CCI (Commodity Channel Index) – to generate precise entry signals on momentum breakouts.
The script is a strategy, not an indicator: it can backtest entries, exits, SL, TP and BreakEven logic automatically.
2. Indicators Used
2.1 Ichimoku
Standard Ichimoku settings (by default 9/26/52/26) are used:
Conversion Line (Tenkan-sen)
Base Line (Kijun-sen)
Leading Span A & B (Kumo Cloud)
Lagging Span is calculated but hidden from the chart (for visual simplicity).
From the cloud we derive:
kumoTop – top of the cloud under current price.
kumoBottom – bottom of the cloud under current price.
Flags:
is_above_kumo – price above the cloud.
is_below_kumo – price below the cloud.
is_in_kumo – price inside the cloud.
These conditions are used as trend / regime filters and for stop-loss & trailing stops.
2.2 Moving Average
You can optionally display and use a trend MA:
Types: SMA, EMA, DEMA, WMA
Length: configurable (default 200)
Source: default close
Filter idea:
If MA Direction Filter is ON:
When Close > MA → strategy allows only Long signals.
When Close < MA → strategy allows only Short signals.
The MA is plotted on the chart (if enabled).
2.3 CCI & Panel
The CCI (Commodity Channel Index) is used for entry timing:
CCI length and source are configurable (default length 20, source hlc3).
Two thresholds:
CCI Upper Threshold (Long) – default +100
CCI Lower Threshold (Short) – default –100
Signals:
Long signal:
CCI crosses up through the upper threshold
cci_val < upper_threshold and cci_val > upper_threshold
Short signal:
CCI crosses down through the lower threshold
cci_val > lower_threshold and cci_val < lower_threshold
There is a panel (table) in the bottom-right corner:
Shows current CCI value.
Shows filter status as colored dots:
Green = filter enabled and passed.
Red = filter enabled and blocking trades.
Gray = filter is disabled.
Filters shown in the panel:
Ichimoku Cloud filter (Long/Short)
Ichimoku Lines filter (Conversion/Base vs Cloud)
MA Direction filter
3. Filters & Trade Direction
All filters can be turned ON/OFF independently.
3.1 Ichimoku Cloud Filter
Purpose: trade only when price is clearly above or below the Kumo.
Long Cloud Filter (Use Ichimoku Cloud Filter) – when enabled:
Long trades only if close > cloud top.
Short Cloud Filter – when enabled:
Short trades only if close < cloud bottom.
If the cloud filter is disabled, this condition is ignored.
3.2 Ichimoku Lines Above/Below Cloud
Purpose: stronger trend confirmation: Ichimoku lines should also be on the “correct” side of the cloud.
Long Lines Filter:
Long allowed only if Conversion Line and Base Line are both above the cloud.
Short Lines Filter:
Short allowed only if both lines are below the cloud.
If this filter is OFF, the conditions are not checked.
3.3 MA Direction Filter
As described above:
When ON:
Close > MA → only Longs.
Close < MA → only Shorts.
4. Anti-Re-Entry Logic (Cloud Touch Reset)
The strategy uses internal flags to avoid continuous re-entries in the same direction without a reset.
Two flags:
allowLong
allowShort
After a Long entry, allowLong is set to false, allowShort to true.
After a Short entry, allowShort is set to false, allowLong to true.
Flags are reset when price touches the Kumo:
If Low goes into the cloud → allowLong = true
If High goes into the cloud → allowShort = true
If Close is inside the cloud → both allowLong and allowShort are set to true
There is a key option:
Wait Position Close Before Flag Reset
If ON: cloud touch will reset flags only when there is no open position.
If OFF: flags can be reset even while a trade is open.
This gives a kind of regime-based re-entry control: after a trend leg, you wait for a “cloud interaction” to allow new signals.
5. Risk Management
All risk management is handled inside the strategy.
5.1 Position Sizing
Order Size % of Equity – default 10%
The strategy calculates:
position_value = equity * (Order Size % / 100)
position_qty = position_value / close
So position size automatically adapts to your current equity.
5.2 Take Profit Modes
You can choose one of two TP modes:
Percent
Fibonacci
5.2.1 Percent Mode
Single Take Profit at X% from entry (default 2%).
For Long:
TP = entry_price * (1 + tp_pct / 100)
For Short:
TP = entry_price * (1 - tp_pct / 100)
One strategy.exit per side is used: "Long TP/SL" and "Short TP/SL".
5.2.2 Fibonacci Mode (2 partial TPs)
In this mode, TP levels are based on a virtual Fib-style extension between entry and stop-loss.
Inputs:
Fib TP1 Level (default 1.618)
Fib TP2 Level (default 2.5)
TP1 Share % (Fib) (default 50%)
TP2 share is automatically 100% - TP1 share.
Process for Long:
Compute a reference Stop (see SL section below) → sl_for_fib.
Compute distance: dist = entry_price - sl_for_fib.
TP levels:
TP1 = entry_price + dist * (Fib TP1 Level - 1)
TP2 = entry_price + dist * (Fib TP2 Level - 1)
For Short, the logic is mirrored.
Two exits are used:
TP1 – closes TP1 share % of position.
TP2 – closes remaining TP2 share %.
Same stop is used for both partial exits.
5.3 Stop-Loss Modes
You can choose one of three Stop Loss modes:
Stable – fixed % from entry.
Ichimoku – fixed level derived from the Kumo.
Ichimoku Trailing – dynamic SL following the cloud.
5.3.1 Stable SL
For Long:
SL = entry_price * (1 - Stable SL % / 100)
For Short:
SL = entry_price * (1 + Stable SL % / 100)
Used both for Percent TP mode and as reference for Fib TP if Kumo is not available.
5.3.2 Ichimoku SL (fixed, non-trailing)
At the time of a new trade:
For Long:
Base SL = cloud bottom minus small offset (%)
For Short:
Base SL = cloud top plus small offset (%)
The offset is configurable: Ichimoku SL Offset %.
Once computed, that SL level is fixed for this trade.
5.3.3 Ichimoku Trailing SL
Similar to Ichimoku SL, but recomputed each bar:
For Long:
SL = cloud bottom – offset
For Short:
SL = cloud top + offset
A red trailing SL line is drawn on the chart to visualize current stop level.
This trailing SL is also used as reference for BreakEven and for Fib TP distance.
6. BreakEven Logic (with BE Lines)
BreakEven is optional and supports two modes:
Percent
Fibonacci
Inputs:
Percent mode:
BE Trigger % (from entry) – move SL to BE when price goes this % in profit.
BE Offset % from entry – SL will be set to entry ± this offset.
Fibonacci mode:
BE Fib Level – Fib level at which BE will be activated (default 1.618, same style as TP).
BE Offset % from entry – how far from entry to place BE stop.
The logic:
Before BE is triggered, SL follows its normal mode (Stable/Ichimoku/Ichimoku Trailing).
When BE triggers:
For Long:
New SL = max(current SL, BE SL).
For Short:
New SL = min(current SL, BE SL).
This means BE will never loosen the stop – only tighten it.
When BE is activated, the strategy draws a violet horizontal line at the BreakEven level (once per trade).
BE state is cleared when the position is closed or when a new position is opened.
7. Entry & Exit Logic (Summary)
7.1 Long Entry
Conditions for a Long:
CCI signal:
CCI crosses up through the upper threshold.
Ichimoku Cloud Filter (optional):
If enabled → price must be above the Kumo.
Ichimoku Lines Filter (optional):
If enabled → Conversion Line and Base Line must be above the Kumo.
MA Direction Filter (optional):
If enabled → Close must be above the chosen MA.
Anti-re-entry flag:
allowLong must be true (cloud-based reset).
Position check:
Long entries are allowed when current position size ≤ 0 (so it can also reverse from short to long).
If all these conditions are true, the strategy sends:
strategy.entry("Long", strategy.long, qty = calculated_qty)
After entry:
allowLong = false
allowShort = true
7.2 Short Entry
Same structure, mirrored:
CCI signal:
CCI crosses down through the lower threshold.
Cloud filter: price must be below cloud (if enabled).
Lines filter: conversion & base must be below cloud (if enabled).
MA filter: Close must be below MA (if enabled).
allowShort must be true.
Position check: position size ≥ 0 (allows reversal from long to short).
Then:
strategy.entry("Short", strategy.short, qty = calculated_qty)
Flags update:
allowShort = false
allowLong = true
7.3 Exits
While in a position:
The strategy continuously recalculates SL (depending on chosen mode) and, in Percent mode, TP.
In Fib mode, fixed TP levels are computed at entry.
BreakEven may raise/tighten the SL if its conditions are met.
Exits are executed via strategy.exit:
Percent mode: one TP+SL exit per side.
Fib mode: two partial exits (TP1 and TP2) sharing the same SL.
At position open, the script also draws visual lines:
White line — entry price.
Green line(s) — TP level(s).
Red line — SL (if not using Ichimoku Trailing; with trailing, the red line is updated dynamically).
Maximum of 30 lines are kept to avoid clutter.
8. How to Use the Strategy
Choose market & timeframe
Works well on trending instruments. Try crypto, FX or indices on H1–H4, or intraday if you prefer more trades.
Adjust Ichimoku settings
Keep defaults (9/26/52/26) or adapt to your timeframe.
Configure Moving Average
Typical: EMA 200 as a trend filter.
Turn MA Direction Filter ON if you want to trade only with the main trend.
Set CCI thresholds
Default ±100 is classic.
Lower thresholds → more signals, higher noise.
Higher thresholds → fewer but stronger signals.
Enable/disable filters
Turn on Ichimoku Cloud and Ichimoku Lines if you want only “clean” trend trades.
Use Wait Position Close Before Flag Reset to control how often re-entries are allowed.
Choose TP & SL mode
Percent mode is simpler and easier to understand.
Fibonacci mode is more advanced: it aligns TP levels with the distance to stop, giving asymmetric RR setups (two partial TPs).
Choose Stable SL for fixed-risk trades, or Ichimoku / Ichimoku Trailing to tie stops to the cloud structure.
Set BreakEven
Enable BE if you want to lock in risk-free trades after a certain move.
Percent mode is straightforward; Fib mode keeps BreakEven in harmony with your Fib TP setup.
Run Backtest & Optimize
Press “Add to chart” → go to Strategy Tester.
Adjust parameters to your market and timeframe.
Look at equity curve, PF, drawdown, average trade, etc.
Live / Paper Trading
After you’re satisfied with backtest results, use the strategy to generate signals.
You can mirror entries/exits manually or connect them to alerts (if you build an alert-based execution layer).

Retracement Strategy [OmegaTools]Retracement Strategy is a systematic trend–retracement framework designed to identify directional opportunities after a confirmed momentum shift, and to manage exits using either trend reversals or overextension conditions. It is built around a smoothed RSI regime filter and a simple, price-based retracement trigger, making it applicable across a wide range of markets and timeframes while remaining transparent and easy to interpret.
The strategy begins by defining the underlying trend through a two-stage RSI signal. A standard RSI is computed over the user-defined Length input, then smoothed with a short moving average to reduce noise. Two symmetric thresholds are derived from the Threshold parameter: an upper band at 100 minus the threshold and a lower band at the threshold itself. When the smoothed RSI crosses above the upper band, the environment is classified as bullish and the internal trend state is set to uptrend. When the smoothed RSI crosses below the lower band, the environment is classified as bearish and the trend state becomes downtrend. When RSI moves back into the central zone between the two bands, the trend is considered neutral. In addition to the current trend, the strategy tracks the last non-neutral trend direction, which is used to detect genuine trend changes rather than transient oscillations.
Once a trend is established, the strategy looks for retracement entries in the direction of that trend. For long setups in an uptrend, it computes the lowest low over the previous Length minus one bars, excluding the current bar. A long signal is generated when price dips below this recent low while the trend state remains bullish. Symmetrically, for short setups in a downtrend, it computes the highest high over the previous Length minus one bars and enters short when price spikes above this recent high while the trend state remains bearish. This logic is designed to capture pullbacks against the prevailing RSI-defined trend, entering when the market tests or slightly violates recent extremes, rather than chasing breakouts. The candles are visually coloured to reflect the detected trend, highlighting bullish and bearish environments while keeping neutral phases distinguishable on the chart. An ATR-based measure is used solely to position the “UP” and “DN” labels on the chart for clearer visualisation of entry points; it does not directly influence position sizing or stop calculation in this implementation.
Take profit and stop loss behaviour are fully parameterized through the “Take Profit” and “Stop Loss” inputs, each offering three modes: None, Trend Change and Extension. When “Trend Change” is selected for the take profit, the strategy will only exit profitable positions when a confirmed trend reversal occurs. For a long position, this means that the strategy will close the trade when the trend state flips from uptrend to downtrend, and the last recorded trend direction validates that this is a genuine reversal rather than a neutral fluctuation; the same logic applies symmetrically for short positions. When “Extension” is selected as the take profit mode, the strategy closes profitable long trades when the smoothed RSI reaches or exceeds the upper threshold, interpreted as an overbought extension within the bullish regime, and closes profitable short trades when the smoothed RSI falls to or below the lower threshold, interpreted as an oversold extension within the bearish regime. When “None” is chosen, the strategy does not apply any explicit take profit logic, leaving trades to be managed by the stop loss settings or by user discretion in backtesting.
The stop loss parameter works in a parallel way. With “Trend Change” selected as stop loss, any open long position is closed when the trend flips from uptrend to downtrend, regardless of whether the trade is currently in profit or loss, and any open short is closed when the trend flips from downtrend to uptrend. This turns the RSI trend regime into a hard invalidation rule: once the underlying momentum structure reverses, the position is exited. With “Extension” selected for stop loss, long positions are closed when RSI falls back below the upper band and moves towards the opposite side of the range, while short positions are closed when RSI rises above the lower band and moves towards the upper side. In practice, this acts as a dynamic exit based on the oscillator moving out of a favourable context for the existing trade. Selecting “None” for stop loss disables these automatic exits, leaving only the take profit logic, if any, to manage the position. Because take profit and stop loss configuration are independent, the user can construct different profiles, such as pure trend-change exits on both sides, pure overextension exits, or a mix (for example, take profit on overextension and stop loss on trend reversal).
This strategy is designed as an analytical and backtesting framework rather than a finished plug-and-play trading system. It does not include position sizing, risk-per-trade controls, multi-timeframe confirmation, volatility filters or instrument-specific fine-tuning. Its primary purpose is to provide a clear, rule-based structure for testing retracement logic within RSI-defined trends, and to allow users to explore how different exit regimes (trend-change based versus extension based) affect performance on their instruments and timeframes of interest.
Nothing in this script or its description should be interpreted as financial advice, investment recommendation or solicitation to buy or sell any financial instrument. Past performance on backtests does not guarantee future results. The behaviour of this strategy can vary significantly across symbols, timeframes and market conditions, and correlations, volatility and liquidity can change without warning. Before considering any live application, users should thoroughly backtest and forward test the strategy on their own data, adjust parameters to their risk profile and instrument characteristics, and integrate proper money management and trade management rules. Use of this script is entirely at the user’s own risk.

50 & 200 SMA + RSI Average Strategy (Long Only, Single Trade)It works better in trending markets. It delivers its best performance in the 4-hour to 1-day timeframes.

1M XAU Cumulative Delta Volume with OB Breakouts
### Overview
This is a **session-based CVD strategy** built around the **00:00–07:00 CEST range**. It finds the high/low of that session, turns them into **adaptive ATR-based support (yellow)** and **resistance (purple)** zones, and trades only **CVD-confirmed reversals** off those levels.
---
### How it Works
* For each day, the script:
* Builds a 00:00–07:00 CEST **profile high/low**.
* Creates a **support zone** around the session low and a **resistance zone** around the session high.
* Using lower timeframe data, it reconstructs **Cumulative Volume Delta (CVD)** and a **recent delta** filter.
* It arms “pending” states when price **enters a zone from the correct side**, then confirms:
* **BUY (long):** price reclaims above support and recent CVD is strongly positive.
* **SELL (short):** price rejects below resistance and recent CVD is strongly negative.
Only these two CVD signals (`buySignal` / `sellSignal`) open trades.
---
### Strategy Logic
* **Entries**
* `buySignal` → open **long** (if flat).
* `sellSignal` → open **short** (if flat).
* No pyramiding; one position at a time.
* **Exits (only TP & SL)**
* Long: TP at `avg_price * (0.5 + TP%)`, SL at `avg_price * (1 – SL%)`.
* Short: TP at `avg_price * (0.5 – TP%)`, SL at `avg_price * (1 + SL%)`.
* No opposite-signal exits.
---
### Extras
* **Reversal markers** on yellow/purple zones and **breakout/retest markers** are plotted for context and alerts but **do not trigger entries**.
* Zone width and “thickening” are ATR-based so important touches and near-touches are easy to see.
* Only suited for **1m intraday scalping** (e.g. XAU/USD), but can be tested on other markets/timeframes.

RSI Strategy [PrimeAutomation]⯁ OVERVIEW
The RSI Strategy is a momentum-driven trading system built around the behavior of the Relative Strength Index (RSI).
Instead of using traditional overbought/oversold zones, this strategy focuses on RSI breakouts with volatility-based trailing stops, adaptive profit-targets, and optional early-exit logic.
It is designed to capture strong continuation moves after momentum shifts while protecting trades using ATR-based dynamic risk management.
⯁ CONCEPTS
RSI Breakout Momentum: Entries happen when RSI breaks above/below custom thresholds, signaling a shift in momentum rather than mean reversion.
Volatility-Adjusted Risk: ATR defines both stop-loss and profit-target distances, scaling positions based on market volatility.
Dynamic Trailing Stop: The strategy maintains an adaptive trailing level that tightens as price moves in the trade’s favor.
Single-Position System: Only one trade at a time (no pyramiding), maximizing clarity and simplifying execution.
⯁ KEY FEATURES
RSI Signal Engine
• Long when RSI crosses above Upper threshold
• Short when RSI crosses below Lower threshold
These levels are configurable and optimized for trend-momentum detection.
ATR-Based Stop-Loss
A custom ATR multiplier defines the initial stop.
• Long stop = price – ATR × multiplier
• Short stop = price + ATR × multiplier
Stops adjust continuously using a trailing model.
ATR-Based Take Profit (Optional)
Profit targets scale with volatility.
• Long TP = entry + ATR × TP-multiplier
• Short TP = entry – ATR × TP-multiplier
Users can disable TP and rely solely on trailing stops.
Real-Time Trailing Logic
The stop updates bar-by-bar:
• In a long trade → stop moves upward only
• In a short trade → stop moves downward only
This keeps the stop tight as trends develop.
Early Exit Module (Optional)
After X bars in a trade, opposite RSI signals trigger exit.
This reduces holding time during weak follow-through phases.
Full Visual Layer
• RSI plotted with threshold fills
• Entry/TP/Stop visual lines
• Color-coded zones for clarity
⯁ HOW TO USE
Look for RSI Breakouts:
Focus on RSI crossing above the upper boundary (long) or below the lower boundary (short). These moments identify fresh momentum surges.
Use ATR Levels to Manage Risk:
Because stops and targets scale with volatility, the strategy adapts well to both quiet and explosive market phases.
Monitor Trailing Stops for Trend Continuation:
The trailing stop is the primary driver of exits—often outperforming fixed targets by catching larger runs.
Use on Liquid Markets & Mid-Higher Timeframes:
The system performs best where RSI and ATR signals are clean—crypto majors, FX, and indices.
⯁ CONCLUSION
The RSI Strategy is a modern RSI breakout system enhanced with volatility-adaptive risk management and flexible exit logic. It is designed for traders who prefer momentum confirmation over mean reversion, offering a disciplined framework with robust protections and dynamic trend-following capability.
Its blend of ATR-based stops, optional profit targets, and RSI-driven entries makes it a reliable strategy across a wide range of market conditions.

BTC 30 m Long singal Asset: Bitcoin only
Timeframe: 30 minutes
Entry Conditions (Long):
MACD histogram turns from red to green (negative to positive)
Stochastic K line crosses above D line AND this crossover happens below the lower band (20)
RSI is above the middle band (50)
