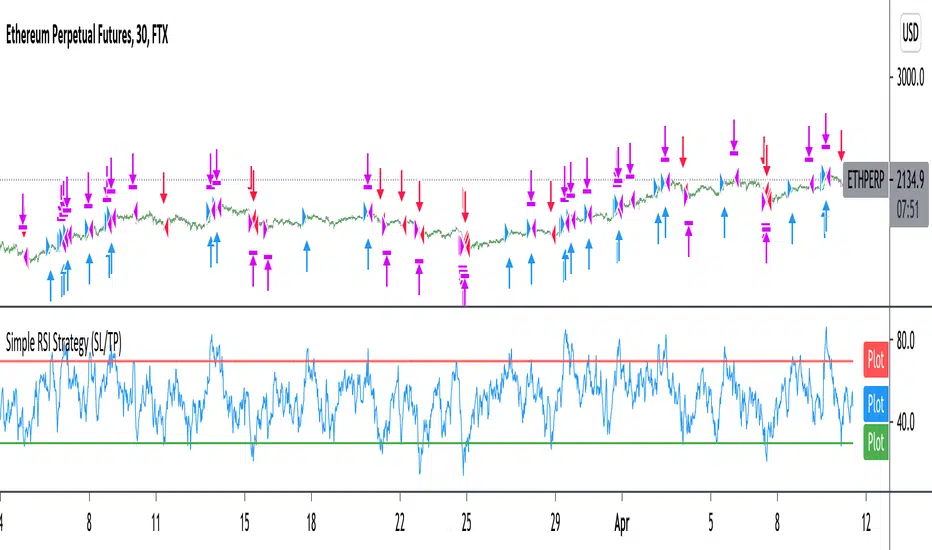
Improved simple RSI Buy/Sell at a level (SL/TP)Improved Simple Strategy based on RSI, using overbought or oversold levels.
Backtest: ETHPERP (FTX) - 30m
Set STOP LOSS and GET PROFIT as a percentage (2% and 10% by default).
If strategy.position_size != 0 algorithm convert percentages into points and set stop loss and take profit limit orders.
Pengayun
RSI Trend CryptoDear community,
Today I want to present you one of my favorite and simple trading bots: The RSI Trend.
This bot is based on the RSI, which normally is used as a trend reversal indicator. However, here it’s used as a trend finding indicator, often with great success. This bot making long-only trades, which is quite successful in bull-markets like the one we’re currently in.
In case you want to use an emergency exit for your trade, toggle the Emergency Exit parameter. During bull-markets it’s better in the long term to keep this option off.
Currently the bot only makes one trade at a time (pyramiding = 1), for higher risk and higher rewards you can increase this parameter. More than 5 is not advised.
I’ve optimized this bot on 15min time frame. It has some decent results for most cryptos on this TF, feel free to test this out.
In case you want to hook this bot up to your exchange, feel free to edit the ALERT messages in the code.
Default Trading Rules:
Long: RSI crosses over 35
Close Long: RSI crosses under 75
Emergency Exit: RSI crosses under 10

Full CRYPTO pack macd, rsi, obv, ema strategyThis is a simple, yet very efficient crypto strategy, adapted to 4h time frame, on big coins like ETH and BTC. However it can be adapted to other markets, timeframes etc
For this strategy I use a combination of a trend line, an oscillator, price action and volume.
This strategy has both the opportunity to go long and short.
As well, it has a leverage simulator .
The rules are the next ones:
Long : we check that current candle is ascending and above the moving average, the macd is in positive range, rsi is below overbought level and volume is bigger than the moving avg of volume.
For short, we have the opposite long rules.
If you have any questions, please let me know !

RSI OverTrend Strategy (by Marcoweb) v1.0Hi guys, just adapted the CCI Level zero Strategy with the Over Bought and Over Sold levels provided by the Relative Strength Index. The strat is opening a long position at RSI Oversold 30 Level closing it at RSI Overbought 70 Level flipping the position.
Enjoy :D

(IK) Stoch-60-15This strategy uses 60 minute and 15 minute stochastic data to determine entry and exit; it only executes long trades. I've only used this on BTC/USD, but I imagine the concepts employed should hold for any ticker
The script builds a simple Stochastic indicator for the current timeframe, and it also plots a single stochastic line for a higher resolution time frame. I've found good results trading on 15 minutes with a 60 minute higher resolution.
We enter a trade if the higher resolution stochastic is in an uptrend, if the current resolution stochastic is in an uptrend, and if the current stochastic value is less than 50.
We exit a trade when the current stochastic value crosses below 80 or the trailing stop loss is hit.
Stop loss is calculated with the input value, Stop Loss Percent. This value represents the percent of capital you're willing to lose before exiting a trade. A stop loss percent of 0.050 means your trade will exit if it falls 5% from the highest high since entering a trade. You will have at least 95% of your original capital left. There is no option to change a trailing stop loss to a set stop loss (in order to keep the code as simple as possible), however, you can turn it off by setting Stop Loss Percent to 1.
I tried to keep the script itself lightweight and very easy to understand, so it's not very customizable in regards to input options. You can change stochastic data, as well as the trailing stop percentage. The script can be adjusted to other timeframes, however this requires a small change in the code (details in script comments). Changing just the "Higher Resolution" input will not produce expected results
My hope is that by keeping it lightweight and simple, it will be easier for you to adjust to your specific needs, or work into a larger strategy.

RSI+PA+DCA StrategyDear Tradingview community,
This RSI based trading strategy is created as a training exercise. I am not a professional trader, but a committed hobbyist. This not a finished trading strategy meant for trading, but more a combination of different trading ideas I liked to explore deeper. The aim with this exercise was to gain more knowledge and understanding about price averaging and dollar cost averaging strategies. Aside that I wanted to learn how to program a pyramiding strategy, how to plot different order entry layers and how to open positions on a specific time interval.
In this script I adapted code from a couple of strategy examples by Coinrule . Who wrote simple and powerful examples of RSI based strategies and pyramiding strategies.
Also the HOWTO scripts shared by vitvlkv were very helpful for this exercise. In the script description you can find all the sources to the code.
A PA strategy could be a helpful addition to ease the 'stress-management to buy when price drops and resolution in selling when the price is rising' (Coinrule).
The idea behind the strategy is fairly simple and is based on an RSI strategy of buying low. A position is entered when the RSI and moving average conditions are met. The position is closed when it reaches a specified take profit percentage. As soon as the first the position is openend multiple PA (price average) layers are setup based on a specified percentage of price drop. When the price crosses the layer another position with somewhat the same amount of assets is entered. This causes the average cost price (the red plot line) to decrease. If the price drops more, another similar amount of assets is bought with another price average decrease as result. When the price starts rising again the different positions are separately closed when each reaches its specified take profit. The positions can be re-openend when the price drops again. And so on. When the price rises more and crosses over the average price and reached the specified take profit on top of it, it closes all the positions at once and cancels all orders. From that moment on it waits for another price dip before it opens a new position.
Another option is to activate a DCA function that opens a position based on a fixed specified amount. It enters a position at the start of every week and only when there are already other positions openend and if the current price is below the average price of the position. Like this buying on a time interval can help lowering the average price in case the market is down.
I read in some articles that price averaging is also called dollar cost averaging as the result is somewhat the same. Although DCA is really based on buying on fixed time intervals. These strategies are both considered long term investment strategies that can be profitable in the long run and are not suitable for short term investment schemes. The downturn is that the postion size increases when the general market trend is going down and that you have to patiently wait until the market start rising again.
Another notable aspect is that the logic in this strategy works the way it does because the entries are exited based on the FIFO (first in first out) close entry rule. This means that the first exit is applied to the first entry position that is openend. In other words that when the third entry reaches its take profit level and exits, it actually exits the first entry. If you take a close look in the 'List of Trades' of your Strategy Tester panel, you can see that some 'Long1' entries are closed by an 'Exit 3' and not by an 'Exit 1'. This means that your trade partly loses, but causes a decrease in average price that is later balanced out by lower or repeated entering and closing other positions. You can change this logic to a real sequential way of closing your entries, but this changes the averaging logic considerably. In case you want to test this you need to change, in this line in the strategy call 'close_entries_rule = "FIFO"', the word FIFO to ANY.
In the settings you can specify the percentage of portfolio to use for each trade to spread the risk and for each order a trading fee of 0.075% is calculated.

MACD BTC Long/Short Strategy v1.0This strategy will use only default MACD with Simple MA(Signal Line) mode 'ON' to determine when it's time to long/short using its histogram value.
Current version has 2 more entries added to increase more trades and profits along the way while maintaining low 'max drawdown' and high returns.
Entry will be opened when macd line(blue) crossed with signal line(red).
Entry will be closed when histogram increased/decreased opposite its previous histogram.
Re-enter will opened a position when histogram continues after X delay (Re-enter Delay setting).
Sculp will opened a position when histogram is still in light colors for X delay (Sculp Delay setting).

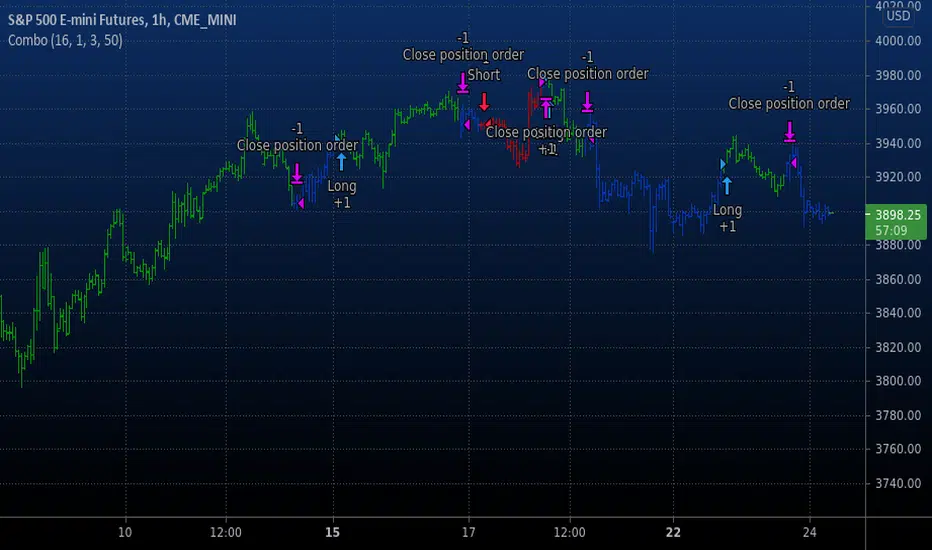
Combo Backtest 123 Percent change bar This is combo strategies for get a cumulative signal.
First strategy
This System was created from the Book "How I Tripled My Money In The
Futures Market" by Ulf Jensen, Page 183. This is reverse type of strategies.
The strategy buys at market, if close price is higher than the previous close
during 2 days and the meaning of 9-days Stochastic Slow Oscillator is lower than 50.
The strategy sells at market, if close price is lower than the previous close price
during 2 days and the meaning of 9-days Stochastic Fast Oscillator is higher than 50.
Second strategy
This histogram displays price or % change from previous bar.
WARNING:
- For purpose educate only
- This script to change bars colors.
Combo Backtest 123 Overbought/Oversold This is combo strategies for get a cumulative signal.
First strategy
This System was created from the Book "How I Tripled My Money In The
Futures Market" by Ulf Jensen, Page 183. This is reverse type of strategies.
The strategy buys at market, if close price is higher than the previous close
during 2 days and the meaning of 9-days Stochastic Slow Oscillator is lower than 50.
The strategy sells at market, if close price is lower than the previous close price
during 2 days and the meaning of 9-days Stochastic Fast Oscillator is higher than 50.
Second strategy
Simple Overbought/Oversold indicator
WARNING:
- For purpose educate only
- This script to change bars colors.

Crypto rsi cci mf stoch rsi oscillators all in one strategyThis is a strategy based on the popular oscillator like RSI, CCI, MF and Stochastic RSI oscillators.
In this situation I use a very high length , 100 candles, and the middle point between overbought and oversold levels at 50.
The entry for long is when all oscilators are above 50, and the exit is when they are below 50 + plus some minor modifications
If you have any questions, please message me a private message !

Combo Backtest 123 Negative Volume Index This is combo strategies for get a cumulative signal.
First strategy
This System was created from the Book "How I Tripled My Money In The
Futures Market" by Ulf Jensen, Page 183. This is reverse type of strategies.
The strategy buys at market, if close price is higher than the previous close
during 2 days and the meaning of 9-days Stochastic Slow Oscillator is lower than 50.
The strategy sells at market, if close price is lower than the previous close price
during 2 days and the meaning of 9-days Stochastic Fast Oscillator is higher than 50.
Second strategy
The theory behind the indexes is as follows: On days of increasing
volume, you can expect prices to increase, and on days of decreasing
volume, you can expect prices to decrease. This goes with the idea of
the market being in-gear and out-of-gear. Both PVI and NVI work in similar
fashions: Both are a running cumulative of values, which means you either
keep adding or subtracting price rate of change each day to the previous day`s
sum. In the case of PVI, if today`s volume is less than yesterday`s, don`t add
anything; if today`s volume is greater, then add today`s price rate of change.
For NVI, add today`s price rate of change only if today`s volume is less than
yesterday`s.
WARNING:
- For purpose educate only
- This script to change bars colors.
Combo Backtest 123 Reversal & N Bars Up This is combo strategies for get a cumulative signal.
First strategy
This System was created from the Book "How I Tripled My Money In The
Futures Market" by Ulf Jensen, Page 183. This is reverse type of strategies.
The strategy buys at market, if close price is higher than the previous close
during 2 days and the meaning of 9-days Stochastic Slow Oscillator is lower than 50.
The strategy sells at market, if close price is lower than the previous close price
during 2 days and the meaning of 9-days Stochastic Fast Oscillator is higher than 50.
Second strategy
Evaluates for n number of consecutive higher closes. Returns a value
of 1 when the condition is true or 0 when false.
WARNING:
- For purpose educate only
- This script to change bars colors.

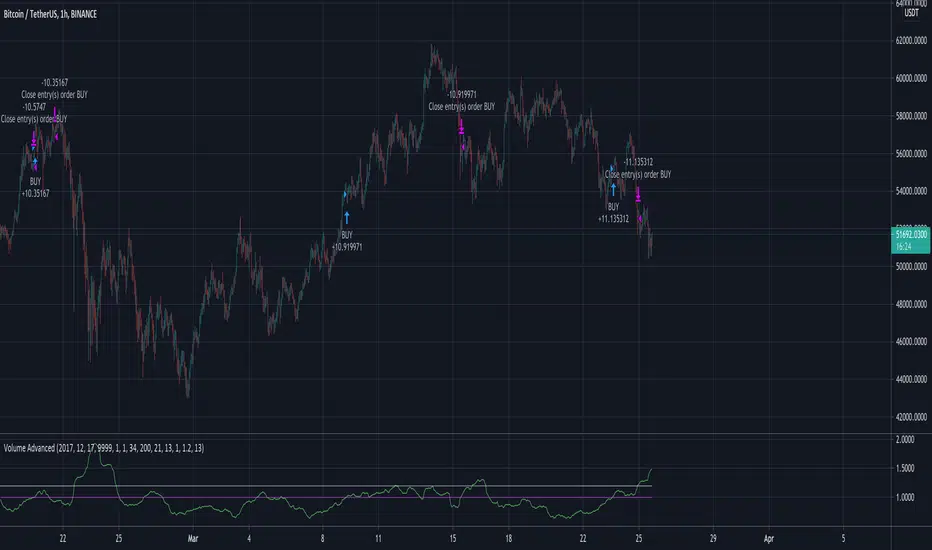
Volume AdvancedI have found out this script some time ago. In fact it is not my code (just have modified a little) and I don't know the author (couldn't find). So now I would like to share with the community, maybe somebody would have some idea how to make it better. The script itself is modified volatility oscillator (like ATR) based on volume, making a deal at the moment of price change. To recognize the current trend I have add simple function just to compare the current price with the N bars before, because sometimes in moments of high volatility there may be wrong signals.
Combo Backtest 123 Reversal & N Bars Down This is combo strategies for get a cumulative signal.
First strategy
This System was created from the Book "How I Tripled My Money In The
Futures Market" by Ulf Jensen, Page 183. This is reverse type of strategies.
The strategy buys at market, if close price is higher than the previous close
during 2 days and the meaning of 9-days Stochastic Slow Oscillator is lower than 50.
The strategy sells at market, if close price is lower than the previous close price
during 2 days and the meaning of 9-days Stochastic Fast Oscillator is higher than 50.
Second strategy
Evaluates for n number of consecutive lower closes. Returns a value
of 1 when the condition is true or 0 when false.
WARNING:
- For purpose educate only
- This script to change bars colors.

Combo Backtest 123 Reversal & MovROC (KST indicator) This is combo strategies for get a cumulative signal.
First strategy
This System was created from the Book "How I Tripled My Money In The
Futures Market" by Ulf Jensen, Page 183. This is reverse type of strategies.
The strategy buys at market, if close price is higher than the previous close
during 2 days and the meaning of 9-days Stochastic Slow Oscillator is lower than 50.
The strategy sells at market, if close price is lower than the previous close price
during 2 days and the meaning of 9-days Stochastic Fast Oscillator is higher than 50.
Second strategy
This indicator really is the KST indicator presented by Martin Pring.
the KST indicator is a weighted summed rate of change oscillator that
is designed to identify meaningful turns. Various smoothed rate of change
indicators can be combined to form different measurements of cycles.
WARNING:
- For purpose educate only
- This script to change bars colors.
McClellan Oscillator StrategyBuy and sell programs when 5 day EMA goes above and below zero, respectively.
Useful for LEVERAGED ETF trading such as SPXL, TECL, FNGU, etc. Not so much for general portfolio holdings.

Combo Backtest 123 Reversal & Moving Average Envelopes This is combo strategies for get a cumulative signal.
First strategy
This System was created from the Book "How I Tripled My Money In The
Futures Market" by Ulf Jensen, Page 183. This is reverse type of strategies.
The strategy buys at market, if close price is higher than the previous close
during 2 days and the meaning of 9-days Stochastic Slow Oscillator is lower than 50.
The strategy sells at market, if close price is lower than the previous close price
during 2 days and the meaning of 9-days Stochastic Fast Oscillator is higher than 50.
Second strategy
Moving Average Envelopes are percentage-based envelopes set above and
below a moving average. The moving average, which forms the base for
this indicator, can be a simple or exponential moving average. Each
envelope is then set the same percentage above or below the moving average.
This creates parallel bands that follow price action. With a moving average
as the base, Moving Average Envelopes can be used as a trend following indicator.
However, this indicator is not limited to just trend following. The envelopes
can also be used to identify overbought and oversold levels when the trend is
relatively flat.
WARNING:
- For purpose educate only
- This script to change bars colors.
HiLo Extension This Strategy is finding high and low breaks of the day and enter into the trader based on RSI value and time value
1) This strategy is created for Indian Index like Nifty, Bank Nifty and so...
2) Trades are initiate only after 10:15 AM and before 3:10PM
3) High and Low of the day break will be check during the above time frame
4) RSI value will be check (RSI 50)
5) and trade will be initiate
6) Stop loss set as vwma 20...
Note: This Script will work fine in Index future chart not index spot chart...
This is just my idea only... Please back test yourselve, before using it..
Your comments are welcome!

Momentum Strategy (BTC/USDT; 1h) - MACD (with source code)Good morning traders.
It's been a while from my last publication of a strategy and today I want to share with you this small piece of script that showed quite interesting result across bitcoin and other altcoins.
The macd indicator is an indicator built on the difference between a fast moving average and a slow moving average: this difference is generally plottted with a blue line while the orange line is simply a moving average computed on this difference.
Usually this indicator is used in technical analysis for getting signals of buy and sell respectively when the macd crosses above or under its moving average: it means that the distance of the fast moving average (the most responsive one) from the slower one is getting lower than what it-used-to-be in the period considered: this could anticipate a cross of the two moving averages and you want to anticipate this potential trend reversal by opening a long position
Of course the workflow is specularly the same for opening short positions (or closing long positions)
What this strategy does is simply considering the moving average computed on macd and applying a linear regression on it: in this way, even though the signal can be sligthly delayed, you reduce noise plotting a smooth curve.
Then, it simply checks the maximums and the minimums of this curve detecting whenever the changes of the values start to be negative or positive, so it opens a short position (closes long) on the maximum on this curve and it opens a long position (closes short) on the minimum.
Of course, I set an option for using this strategy in a conventional way working on the crosses between macd and its moving average. Alternatively you can use this workflow if you prefer.
In conclusion, you can use a tons of moving averages: I made a function in pine in order to allw you to use any moving average you want for the two moving averages on which the macd is based or for the moving average computed on the macd
PLEASE, BE AWARE THAT THIS TRADING STRATEGY DOES NOT GUARANTEE ANY KIND OF SUCCESS IN ADVANCE. YOU ARE THE ONE AND ONLY RESPONSIBLE OF YOUR OWN DECISIONS, I DON'T TAKE ANY RESPONSIBILITY ASSOCIATED WITH THEM. IF YOU RUN THIS STRATEGY YOU ACCEPT THE POSSIBILITY OF LOOSING MONEY, ALL OF MY PUBBLICATIONS ARE SUPPOSED TO BE JUST FOR EDUCATIONAL PURPOSES.
IT IS AT YOUR OWN RISK WHETHER TO USE IT OR NOT
But if you make money out of this, please consider to buy me a beer 😜
Happy Trading!

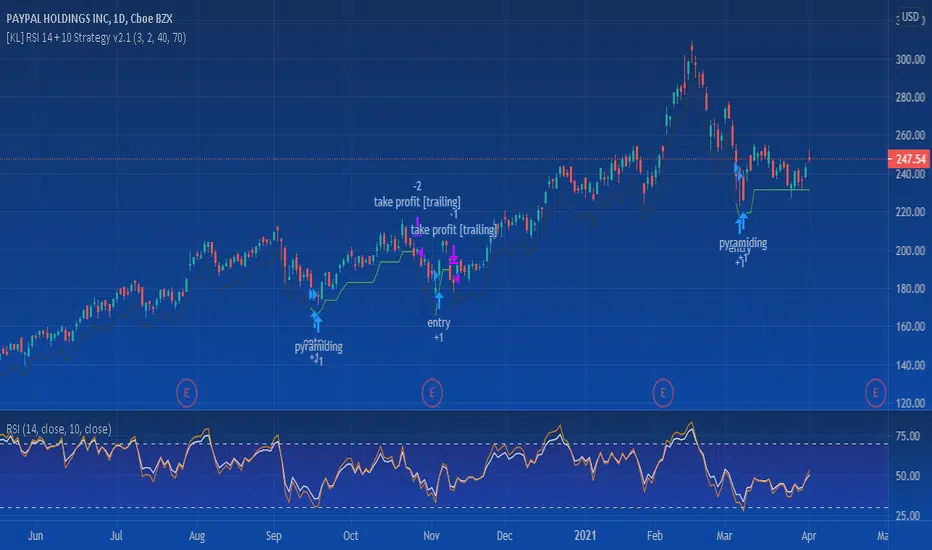
[KL] RSI 14 + 10 StrategyThis strategy uses RSI14 for entry and exit signals; applies RSI10 for confirmation. The thresholds can adjusted in Settings.
Trailing stop can also be applied if wanted.
Tested on daily/hourly charts.
Delta-RSI Strategy (with filters)Delta-RSI Strategy (with filters):
This is a version of the Delta-RSI Oscillator strategy with several criteria available to filter entry and exit signals. This script is also suitable for backtesting over a user-defined period and offers several risk management options (take profit and stop loss).
Since the publication of the Delta-RSI Oscillator script, I have been asked many times to make it compatible with the Strategy Tester and add filtering criteria to minimize "false" signals. This version covers many of these requests. Feel free to insert your favorite D-RSI parameters and play around!
ABOUT DELTA-RSI
Delta-RSI represents a smoothed time derivative of the RSI designed as a momentum indicator (see links below):
INPUT DESCTIPTION
MODEL PARAMETERS
Polynomial Order : The order of local polynomial used to interpolate the relative strength index (RSI).
Length : The length of the lookback frame where local regression is applied.
RSI Length : The timeframe of RSI used as input.
Signal Length : The signal line is a EMA of the D-RSI time series. This input parameter defines the EMA length.
ALLOWED ENTRIES
The strategy can include long entries, short entries or both.
ENTRY AND EXIT CONDITIONS
Zero-crossing : bullish trade signal triggered when D-RSI crosses zero from negative to positive values (bearish otherwise)
Signal Line Crossing : bullish trade signal triggered when D-RSI crosses from below to above the signal line (bearish otherwise)
Direction Change : bullish trade signal triggered when D-RSI was negative and starts ascending (bearish otherwise)
APPLY FILTERS TO
The filters (described below) can be applied to long entry, short entry and exit signals.
RELATIVE VOLUME FILTER
When activated, the D-RSI-driven entries and exits will be triggered only if the current volume is greater than N times the average over the last M bars.
VOLATILITY FILTER
When activated, the D-RSI-driven entries and exits will be triggered only if the N-period average true range, ATR, is greater than the M-period ATR. If N < M, this condition implies increasing volatility.
OVERBOUGHT/OVERSOLD FILTER
When activated, the D-RSI-driven entries and exits will be triggered only if the value of 14-period RSI is in the range between N and M.
STOP LOSS/TAKE PROFIT
Fixed and trailing stop loss as well as take profit options are available.
FIXED BACKTESTING START/END DATES
If the checkboxes are not checked, the strategy will backtest all available price bars.

Combo Backtest 123 Reversal & MA Displaced EnvelopeThis is combo strategies for get a cumulative signal.
First strategy
This System was created from the Book "How I Tripled My Money In The
Futures Market" by Ulf Jensen, Page 183. This is reverse type of strategies.
The strategy buys at market, if close price is higher than the previous close
during 2 days and the meaning of 9-days Stochastic Slow Oscillator is lower than 50.
The strategy sells at market, if close price is lower than the previous close price
during 2 days and the meaning of 9-days Stochastic Fast Oscillator is higher than 50.
Second strategy
Moving Average Displaced Envelope. These envelopes are calculated
by multiplying percentage factors with their displaced expotential
moving average (EMA) core.
How To Trade Using:
Adjust the envelopes percentage factors to control the quantity and
quality of the signals. If a previous high goes above the envelope
a sell signal is generated. Conversely, if the previous low goes below
the envelope a buy signal is given.
WARNING:
- For purpose educate only
- This script to change bars colors.

Risk Reduction Ultimate TemplateThis is a template not actually meant for trading. I picked two random oscillators. This is a template meant to turn into a live trading strategy, however.
It's literally just a specialized take profit/stop loss system. It is to ensure your bot doesn't make any bad moves that you wouldn't have manually. The code should be pretty well annotated. Putting this into my scripts has made them much better. I will work on a Multiple Trigger template next.
