Stochastic & MACD Strategy Ver 1.0This strategy is inspired by ChartArt and jasonluk28.
The following input changes from the initial ChartArt version to achieve higher stability and profit:
Fast MA Len:11
Slow MA len: 24
Stoch Len: 20
No difference is found in minor changes (+-10) lv. of overbought/oversold
It works above 40% winning rate in Heng Heng Index, Shanghai Composite, Dow Jones Industrial Averge, S&P 500 NASDAQ, VT (World Total Market) and in 15 mins chart
Profit: above ~10 to 30% in less than 1year backtest for most major indice of China and US and ~62% in Heng Seng Index (Hong Kong) & 40.5% in SZSE Composite (Shen Zhen)
P.S. Profit: 700 (Tencent) +150.5%, 939 (CCB) +66.5%, 1299 (AIA) +45%, 2628 (CLIC) +41%, 1 (CK Hutchison) +31%
NFLX +82.5%, BABA +55.5%, AMZN +44%, GOOG +38%, MCD +24.5%
However, Loss in FB -19% , AMD -38.5%
Not suitable for stocks with great influences in News or Events ???
Pengayun
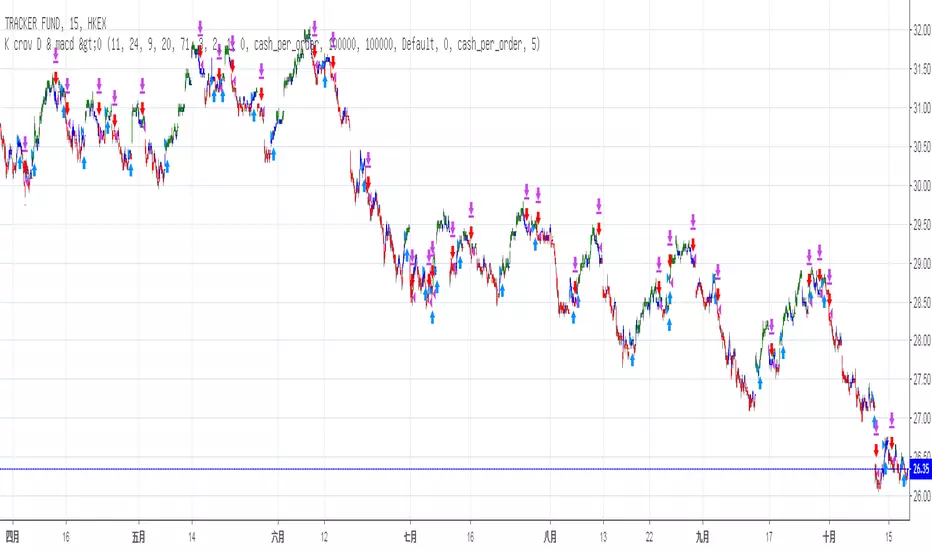
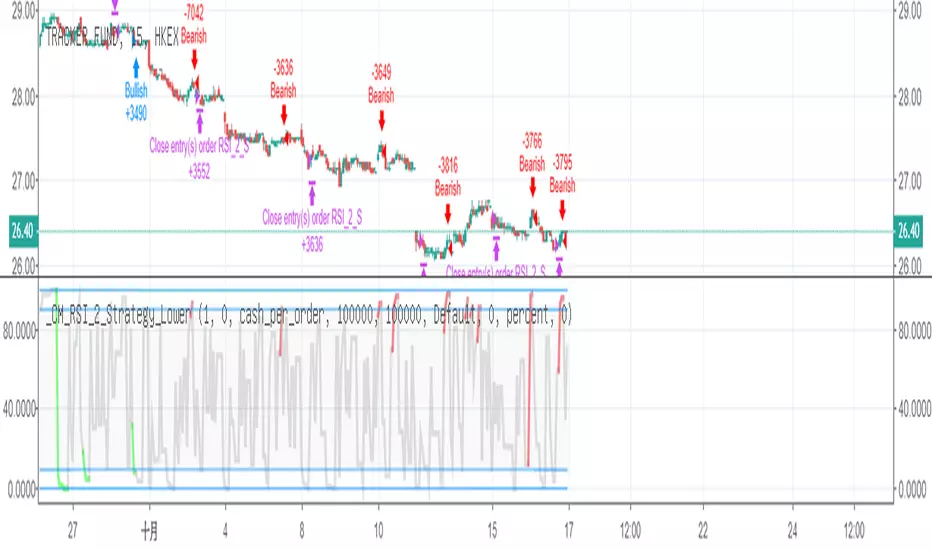
RSI-2 Larry Connars for 15 min KOnly Long when close > ma120 and rsi < 10 and rsi >1
平倉WHEN close > ma5 and ma1 穿 ma3

Intellitrader - Buy Random BACKTESTERI created a little backtester that it combines some of what we need to backtest to finetune a good strategy for Intellitrader.
RSI
STOCH
STOCHRSI
CCI
Price Change

TDI - Traders Dynamic Index - Roshan [Mehdi]This method is based on Mr. Roshan's technique which use TDI with upper timeframe


MCI and VCI - Modified CCI FormulasFor private peeps only
- Takes a modified version of the CCI formula into 2 parts
VCI - Volume Channel Index (Yellow Histogram)
- Measures accurate accumulation and distribution levels and times
MCI - Modified Channel Index
- Measures (when compared to VCI) levels where clearly buys are interested vs not interested.
Example:
If VCI > MCI
- Shows buyer's are more than interested in buying, you've either hit a bottom or heavy resistance
if MCI > VCI
- Show's buyer's aren't interested and will most likely result in a dump/lower price
Great for monitoring accumulation and distribution, these auto buy and sells look for the transition points over 0, works on EVERY commodity/stock/FOREX/Crypto
Results are from trading 1 BTC x25 leveraging. Not all trades will get in if put in at limit, but it does survive with profits after the massive 0.075 fee (results shown are after fees)

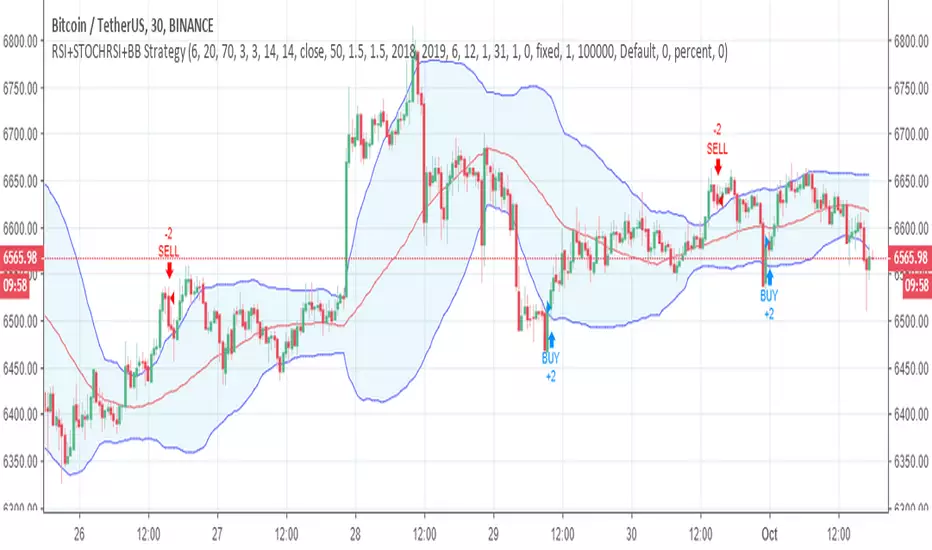
BB+STOCH RSI v2Developed for one of my followers.
The basic idea is that the buy signal is generated by stoch and bb.
However, If price hits the upper line or trend return crossing under midline, the strategy closes the position.

RSI MACD with conditional MA indicator backtestingbacktesting for the RSI MACD with conditional MA indicator:
Noro's Shift Close Strategy v1.0It is Noro's Shift MA strategy, but looks as the oscillator. Positions open at the time of closing of a candle. Not the limit order. It is possible to use a pyramiding.

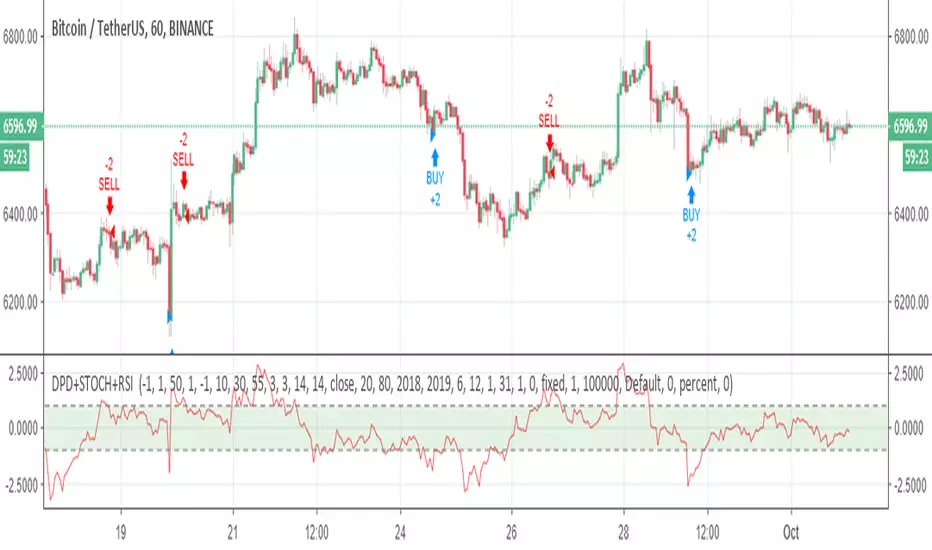
DPD+STOCH RSI +RSI Combination of DPD ,STOCHRSI and RSI indicators. Be careful for percantage selection to fit your candle size.
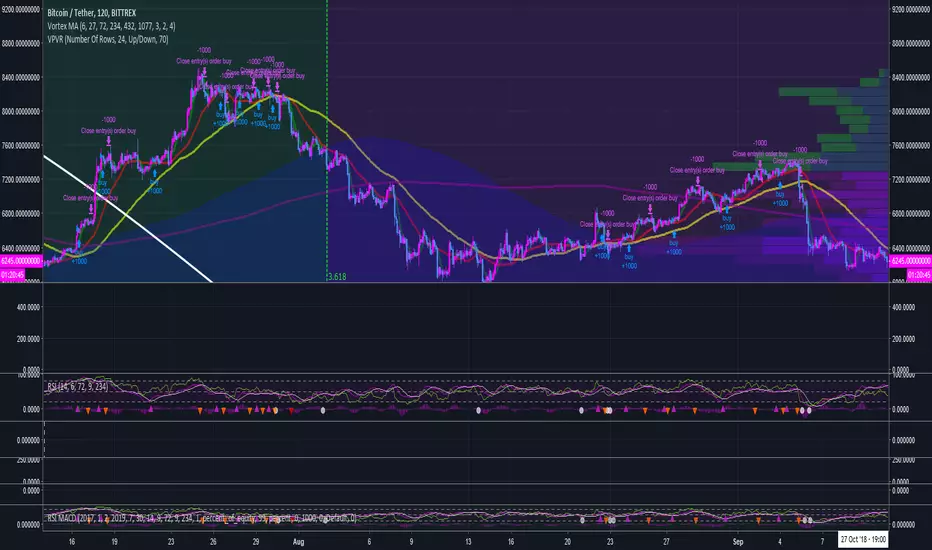
Vortex Ocillator - backtestingbacktesting strategy for the vortex oscilator indicator, slightly modified on this version so that the buy and sell signals work with the backtesting and are consistant
original idea i posted by accident
the script with alerts
not intended to be financial advice, strategy is for made for testing
Biffy

APEX - Tester - Buy/Sell Strategies - Basic - BACKTESTERThis is a upgraded version of the following study.
This is a simple Strategy for backtesting your APEX trading ideas.
Be aware that the results will not be exact same as with apex bot.

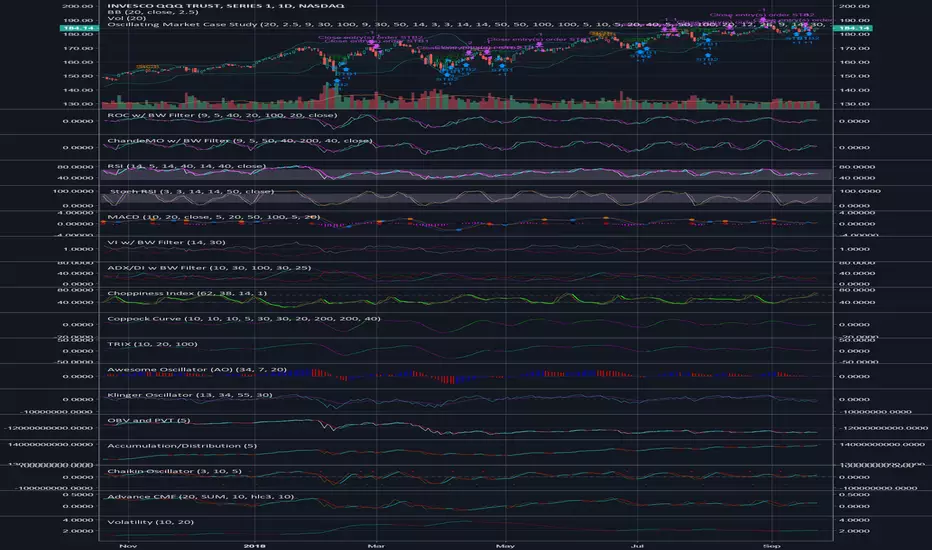
Oscillating Market Case StudyThis is a little something I created to analyze the market. Ultimately, I wanted to create something that could encapsulate the entire market as best as possible. The idea was simple, use technical analysis to create cases that would indicate entry positions and exit positions for long positions initially. After completing that, I decided to add a few shorting cases.
A combination of 25-30 indicators were used to create this, and the indicators were modified with a filter to create a smoothed overlay.
So here's the breakdown:
- 10 total cases: 7 long, 3 short
- The 7 long cases are broken down into three categories; long term, medium term, short term
- Short Term: OC1, OC2, STB1, STB2
- Medium Term: STB1, STB2
- Long Term: LTB1
- Shorting Cases: SC1, SC2, SC3
- The cases are both plotted as text and entry orders; this can be toggled on and off through the format menu.
I suggest you use the format menu to get the most out of this script. The menu consists of toggles to turn of the plots and/or the entries. It's pretty self explanatory. Use it to keep the chart cleared and concise so you only visualise the cases that you need.
Personally, the cases that have worked the best for me are:
- Long Cases: OC1, OC2, STB2, LTB1
- Shorting Cases: SC2, SC3
I kept this description as short as possible, but please feel free to reach out if you have any questions.
Pretty much, use the cases and see if it works for you.

Ergotic MACD Strategy [forked from HPotter]Ergotic MACD Strategy forked from HPotter
In addition to this fine script you will find some additional features:
- Backtester
- Alerts
- Filters: RSI, MFI, Price trend
- Trailing Stop Loss
- Other minor adjustments

Ehlers Fisher Stochastic Relative Vigor Index StrategyBy John Ehlers from his book "Cybernetic Analysis for Stocks and Futures".

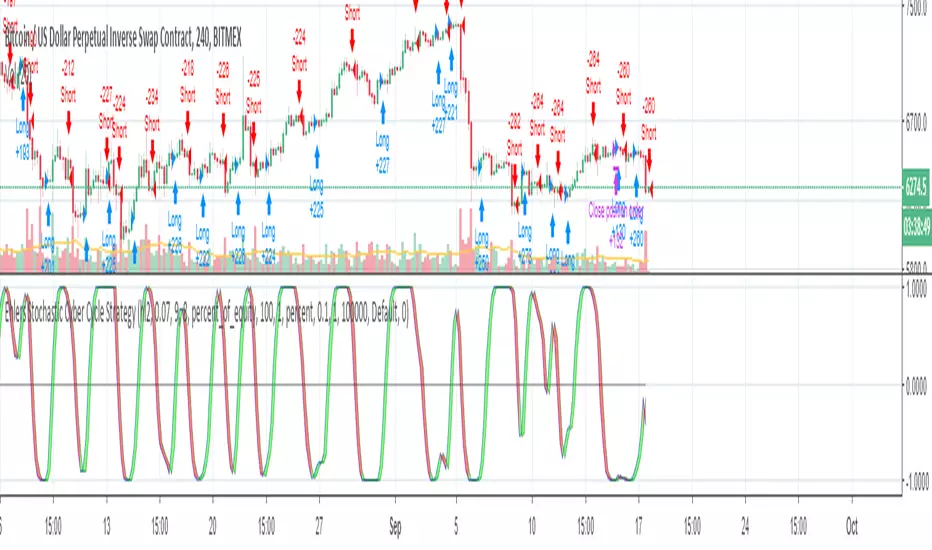
Ehlers Stochastic Cyber Cycle StrategyBy John Ehlers from his book "Cybernetic Analysis for Stocks and Futures".
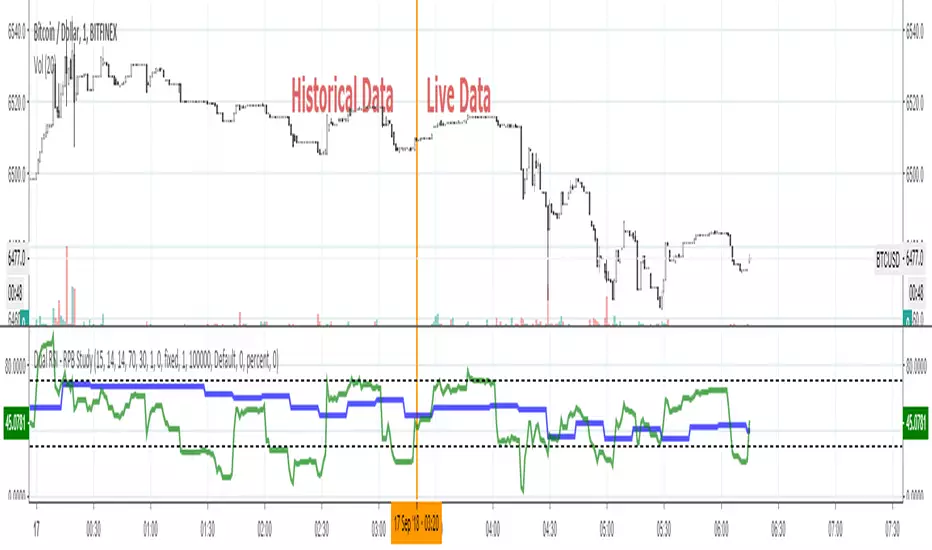
Upper Timeframe - Repaint FixThis script is a proof of concept and one possible solution for how to deal with upper timeframe repainting issues. It works for Strategies only .
Strategies that utilize data from upper timeframes can still be subject to repainting issues when forward testing. Users can copy the code and use a similar solution in your own scripts.
For full code commentary, explanations and examples visit the backtest-rookies (.com) website.
[BoTo] RSI Trend StrategyOpen source code.
It is very old trade strategy. It is older than you :) Uses the RSI indicator. The RSI indicator has described Welles Wilder in the book in 1978. And all this is still profitable!
Additional articles
1. en.wikipedia.org
2. en.wikipedia.org
3. www.tradingview.com(RSI)
How it works
Step 1. The user chooses length for RSI
Step 2. If RSI is more than 50, then it is a uptrend and the long position opens. It is necessary to close a short position if it is opened earlier.
Step 3. If RSI is less than 50, that is a downtrend and the short position opens. It is necessary to close a long position if it is opened earlier.
Well is suitable for the market of cryptocurrencies. Well length from 3 to 7 approaches. Don't use length 14 because for cryptocurrencies it is too much. Cryptocurrencies it is very volatile market. You can also use the RSI indicator which is built in on TradingView.com.


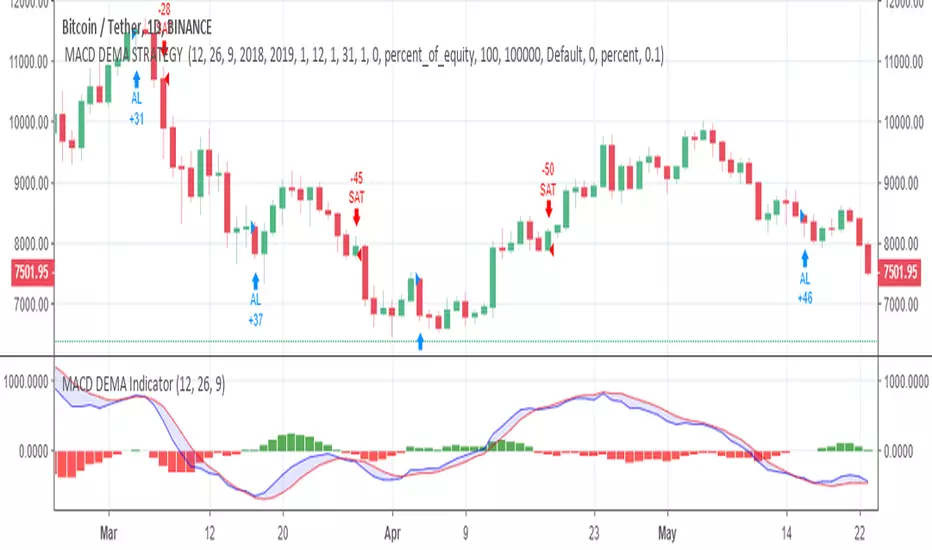
MACD DEMA STRATEGY A strategy based on ToFFF MACD DEMA indicator
Even so , ı dont recommended using MACD DEMA alone.
Combine its code with your favorite indicators.
You can visit ToFFF's indicator :