KZ One — Scalping Training StrategyKZ One is a scalping strategy developed for M1 and M5 timeframes. It is designed to help traders study and practice short-term market behavior by using structured zones to highlight potential entry and exit areas. The strategy allows customization of Risk (USD) and Take Profit (R multiple) parameters for flexible trade management. Additional tools include ATR-based filters to skip low-volatility conditions and a Pre-Alert Lead (bars) option that notifies users ahead of possible setups. KZ One is intended for educational and analytical purposes, promoting disciplined and consistent trading practice.
Penunjuk dan strategi

HEK Dinamik Fiyat Kanalı Stratejisi v1HEK Dynamic Price Channel Strategy
Concept
The HEK Dynamic Price Channel provides a channel structure that expands and contracts according to price momentum and time-based equilibrium.
Unlike fixed-band systems, it evaluates the interaction between price and its balance line through an adaptive channel width that dynamically adjusts to changing market conditions.
How It Works
When the price reacts to the midline, the channel bands automatically reposition themselves.
Touching the upper band indicates a strengthening trend, while touching the lower band signals weakening momentum.
This adaptive mechanism helps filter out false signals during sudden directional changes, enhancing overall signal quality.
Advantages
✅ Maintains trend continuity while avoiding overtrading.
✅ Automatically adapts to changing volatility conditions.
✅ Detects early signals of short- and mid-term trend reversals.
Applications
Directional confirmation in spot and futures markets.
A supporting tool in channel breakout strategies.
Identifying price consolidation and equilibrium zones.
Note
This strategy is intended for educational and research purposes only.
It should not be considered financial advice. Always consult a professional financial advisor before making investment decisions.
© HEK — Adaptive Channel Approach on Dynamic Market Structures
6 gün önce
Sürüm Notları
HEK Dynamic Price Channel Strategy
Concept
The HEK Dynamic Price Channel provides a channel structure that expands and contracts according to price momentum and time-based equilibrium.
Unlike fixed-band systems, it evaluates the interaction between price and its balance line through an adaptive channel width that dynamically adjusts to changing market conditions.
How It Works
When the price reacts to the midline, the channel bands automatically reposition themselves.
Touching the upper band indicates a strengthening trend, while touching the lower band signals weakening momentum.
This adaptive mechanism helps filter out false signals during sudden directional changes, enhancing overall signal quality.
Advantages
✅ Maintains trend continuity while avoiding overtrading.
✅ Automatically adapts to changing volatility conditions.
✅ Detects early signals of short- and mid-term trend reversals.
Applications
Directional confirmation in spot and futures markets.
A supporting tool in channel breakout strategies.
Identifying price consolidation and equilibrium zones.
Note
This strategy is intended for educational and research purposes only.
It should not be considered financial advice. Always consult a professional financial advisor before making investment decisions.
© HEK — Adaptive Channel Approach on Dynamic Market Structures

BUY LOW, BUY MORE, SELL HIGH -BUFFET STRATEGY LITE__________________________________________________________________________
Buy Low, Buy More, Sell High With Buffett Meter (LITE – JTMarketAI)
__________________________________________________________________________
Category: Quantitative Momentum & Liquidity Flow
Author: JTMarketAI
Architecture: Non-Repainting
This strategy accumulates into validated pullbacks during fear cycles, scales intelligently as price declines into liquidity support, and exits when momentum weakens after meaningful run-ups. It uses synthetic higher-timeframe OHLC data (non-repainting), liquidity imbalance confirmation, adaptive KAMA trend logic, RSI validation, and a live Buffett macro valuation gauge.
This is a patient, conviction-based accumulation engine designed for equities.
It is not a scalp bot.
__________________________________________________________________________
Core Features
__________________________________________________________________________
Non-repainting (confirmed bars only)
Synthetic HTF OHLC (no lookahead)
Dynamic trailing exit preserves ~80–87% of peak profit
Bull vs Bear liquidity dominance and flow imbalance
Rolling lowest-low tracking (LLL)
NY-session alignment (default)
Buffett Macro Meter integration
Technical Highlights
Flow-confidence derived from volume-order pressure
Adaptive KAMA smoothing for lower-lag confirmation
Daily > Weekly > Monthly synthetic aggregation
LLL progression display for trend exhaustion
Fully profiler-optimized
Supports averaging down when pyramiding enabled
__________________________________________________________________________
Why It Does Not Repaint
__________________________________________________________________________
All state updates occur only on confirmed bars
Synthetic HTFs built without lookahead
Persistent arrays freeze historical values
Trailing highs updated only after confirmation
No forward-reference to future bars
__________________________________________________________________________
Lite Edition Notes
__________________________________________________________________________
Manual trading focused
Buffett Meter enabled
Up to 20 trades per session
Visual dashboard included
No alerts, automation, or webhooks (PRO unlocks IBKR + TradersPost)
__________________________________________________________________________
Limitations
__________________________________________________________________________
Best on intraday equities (1m–4h)
Designed for US stocks only
High-resource if full visuals enabled
Avoid penny stocks and extremely low-volume tickers
Does not guard against after-hours gaps or major news moves
__________________________________________________________________________
Warnings
__________________________________________________________________________
Contrarian scaling requires discipline and patience
Expect longer-duration trades, not rapid scalps
Use on quality tickers unlikely to permanently collapse
Confirm price behavior outside cash session
Test manually before automating anything
Not suitable for every market environment or asset
Notes on Philosophy
This strategy attempts to accumulate when markets overshoot lower, and distribute after recovery momentum fades. It reflects a patient, value-driven approach built on the principle of buying fear and reducing exposure into strength.
__________________________________________________________________________
Disclaimer
__________________________________________________________________________
For research and educational use only. Not financial advice. Past performance does not guarantee future results. Test thoroughly and use appropriate risk management.
__________________________________________________________________________
Hashtags
__________________________________________________________________________
#buffett #quantstrategy #valuemomentum #accumulation #contrarian #nonrepaint #equitystrategy #swingtrading #liquidityanalysis #synthetichtf #tradingviewstrategy

Vandan V2Vandan V2 is an automated trading strategy for NQ1! (E-mini Nasdaq-100) based on short-term mean reversion with dynamic risk control. It combines volatility filters and overbought/oversold signals to capture local market imbalances.
Backtested from 2015 to 2025, it achieved a +730% total return, Profit Factor of 1.40, max drawdown of only 1.61%, and over 106,000 trades. Designed for systematic scalping or intraday arbitrage with a limit of 3 simultaneous contracts.

BUY LOW, BUY MORE, SELL HIGH - MARKET FLOW STRATEGY LITE
TV Description - Buffett Meter Lite
body{font-family:Arial,Helvetica,sans-serif;max-width:900px;margin:32px auto;line-height:1.4} h1,h2{margin:16px 0 8px}
Buy Low, Buy More, Sell High With Buffett Meter (Lite v1283 – JTM)
Category: Quantitative Momentum & Liquidity Flow
Author: JTM
Architecture: Non-Repainting
This strategy accumulates into validated pullbacks during fear cycles, scales intelligently as price declines into liquidity support, and exits when momentum weakens after meaningful run-ups. It uses synthetic higher-timeframe OHLC data (non-repainting), liquidity imbalance confirmation, adaptive KAMA trend logic, RSI validation, and a live Buffett macro valuation gauge.
This is a patient, conviction-based accumulation engine designed for equities.
It is not a scalp bot.
Core Features
Non-repainting (confirmed bars only)
Synthetic HTF OHLC (no lookahead)
Dynamic trailing exit preserves ~80–87% of peak profit
Bull vs Bear liquidity dominance and flow imbalance
Rolling lowest-low tracking (LLL)
NY-session alignment (default)
Buffett Macro Meter integration
Technical Highlights
Flow-confidence derived from volume-order pressure
Adaptive KAMA smoothing for lower-lag confirmation
Daily > Weekly > Monthly synthetic aggregation
LLL progression display for trend exhaustion
Fully profiler-optimized
Supports averaging down when pyramiding enabled
Why It Does Not Repaint
All state updates occur only on confirmed bars
Synthetic HTFs built without lookahead
Persistent arrays freeze historical values
Trailing highs updated only after confirmation
No forward-reference to future bars
Lite Edition Notes
Manual trading focused
Buffett Meter enabled
Limit of 20 trades per session
Buffet Meter dashboard included
No alerts, automation, or webhooks (PRO unlocks IBKR + TradersPost)
Limitations
Best on intraday equities (1m–4h)
Designed for US stocks only
High-resource if full visuals enabled
Avoid penny stocks and extremely low-volume tickers
Does not guard against after-hours gaps or major news moves
Warnings
Contrarian scaling requires discipline and patience
Expect longer-duration trades, not rapid scalps
Use on quality tickers unlikely to permanently collapse
Confirm price behavior outside cash session
Test manually before automating anything
Not suitable for every market environment or asset
Notes on Philosophy
This strategy attempts to accumulate when markets overshoot lower, and distribute after recovery momentum fades. It reflects a patient, value-driven approach built on the principle of buying fear and reducing exposure into strength.
This is edge-based, not “trade every wiggle” logic
“Be fearful when others are greedy, and greedy when others are fearful.” — Buffett
“The stock market transfers money from the impatient to the patient.” — Buffett
Disclaimer
For research and educational use only. Not financial advice. Past performance does not guarantee future results. Test thoroughly and use appropriate risk management.
Hashtags
#buffett #quantstrategy #valuemomentum #accumulation #contrarian #nonrepaint #equitystrategy #swingtrading #liquidityanalysis #synthetichtf #tradingviewstrategy

TMB Invest - Smart Money Concept StrategyEnglish:
**Quick Overview**
The "TMB_SMC_Strategy_v1.1.3" combines a classic trend filter using two EMAs with contrarian RSI entries and simple SMC elements (Fair Value Gaps & Order Blocks). Stop-loss and take-profit orders are volatility-adaptive and controlled via the ATR. An integrated dashboard displays the setup status, stop-loss/take-profit levels, entry reference, and trend, RSI, and ATR values.
---
## Operating Principle
1. **Trend Filter:** A fast EMA (default 50) is compared to a slow EMA (default 200). Trading occurs only in the direction of the trend: long in uptrends, short in downtrends.
2. **Timing via RSI:** Contrarian entries within the trend. Go long when the RSI is below a buy level (default 40); Short when the RSI is above a sell level (standard 60).
3. **Structure Check (SMC Proxy):** An "FVG Touch" serves as additional confirmation that an inefficient price zone has been tested. Order blocks are visualized for guidance but are not a direct entry trigger.
4. **Risk Management via ATR:** Stop-loss and take-profit levels are set as multipliers of the current ATR (e.g., SL = 1×ATR, TP = 2×ATR). This allows target and risk distances to adjust to market volatility.
5. **Simple Position Logic:** Only one position is held at a time (no pyramiding). After entry, stop and limit orders (bracket exit) are automatically placed.
---
## Input Values
* **EMA Fast / EMA Slow:** Lengths of the moving averages for the trend filter.
* **RSI Length / Levels:** Length of the RSI as well as buy and sell thresholds (contra signals within the trend direction).
* **Take Profit (RR) / Stop Loss (RR):** ATR multipliers for TP and SL.
* **Show FVGs & Order Blocks:** Toggles the visual SMC elements (zones/boxes) on or off.
--
## Signals & Execution
* **Long Setup:** Uptrend (fast EMA above slow EMA) **and** RSI below the buy level **and** a current FVG signal in a bullish direction.
* **Short Setup:** Downtrend (fast EMA below slow EMA) **and** RSI above the sell level **and** a current FVG touch in a bearish direction.
* **Entry & Exit:** If the setup is met, the market is entered; stop-loss/take-profit orders are placed immediately according to ATR multiples.
--
## Visualization
* **EMAs:** The fast and slow EMAs are plotted to illustrate the trend.
* **FVGs:** Fair Value Gaps are drawn as semi-transparent boxes in the trend color and projected slightly into the future.
* **Order Blocks:** Potential order block zones from the previous candle are visually highlighted (for informational purposes only).
---
## Integrated Dashboard
A compact table dashboard (bottom left) displays:
* Current **Setup Status** (Long/Short active, Long/Short ready, No Setup),
* **Stop-Loss**, **Take-Profit**, and **Entry Reference**,
* **Trend Status** (Bull/Bear/Sideways),
* **RSI Value**, and **ATR Value**.
Active long/short positions are highlighted in color (green/red).
--
## Practical Guide
1. **Place on Chart** and select the desired timeframe.
2. **Calibrate Parameters** (EMA lengths, RSI levels, ATR multipliers) to match the market and timeframe.
3. **Backtest** across different market phases; prioritize robustness over maximum curve fit.
4. **Fine-Tuning:**
* Shorter EMAs are often useful intraday (e.g., 20/100 or 34/144).
* Adjust RSI levels to market characteristics (45/55 for aggressive trading, 30/70 for conservative trading).
* Increase or decrease ATR multipliers depending on volatility/trading style.
--
## Notes, Limitations & Extensions
* **FVG Definition:** The FVG detection used here is intentionally simplified. Those who prefer a more rigorous approach can switch to a 3-candle definition and fill levels.
* **Order Blocks:** These primarily serve as a guide. Integration into entry/exit logic (e.g., retests) is possible as an extension.
* **Backtest Realism:** Fills may differ from the displayed closing price. For greater accuracy, intrabar backtests or an entry indicator based on the average position price are conceivable.
* **Alerts:** Currently, no alert conditions are defined; these can be added for long/short setups and status messages.
* **Position Management:** By default, no scaling is performed. Partial sales, trailing stops, or multiple entries can be added.
---
## Purpose & Benefits
The strategy offers a clear, modular framework: trend filter (direction), RSI contra timing (entry), SMC proxy via FVG Touch (structure), and ATR-based exits (risk adaptation). This makes it robust, easy to understand, and highly extensible—both for discretionary traders who appreciate visual SMC elements and for systematic testers who prefer a clean, parameterizable foundation.

《趨勢跟蹤》拜讀趨勢跟蹤這本書非常喜歡,根據書中內容製作出來的指標,包含:順勢交易、多空都做、加碼和風控。
t.me
《Trend Following》
I really enjoyed reading the book Trend Following. The indicators created based on the book's content include: momentum trading, going long and short, pyramiding, and risk control.

WIN1! • Crossing EMAs• (By Mesquita, v7)Moving average crossover strategy for intraday movements, especially in the continuous index (WIN1!) on the Brazilian stock exchange B³. The strategy is customizable for time windows, has a filter for trades only above the long-term average, whether only long, only short, or both, with or without stop loss.

Roboquant RP Profits NY Open Retest StrategyRoboquant RP Profits NY Open Retest Strategy A good strategy for CL

Tristan's Tri-band StrategyTristan's Tri-band Strategy - Confluence Trading System
Strategy Overview:
This strategy combines three powerful technical indicators - RSI, Williams %R, and Bollinger Bands - into a single visual trading system. Instead of cluttering your chart with separate indicator panels, all signals are displayed directly on the price chart using color-coded gradient overlays, making it easy to spot high-probability trade setups at a glance.
How It Works:
The strategy identifies trading opportunities when multiple indicators align (confluence), suggesting strong momentum shifts:
📈 Long Entry Signals:
RSI drops to 30 or below (oversold)
Williams %R reaches -80 to -100 range (oversold)
Price touches or breaks below the lower Bollinger Band
All three conditions must align during your selected trading session
📉 Short Entry Signals:
RSI rises to 70 or above (overbought)
Williams %R reaches 0 to -20 range (overbought)
Price touches or breaks above the upper Bollinger Band
All three conditions must align during your selected trading session
Visual Indicators:
(faint) Green gradients below candles = Bullish oversold conditions (buying opportunity)
(faint) Red/Orange gradients above candles = Bearish overbought conditions (selling opportunity)
Stacked/brighter gradients = Multiple indicators confirming the same signal (higher probability) will stack and show brighter / less faint
Blue Bollinger Bands = Volatility boundaries and mean reversion zones
Exit Strategy:
Long trades exit when price reaches the upper Bollinger Band OR RSI becomes overbought (≥70)
Short trades exit when price reaches the lower Bollinger Band OR RSI becomes oversold (≤30)
Key Features:
✅ Session Filters - Trade only during NY (9:30 AM-4 PM), London (3 AM-11:30 AM), or Asia (7 PM-1 AM EST) sessions
✅ No Repainting - Signals are confirmed on candle close for realistic backtesting and live trading
✅ Customizable Parameters - Adjust RSI levels, BB standard deviations, Williams %R periods, and gradient visibility
✅ Visual Clarity - See all three indicators at once without switching between panels
✅ Built-in Alerts - Get notified when entry and exit conditions are met
How to Use Effectively:
Choose Your Trading Session - For day trading US stocks, enable only the NY session. For forex or 24-hour markets, select the sessions that match your schedule.
Look for Gradient Stacking - The brightest, most visible gradients occur when both RSI and Williams %R signal together. These are your highest-probability setups.
Confirm with Price Action - Wait for the candle to close before entering. The strategy enters on the next bar's open to prevent repainting.
Respect the Bollinger Bands - Entries occur at the outer bands (price extremes), and exits occur at the opposite band or when momentum reverses.
Backtest First - Test the strategy on your preferred instruments and timeframes. Works best on liquid assets with clear trends and mean reversion patterns (stocks, major forex pairs, indices).
Adjust Gradient Visibility - Use the "Gradient Strength" slider (lower = more visible) to make signals stand out on your chart style.
Best Timeframes: 5-minute to 1-hour charts for intraday trading; 4-hour to daily for swing trading (I have also found the 3 hour timeframe to work really well for some stocks / ETFs.)
Best Markets: Liquid instruments with volatility - SPY, QQQ, major stocks, EUR/USD, GBP/USD, major indices
Risk Management: This is a mean reversion strategy that works best in ranging or choppy markets. In strong trends, signals may appear less frequently. Always use proper position sizing and stop losses based on your risk tolerance.
----------------------------------------------
Note: Past performance does not guarantee future results. This strategy is provided for educational purposes. Always backtest thoroughly and practice proper risk management before live trading.RetryClaude can make mistakes. Please double-check responses. Sonnet 4.5

💸 DCA Accumulation Strategy (USD‑Based Scaling)Buy when blue arrow appears, if the next arrow is lower than the last increase your position. This will pull your average cost down slowly over time.

NY ORB - Full Dynamic SystemNY ORB - Full Dynamic Strategy Summary
1. Opening Range and Session Timing
Opening Range (ORB) Calculation: The strategy identifies the ORB High and ORB Low by tracking the highest high and lowest low during the specified New York pre-market window, which is set by default from 8:30 to 8:45 (New York time).
Entry Window: Trading activity is restricted to a specific entry period, typically starting shortly after the ORB is established (default: 8:50 to 12:00).
Hard Exit Time: Any remaining open positions are automatically closed at a fixed exit time (default: 13:25).
2. Trade Entry Logic and Filters
An entry (Long or Short) is generated when the price breaks out of the established ORB, provided it passes a series of optional filters:
Direction Control: The user can restrict the strategy to trade Long Only, Short Only, or Both.
Second Breakout Logic: An optional filter that requires the price to break out, reverse back into the range, and then break out again, confirming momentum after a consolidation.
Confirmation Candle Count: An optional filter that checks the close of a previous candle (e.g., 1 or 2 candles ago) to ensure the price was still inside the range, preventing premature entry.
Technical Filters (Optional): The entry is only executed if it aligns with selected indicators:
RSI: Filters for non-overbought (Long) or non-oversold (Short) conditions.
MACD: Requires the MACD line to be above/below the Signal line for alignment.
VWAP: Requires the price to be above/below the Volume-Weighted Average Price.
Trend Filter (SMMA): Requires the price to be above/below a 50-period Simple Moving Average.
3. Dynamic Risk and Exit Management
This strategy features highly configurable stop-loss and profit-taking mechanics:
Primary Stop Loss Methods: The Stop Loss distance can be dynamically chosen from four types:
Fixed: A fixed number of ticks.
ATR: Based on a multiple of the Average True Range (ATR).
Capped ATR: ATR-based, but with a hard maximum tick limit.
OR-Based: Based on a multiple of the actual ORB High-to-Low range.
Dynamic Profit Target: The Take Profit level is calculated dynamically based on a multiplier of either the ATR or the ORB Range.
Breakeven Stop:
If enabled, the Stop Loss automatically moves to the entry price (Breakeven) once the price moves a predetermined distance in the profitable direction.
An Adaptive Breakeven option allows the trigger distance to be calculated as a percentage of the overall ATR Profit Target.
Trailing Stop: The strategy uses a trailing stop, which can be custom-set (fixed ticks) or dynamically tied to the ATR. An optional feature Auto Tighten Trailing reduces the trailing multiplier once the breakeven level is hit.
MA Cross Exit: An alternative, counter-trend exit mechanism that closes the trade if the price crosses back over the chosen Moving Average (either SMMA or VWAP), overriding the pending profit target.
4. Daily Account Management
The strategy includes crucial daily risk controls to protect capital and lock in profits:
Daily Profit Limit: If the total daily PnL (realized and unrealized) hits a predefined maximum profit threshold (in ticks), all trades are closed, and new entries are blocked for the remainder of the trading day.
Daily Loss Limit: Conversely, if the total daily PnL hits a predefined maximum loss threshold, all trades are closed, and new entries are blocked for the remainder of the day.

BB Pullback Strategy - Persistent Fractal TrendIn Uptrend, when price pullback and reach the lower band, expect it to bounce, thus enter buy at lower band.
In Downtrend, when price pullback and reach the upper band, expect it to bounce, thus enter sell at upper band.
Uptrend and Downtrend is decided by using William Fractal (3 bars) HH, HL, LH, LL

《การติดตามแนวโน้ม》อ่านหนังสือการติดตามแนวโน้มแล้วชอบมาก ตัวชี้วัดที่สร้างขึ้นตามเนื้อหาในหนังสือ รวมถึง: การเทรดตามแนวโน้ม, ทำทั้งฝั่งซื้อและขาย, การเพิ่มพอร์ต และการควบคุมความเสี่ยง
t.me
《Trend Following》
I really enjoyed reading the book Trend Following. The indicators created based on the book's content include: momentum trading, going long and short, pyramiding, and risk control.

NY VIX Channel Trend US Futures Day Trade StrategyNY VIX Channel Trend Strategy
Summary in one paragraph
Session anchored intraday strategy for index futures such as ES and NQ on one to fifteen minute charts. It acts only after the first configurable window of New York Regular Trading Hours and uses a VIX derived daily implied move to form a realistic channel from the session open. Originality comes from using a pure implied volatility yardstick as portable support and resistance, then committing in the direction of the first window close relative to the open. Add it to a clean chart and trade the simple visuals. For conservative alerts use on bar close.
Scope and intent
• Markets. Index futures ES and NQ
• Timeframes. One to thirty minutes
• Default demo. ES1 on five minutes
• Purpose. Provide a portable intraday yardstick for entries and exits without curve fitting
• Limits. This is a strategy. Orders are simulated on standard candles
Originality and usefulness
• Unique concept. A VIX only channel anchored at 09:30 New York plus a single window trend test
• Addresses. False urgency at session open and unrealistic bands from arbitrary multipliers
• Testability. Every input is visible and the channel is plotted so users can audit behavior
• Portable yardstick. Daily implied move equals VIX percent divided by square root of two hundred fifty two
• Protected status. None. Method and use are fully disclosed
Method overview in plain language
Take the daily VIX or VIX9D value, convert it to a daily fraction by dividing by square root of two hundred fifty two, then anchor a symmetric channel at the New York session open. Observe the first N minutes. If that window closes above the open the bias is long. If it closes below the open the bias is short. One trade per session. Exits occur at the channel boundary or at a bracket based on a user selected VIX factor. Positions are closed a set number of minutes before the session ends.
Base measures
Return basis. The daily implied move unit equals VIX percent divided by square root of two hundred fifty two and serves as the distance unit for targets and stops.
Components
• VIX Channel. Top, mid, bottom lines anchored at 09:30 New York. No extra multipliers
• Window Trend. Close of the first N minutes relative to the session open sets direction
• Risk Bracket. Take profit and stop loss equal to VIX unit times user factor
• Session Window. Uses the exchange time of the chart
Fusion rule
Minimum gates count equals one. The trade only arms after the window has elapsed and a direction exists. One entry per session.
Signal rule
• Long when the window close is above the session open and the window has completed
• Short when the window close is below the session open and the window has completed
• Exit on channel touch. Long exits at the top. Short exits at the bottom
• Flat thirty minutes before the session close or at the user setting
Inputs with guidance
Setup
• Use VIX9D. Width source. Typical true for fast tone or false for baseline
• Use daily OPEN. Toggle for sensitivity to overnight changes
Logic
• Window minutes. Five to one hundred twenty. Larger values delay entries and reduce whipsaw
• VIX factor for TP. Zero point five to two. Raising it widens the profit target
• VIX factor for SL. Zero point five to two. Raising it widens the stop
• Exit minutes before close. Fifteen to ninety. Raising it exits earlier
Properties visible in this publication
• Initial capital one hundred thousand USD
• Base currency USD
• request.security uses lookahead off
• Commission cash per contract two point five $ per each contract. Slippage one tick
• Default order size method FIXED with value one contract. Pyramiding zero. Process orders on close ON. Bar magnifier OFF. Recalculate after order is filled OFF. Calc on every tick ON
Realism and responsible publication
No performance claims. Past results never guarantee future outcomes. Fills and slippage vary by venue. Shapes can move while a bar forms and settle on close. Strategy uses standard candles.
Honest limitations and failure modes
Economic releases and thin liquidity can break the channel. Very quiet regimes can reduce signal contrast. Session windows follow the exchange time of the chart. If both stop and target can be hit within one bar, assume stop first for conservative reading without bar magnifier.
Works best in liquid hours of New York RTH. Very large gaps and surprise news may exceed the implied channel. Always validate on the symbols you trade.
Entries and exits
• Entry logic. After the first window, go long if the window close is above the session open, go short if below
• Exit logic. Long exits at the channel top or at the take profit or stop. Short exits at the channel bottom or at the take profit or stop. Flat before session close by the configured minutes
• Risk model. Initial stop and target based on the VIX unit times user factors. No trail and no break even. No cooldown
• Tie handling. Treat as stop first for conservative interpretation
Position sizing
Fixed size one contract per trade. Target risk per trade should generally remain near one percent of account equity. Risk is based on the daily volatility value, the max loss from the tests for one year duration with 5min chart was 4%, while the avg loss was below <1% of the total capital.
If you have any questions please let me know. Thank you for coming by !

Buy&Hold Profitcalculator in EuroTitle: Buy & Hold Strategy in Euro
Description:
This Pine Script implements a simple yet flexible Buy & Hold strategy denominated in Euros, suitable for a wide range of assets including cryptocurrencies, forex pairs, and stocks.
Key Features:
Custom Investment Amount: Define your invested capital in Euros.
Flexible Start & End Dates: Specify exact entry and exit dates for the strategy.
Automatic Currency Conversion: Supports assets priced in USD or USDT, converting the invested capital to chart currency using the EUR/USD exchange rate.
Single Entry and Exit: Executes a one-time Buy & Hold position based on the defined timeframe.
Profit and Performance Tracking: Calculates total profit/loss in Euros and percentage returns.
Smart Exit Label: Displays a dynamic label at the exit showing final position value, net profit/loss, and return percentage. The label automatically adjusts its position above or below the price bar for optimal visibility.
Visual Enhancements:
Position value and profit/loss plotted on the chart.
Background color highlights the active investment period.
Buy and Sell markers clearly indicate entry and exit points.
This strategy is ideal for traders and investors looking to simulate long-term positions and evaluate performance in Euro terms, even when trading USD-denominated assets.
Usage Notes:
Best used on daily charts for medium- to long-term analysis.
Adjust start and end dates, as well as invested capital, to simulate different scenarios.
Works with any asset, but currency conversion is optimized for USD or USDT-pegged instruments.

Trend Entry_0 [TS_Indie]Trend Entry_0 — Mechanism Overview
The core structure of this strategy is based on a price action reversal pattern, as detailed below:
In the case of a Bullish Trend Reversal:
The price initially moves in a bearish direction. When candle A forms a low lower than the previous low, the high of candle A becomes a key reference point.
If the next candle closes above the high of candle A , it confirms a Bullish Trend Reversal.
* Upon a Bullish signal, a Long position is opened at the opening price of the next candle (candle B).
* When a subsequent Bearish signal occurs, the Long position is closed at the opening price of the next candle (candle C).
In the case of a Bearish Trend Reversal:
The price initially moves in a bullish direction. When candle A forms a high higher than the previous high, the low of candle A becomes a key reference point.
If the next candle closes below the low of candle A , it confirms a Bearish Trend Reversal.
* Upon a Bearish signal, a Short position is opened at the opening price of the next candle (candle B).
* When a subsequent Bullish signal occurs, the Short position is closed at the opening price of the next candle (candle C).
Options
* The start and end dates of the backtest can be customized.
* The swing lines of the trend can be displayed as an optional visual aid.
* The user can choose whether to open only Long or Short positions.
Backtest Results and Observations
Based on the backtesting results of this strategy across various assets and timeframes, it has been observed that this approach works best on trending assets such as Gold, BTC, and stocks.
It also performs well on higher timeframes, starting from the Daily timeframe and above, especially when taking Long positions only.
However, when applied to currency pairs such as EUR/USD, the results tend to be less impressive.
I encourage everyone to try backtesting and further developing this strategy — adding new conditions or filters may potentially lead to improved performance.
Disclaimer
This script is intended solely for backtesting purposes, based on a particular price action pattern.
It does not constitute financial or investment advice.
Backtest results do not guarantee future performance.

FVG + CoSD Confirmation Strategy (6:1 RR, 2% Equity Risk)This strategy combines two powerful displacement signals — Fair Value Gaps (FVG) and Change of State of Delivery (CoSD) — to capture high-conviction directional moves. It sets a directional bias when either signal appears, but only enters a trade once both FVG and CoSD confirm in the same direction. This dual-filter approach helps reduce noise and improve entry precision.
Key features:
✅ Bias lock on first signal: Directional bias is set by either FVG or CoSD, but trades only trigger when both align.
✅ 6:1 reward-to-risk targeting: Take profit is set at sixtimes the stop distance, allowing for high-RR setups.
✅ Fixed stop buffer: SL is calculated using a static tick buffer for simplicity and consistency.
✅ Exit on opposing signal: Trades are closed when an opposite FVG or CoSD appears, signaling structural reversal.
📈 Optimized for EURUSD on the 4-hour timeframe, where its structural logic and risk parameters are best aligned with market rhythm and volatility.
This strategy is ideal for traders who want to combine price imbalance with structural confirmation, while maintaining disciplined risk management and directional clarity.

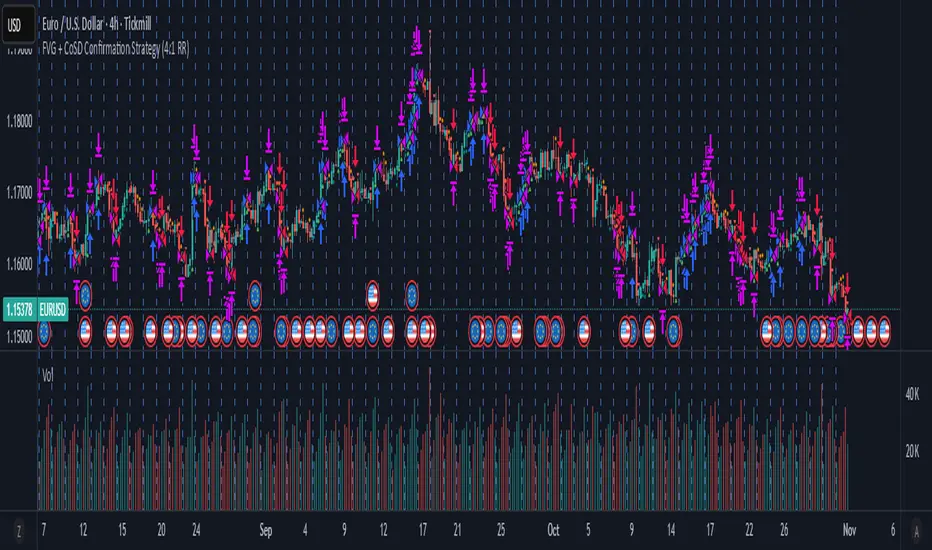
FVG + CoSD Confirmation Strategy (4:1 RR)This strategy combines two powerful displacement signals — Fair Value Gaps (FVG) and Change of State of Delivery (CoSD) — to capture high-conviction directional moves. It sets a directional bias when either signal appears but only enters a trade once both FVG and CoSD confirm in the same direction. This dual-filter approach helps reduce noise and improve entry precision.
Key features:
✅ Bias lock on first signal: Directional bias is set by either FVG or CoSD, but trades only trigger when both align.
✅ 4:1 reward-to-risk targeting: Take profit is set at four times the stop distance, allowing for high-RR setups.
✅ Fixed stop buffer: SL is calculated using a static tick buffer for simplicity and consistency.
✅ Exit on opposing signal: Trades are closed when an opposite FVG or CoSD appears, signaling structural reversal.
📈 Optimized for EURUSD on the 4-hour timeframe, where its structural logic and risk parameters are best aligned with market rhythm and volatility.
This strategy is ideal for traders who want to combine price imbalance with structural confirmation, while maintaining disciplined risk management and directional clarity.
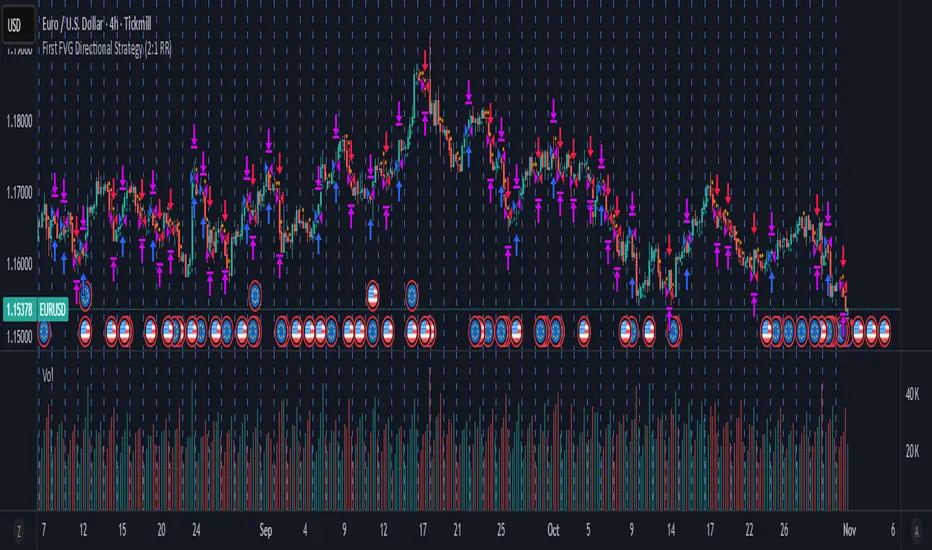
First FVG Directional Strategy (2:1 RR)This strategy captures directional momentum by trading the first confirmed Fair Value Gap (FVG) and holding that bias until an opposing FVG appears. It’s designed to align with ICT-style displacement logic, entering only when a clear imbalance is confirmed and exiting when the market structure shifts.
Key features:
✅ Directional bias lock: Trades only in the direction of the first FVG. No re-entries until reversal.
✅ FVG confirmation: Requires directional candle confirmation for valid gaps.
✅ 2:1 reward-to-risk targeting: Take profit is set at twice the distance of the stop loss.
✅ Clean, structure-driven logic: No indicators or overlays — just price action and delivery.
📈 Optimized for EURUSD on the 4-hour chart, where its structural logic and risk parameters are best aligned.
This strategy is ideal for traders seeking clarity, discipline, and directional conviction based on price imbalance and displacement.
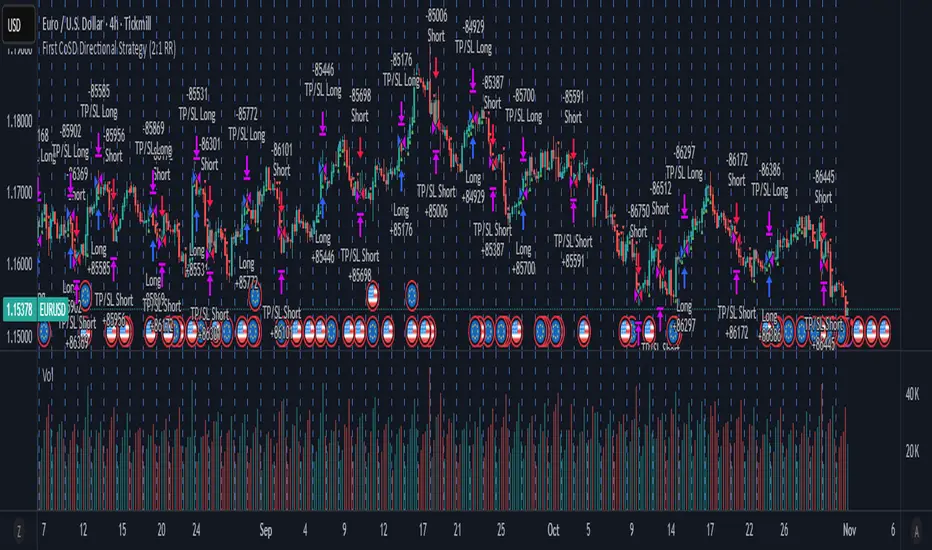
First CoSD Directional Strategy (4:1 RR)This strategy is optimized for the four hour EURUSD. It captures directional momentum by trading the first confirmed Change of State of Delivery (CoSD) — a structural break above the most recent swing high (bullish) or below the most recent swing low (bearish). Once a CoSD is detected, the strategy enters in that direction and holds the position until an opposing CoSD occurs.
Key features:
✅ Directional bias lock: Only one trade per directional shift. No re-entries until reversal.
✅ Swing-based stop loss: SL is anchored to the most recent structural level — swing low for longs, swing high for shorts.
✅ 4:1 reward-to-risk targeting: TP is calculated as four times the distance between entry and SL.
✅ Clean displacement logic: No indicators, no noise — just price structure and delivery.
This strategy is ideal for traders who want to align with market structure and displacement without overtrading. It’s built for clarity, discipline, and directional conviction.
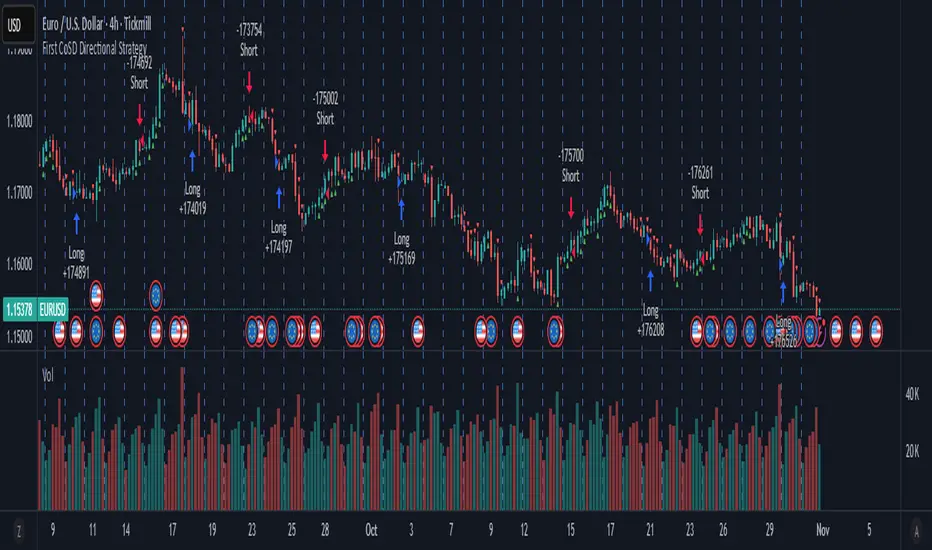
First CoSD Directional StrategyThis strategy is optimized for EURUSD on the 4-hour timeframe.
This strategy captures directional momentum by trading the first confirmed Change of State of Delivery (CoSD) — a structural break above the most recent swing high (bullish) or below the most recent swing low (bearish). Once a CoSD is detected, the strategy enters in that direction and holds the position until an opposing CoSD occurs.
Key features:
✅ Directional bias lock: Only one trade per directional shift. No re-entries until reversal.
✅ Swing-based stop loss: SL is anchored to the most recent structural level — swing low for longs, swing high for shorts.
✅ 2:1 reward-to-risk targeting: TP is calculated as twice the distance between entry and SL.
✅ Clean displacement logic: No indicators, no noise — just price structure and delivery.
This strategy is ideal for traders who want to align with market structure and displacement without overtrading. It’s built for clarity, discipline, and directional conviction.
v2.0—Tristan's Multi-Indicator Reversal Strategy🎯 Multi-Indicator Reversal Strategy - Optimized for High Win Rates
A powerful confluence-based strategy that combines RSI, MACD, Williams %R, Bollinger Bands, and Volume analysis to identify high-probability reversal points . Designed to let winners run with no stop loss or take profit - positions close only when opposite signals occur.
Also, the 3 hour timeframe works VERY well—just a lot less trades.
📈 Proven Performance
This strategy has been backtested and optimized on multiple blue-chip stocks with 80-90%+ win rates on 1-hour timeframes from Aug 2025 through Oct 2025:
✅ V (Visa) - Payment processor
✅ MSFT (Microsoft) - Large-cap tech
✅ WMT (Walmart) - Retail leader
✅ IWM (Russell 2000 ETF) - Small-cap index
✅ NOW (ServiceNow) - Enterprise software
✅ WM (Waste Management) - Industrial services
These stocks tend to mean-revert at extremes, making them ideal candidates for this reversal-based approach. I only list these as a way to show you the performance of the script. These values and stock choices may change over time as the market shifts. Keep testing!
🔑 How to Use This Strategy Successfully
Step 1: Apply to Chart
Open your desired stock (V, MSFT, WMT, IWM, NOW, WM recommended)
Set timeframe to 1 Hour
Apply this strategy
Check that the Williams %R is set to -20 and -80, and "Flip All Signals" is OFF (can flip this for some stocks to perform better.)
Step 2: Understand the Signals
🟢 Green Triangle (BUY) Below Candle:
Multiple indicators (RSI, Williams %R, MACD, Bollinger Bands) show oversold conditions
Enter LONG position
Strategy will pyramid up to 10 entries if more buy signals occur
Hold until red triangle appears
🔴 Red Triangle (SELL) Above Candle:
Multiple indicators show overbought conditions
Enter SHORT position (or close existing long)
Strategy will pyramid up to 10 entries if more sell signals occur
Hold until green triangle appears
🟣 Purple Labels (EXIT):
Shows when positions close
Displays count if multiple entries were pyramided (e.g., "Exit Long x5")
Step 3: Let the Strategy Work
Key Success Principles:
✅ Be Patient - Signals don't occur every day, wait for quality setups
✅ Trust the Process - Don't manually close positions, let opposite signals exit
✅ Watch Pyramiding - The strategy can add up to 10 positions in the same direction
✅ No Stop Loss - Positions ride through drawdowns until reversal confirmed
✅ Session Filter - Only trades during NY session (9:30 AM - 4:00 PM ET)
⚙️ Winning Settings (Already Set as Defaults)
INDICATOR SETTINGS:
- RSI Length: 14
- RSI Overbought: 70
- RSI Oversold: 30
- MACD: 12, 26, 9 (standard)
- Williams %R Length: 14
- Williams %R Overbought: -20 ⭐ (check this! And adjust to your liking)
- Williams %R Oversold: -80 ⭐ (check this! And adjust to your liking)
- Bollinger Bands: 20, 2.0
- Volume MA: 20 periods
- Volume Multiplier: 1.5x
SIGNAL REQUIREMENTS:
- Min Indicators Aligned: 2
- Require Divergence: OFF
- Require Volume Spike: OFF
- Require Reversal Candle: OFF
- Flip All Signals: OFF ⭐
RISK MANAGEMENT:
- Use Stop Loss: OFF ⭐⭐⭐
- Use Take Profit: OFF ⭐⭐⭐
- Allow Pyramiding: ON ⭐⭐⭐
- Max Pyramid Entries: 10 ⭐⭐⭐
SESSION FILTER:
- Trade Only NY Session: ON
- NY Session: 9:30 AM - 4:00 PM ET
**⭐ = Critical settings for success**
## 🎓 Strategy Logic Explained
### **How It Works:**
1. **Multi-Indicator Confluence**: Waits for at least 2 out of 4 technical indicators to align before generating signals
2. **Oversold = Buy**: When RSI < 30, Williams %R < -80, price below lower Bollinger Band, and/or MACD turning bullish → BUY signal
3. **Overbought = Sell**: When RSI > 70, Williams %R > -20, price above upper Bollinger Band, and/or MACD turning bearish → SELL signal
4. **Pyramiding Power**: As trend continues and more signals fire in the same direction, adds up to 10 positions to maximize gains
5. **Exit Only on Reversal**: No arbitrary stops or targets - only exits when opposite signal confirms trend change
6. **Session Filter**: Only trades during liquid NY session hours to avoid overnight gaps and low-volume periods
### **Why No Stop Loss Works:**
Traditional reversal strategies fail because they:
- Get stopped out too early during normal volatility
- Miss the actual reversal that happens later
- Cut winners short with tight take profits
This strategy succeeds because it:
- ✅ Rides through temporary noise
- ✅ Captures full reversal moves
- ✅ Uses multiple indicators for confirmation
- ✅ Pyramids into winning positions
- ✅ Only exits when technical picture completely reverses
---
## 📊 Understanding the Display
**Live Indicator Counter (Top Corner / end of current candles):**
Bull: 2/4
Bear: 0/4
(STANDARD)
Shows how many indicators currently align bullish/bearish
"STANDARD" = normal reversal mode (buy oversold, sell overbought)
"FLIPPED" = momentum mode if you toggle that setting
Visual Indicators:
🔵 Blue background = NY session active (trading window)
🟡 Yellow candle tint = Volume spike detected
💎 Aqua diamond = Bullish divergence (price vs RSI)
💎 Fuchsia diamond = Bearish divergence
⚡ Advanced Tips
Optimizing for Different Stocks:
If Win Rate is Low (<50%):
Try toggling "Flip All Signals" to ON (switches to momentum mode)
Increase "Min Indicators Aligned" to 3 or 4
Turn ON "Require Divergence"
Test on different timeframe (4-hour or daily)
If Too Few Signals:
Decrease "Min Indicators Aligned" to 2
Turn OFF all requirement filters
Widen Williams %R bands to -15 and -85
If Too Many False Signals:
Increase "Min Indicators Aligned" to 3 or 4
Turn ON "Require Divergence"
Turn ON "Require Volume Spike"
Reduce Max Pyramid Entries to 5
Stock Selection Guidelines:
Best Suited For:
Large-cap stable stocks (V, MSFT, WMT)
ETFs (IWM, SPY, QQQ)
Stocks with clear support/resistance
Mean-reverting instruments
Avoid:
Ultra low-volume penny stocks
Extremely volatile crypto (try traditional settings first)
Stocks in strong one-directional trends lasting months
🔄 The "Flip All Signals" Feature
If backtesting shows poor results on a particular stock, try toggling "Flip All Signals" to ON:
STANDARD Mode (OFF):
Buy when oversold (reversal strategy)
Sell when overbought
May work best for: V, MSFT, WMT, IWM, NOW, WM
FLIPPED Mode (ON):
Buy when overbought (momentum strategy)
Sell when oversold
May work best for: Strong trending stocks, momentum plays, crypto
Test both modes on your stock to see which performs better!
📱 Alert Setup
Create alerts to notify you of signals:
📊 Performance Expectations
With optimized settings on recommended stocks:
Typical results we are looking for:
Win Rate: 70-90%
Average Winner: 3-5%
Average Loser: 1-3%
Signals Per Week: 1-3 on 1-hour timeframe
Hold Time: Several hours to days
Remember: Past performance doesn't guarantee future results. Always use proper risk management.
