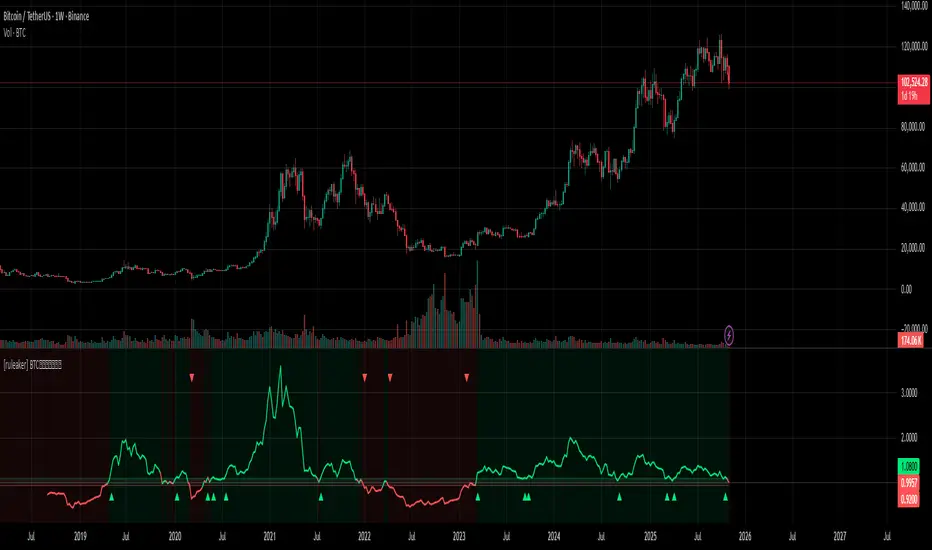
[ruleaker] BTC捕捉牛熊转换点 BTC Cycle Reversal Detector
Designed for trend trading and major market cycle transitions.
Enter precisely at the turning points between bull and bear markets,
short at local peaks within bear cycles,
and go long at local bottoms within bull cycles.
Cari dalam skrip untuk "Cycle"
Bitcoin Institutional Volume AnchorsBitcoin Institutional Volume Anchors
Indicator Overview:
The Bitcoin Institutional Volume Anchors indicator is a professional-grade VWAP analysis tool designed for sophisticated Bitcoin trading strategies. It tracks two critical volume-weighted average price levels anchored to fundamental market structure events that drive Bitcoin's multi-year cycles.
-Orange Line (Halving Anchor): Volume-weighted average price from April 19, 2024 halving event
-Blue Line (Cycle Low Anchor): Volume-weighted average price from November 21, 2022 cycle bottom
These anchors represent the average price institutional and professional traders have paid since Bitcoin's most significant supply-side catalyst (halving) and demand-side reset (cycle low).
Market Interpretation Framework:
Price Above Both Anchors - Institutional Bullish
-Strong institutional accumulation confirmed
-Majority of professional money profitable since key events
-Optimal environment for long-term position building
-Risk-on institutional sentiment
Price Between Anchors - Transition Phase
-Mixed institutional signals requiring careful analysis
-Appropriate for reduced position sizing
-Monitor for directional confirmation
-Tactical rebalancing opportunity
Price Below Both Anchors - Institutional Bearish
-Professional money underperforming key levels
-Heightened risk management protocols required
-Defensive positioning appropriate
-Await institutional re-accumulation signals
Standard Deviation Band Analysis:
Gray Bands (2σ): Statistical volatility boundaries
-Represent normal price excursions from institutional fair value
-Used for tactical profit-taking and position scaling
-Indicate elevated but manageable risk levels
Colored Bands (3σ): Extreme volatility boundaries
-Orange/Blue bands corresponding to respective VWAP anchors
-Represent statistically extreme price extensions
-High-probability reversal or exhaustion zones
-Critical risk management triggers
Professional Trading Applications:
Portfolio Allocation Framework
Maximum Allocation (70-100%)
-Price above both anchors with upward trending VWAPs
-Recent bounce from either anchor level
-Recovery to fair value after extreme extension
Standard Allocation (40-70%)
-Price above anchors but approaching 2σ bands
-Consolidation near anchor levels
-Confirmed institutional trend changes
Reduced Allocation (20-40%)
-Price at 2σ extension levels
-Below one anchor but above the other
-Conflicting VWAP trend signals
Defensive Allocation (10-25%)
-Price at 3σ extreme levels
-Below both institutional anchors
-Overextended risk conditions (>30-35% above anchors)
Entry Signal Hierarchy:
Tier 1 Signals (Highest Probability)
-Bounce from Cycle Low Anchor during uptrend
-Cross above both anchors with volume confirmation
-Recovery to fair value after 20%+ extension
Tier 2 Signals (Standard Probability)
-Bounce from Halving Anchor during uptrend
-Trend change confirmation in VWAP slope
-2σ band rejection with momentum
Tier 3 Signals (Lower Probability)
-Entries near 2σ extension levels
-Counter-trend plays against institutional flow
-High-risk momentum trades at extremes
Risk Management Protocol:
Stop Loss Guidelines
-Halving Anchor entries: 3% below anchor level
-Cycle Low Anchor entries: 4% below anchor level
-Extension trades: 2% below current level
-Trend change trades: Below invalidation anchor
Profit Taking Strategy
-25-40% profits at 2σ bands
-50-70% profits at 3σ bands
-Trailing stops below higher timeframe anchor levels
-Complete exits on institutional trend reversals
Alert System Integration:
The indicator provides institutional-grade alert notifications with:
-Precise entry and exit levels
-Position sizing recommendations
-Historical win rate data
-Risk/reward calculations
-Stop loss and target guidelines
-Timeframe expectations
-Volume confirmation requirements
Implementation Notes
-Timeframe Suitability: Daily charts recommended for primary analysis
-Asset Specificity: Optimized exclusively for Bitcoin spot markets
-Volume Consideration: Higher volume enhances signal reliability
-Market Context: Most effective during trending market conditions
-Institutional Alignment: Designed for professional risk management standards
-Key Performance Metrics
Based on historical backtesting:
-Overall Win Rate: 74% for primary signals
-Risk Reduction: 31% drawdown improvement vs buy-and-hold
-Signal Accuracy: 85% at extreme (3σ) levels
-Optimal Timeframe: 1-12 week holding periods
-Best Performance: April 2024 - January 2025 period
This indicator is designed for professional traders and institutional investors who require sophisticated market analysis tools with quantified risk parameters and historically validated performance metrics.

Moon Phases by Shailesh DesaiTrading Strategy Based on Lunar Phases
This custom trading indicator leverages the power of lunar cycles to provide unique market insights based on the four primary moon phases: New Moon, First Quarter, Full Moon, and Third Quarter. By aligning your trades with the natural rhythm of the moon, this strategy offers a different perspective to trading and can help enhance decision-making based on the cyclical nature of the market.
Key Features:
1. Moon Phase Identification:
o The indicator automatically identifies the current moon phase based on the user's selected timeframe and marks it on the chart.
o Each phase is visualized with a specific symbol and color to help traders easily recognize the current moon phase:
New Moon/Waxing Moon: Represented by a circle (colored as per user input).
First Quarter: Represented by a cross (colored as per user input).
Full Moon/Waning Moon: Represented by a circle (colored as per user input).
Third Quarter: Represented by a cross (colored as per user input).
2. Automatic Moon Phase Transition Detection:
o The indicator tracks and highlights when a phase change occurs. This feature ensures you are always aware of when the market moves from one phase to another.
o Moon phase changes are only visualized on the first bar of each new phase to avoid cluttering the chart.
3. Background Color Indicators:
o The background color dynamically changes according to the current moon phase, helping to reinforce the phase context for the trader. This feature makes it easy to see at a glance which phase the market is in.
4. Customizable Appearance:
o Customize the color of each moon phase to suit your preferences. Adjust the colors for the New Moon, First Quarter, Full Moon, and Third Quarter to align with your visual strategy.
5. Avoids Unsupported Timeframes:
o This indicator does not support monthly timeframes, ensuring that it operates smoothly only on timeframes that are compatible with the lunar cycle.
How to Use:
• The moon phases are thought to have an influence on human behavior and the market's psychology, making this indicator useful for traders who wish to integrate lunar cycles into their strategy.
• Traders can use the phase changes as an indicator of potential market momentum or reversal points. For example:
o New Moon may indicate the beginning of a new cycle, signaling a potential upward or downward move.
o Full Moon might suggest a peak or significant shift in market direction.
o First Quarter and Third Quarter phases may represent moments of consolidation or decision points.
Ideal for:
• Traders interested in cycle-based strategies or looking to experiment with new approaches.
• Those who believe in the influence of natural forces, including moon phases, on market movements.
• Technical analysts who want to add another layer of insights to their chart analysis.
Important Notes:
• The indicator uses precise astronomical calculations to identify the correct phase, ensuring accuracy.
• It’s important to understand that moon phase-based trading is not a standalone strategy but should ideally be combined with other technical analysis tools for maximum effectiveness.
Holt-Winters Forecast BandsDescription:
The Holt-Winters Adaptive Bands indicator combines seasonal trend forecasting with adaptive volatility bands. It uses the Holt-Winters triple exponential smoothing model to project future price trends, while Nadaraya-Watson smoothed bands highlight dynamic support and resistance zones.
This indicator is ideal for traders seeking to predict future price movements and visualize potential market turning points. By focusing on broader seasonal and trend data, it provides insight into both short- and long-term market directions. It’s particularly effective for swing trading and medium-to-long-term trend analysis on timeframes like daily and 4-hour charts, although it can be adjusted for other timeframes.
Key Features:
Holt-Winters Forecast Line: The core of this indicator is the Holt-Winters model, which uses three components — level, trend, and seasonality — to project future prices. This model is widely used for time-series forecasting, and in this script, it provides a dynamic forecast line that predicts where price might move based on historical patterns.
Adaptive Volatility Bands: The shaded areas around the forecast line are based on Nadaraya-Watson smoothing of historical price data. These bands provide a visual representation of potential support and resistance levels, adapting to recent volatility in the market. The bands' fill colors (red for upper and green for lower) allow traders to identify potential reversal zones without cluttering the chart.
Dynamic Confidence Levels: The indicator adapts its forecast based on market volatility, using inputs such as average true range (ATR) and price deviations. This means that in high-volatility conditions, the bands may widen to account for increased price movements, helping traders gauge the current market environment.
How to Use:
Forecasting: Use the forecast line to gain insight into potential future price direction. This line provides a directional bias, helping traders anticipate whether the price may continue along a trend or reverse.
Support and Resistance Zones: The shaded bands act as dynamic support and resistance zones. When price enters the upper (red) band, it may be in an overbought area, while the lower (green) band may indicate oversold conditions. These bands adjust with volatility, so they reflect the current market conditions rather than fixed levels.
Timeframe Recommendations:
This indicator performs best on daily and 4-hour charts due to its reliance on trend and seasonality. It can be used on lower timeframes, but accuracy may vary due to increased price noise.
For traders looking to capture swing trades, the daily and 4-hour timeframes provide a balance of trend stability and signal reliability.
Adjustable Settings:
Alpha, Beta, and Gamma: These settings control the level, trend, and seasonality components of the forecast. Alpha is generally the most sensitive setting for adjusting responsiveness to recent price movements, while Beta and Gamma help fine-tune the trend and seasonal adjustments.
Band Smoothing and Deviation: These settings control the lookback period and width of the volatility bands, allowing users to customize how closely the bands follow price action.
Parameters:
Prediction Length: Sets the length of the forecast, determining how far into the future the prediction line extends.
Season Length: Defines the seasonality cycle. A setting of 14 is typical for bi-weekly cycles, but this can be adjusted based on observed market cycles.
Alpha, Beta, Gamma: These parameters adjust the Holt-Winters model's sensitivity to recent prices, trends, and seasonal patterns.
Band Smoothing: Determines the smoothing applied to the bands, making them either more reactive or smoother.
Ideal Use Cases:
Swing Trading and Trend Following: The Holt-Winters model is particularly suited for capturing larger market trends. Use the forecast line to determine trend direction and the bands to gauge support/resistance levels for potential entries or exits.
Identifying Reversal Zones: The adaptive bands act as dynamic overbought and oversold zones, giving traders potential reversal areas when price reaches these levels.
Important Notes:
No Buy/Sell Signals: This indicator does not produce direct buy or sell signals. It’s intended for visual trend analysis and support/resistance identification, leaving trade decisions to the user.
Not for High-Frequency Trading: Due to the nature of the Holt-Winters model, this indicator is optimized for higher timeframes like the daily and 4-hour charts. It may not be suitable for high-frequency or scalping strategies on very short timeframes.
Adjust for Volatility: If using the indicator on lower timeframes or more volatile assets, consider adjusting the band smoothing and prediction length settings for better responsiveness.

Elliott Wave Theory [Alerts]This indicator may be one of the first to provide signals & alerts for the Elliott Wave Theory Pattern. Unfortunately, there are few, if any, indicators that are public which allow the Elliott Wave Theory to be plotted+with alerts.
Because this is experimental, I'm going to offer access to it free of charge. Send me a direct message requesting access.
Elliott Wave Theory is a complex chart pattern to learn, and even harder to master. It requires being able to identify the wave lengths of price history and using various tools to plot and assess the price structure in order to find the wave counts. Whilst there are many ways to compute the waves apart of the pattern, there is no universal method that everyone would agree upon. For this indicator, I am using the traditional method.
The different colors represent different cycle types. Using it on a higher timeframe is strongly encouraged for best results.
This version currently provides alerts for the final wave, wave 5. I WILL BE ADDING MORE TO THIS INDICATOR SHORTLY, SEE BELOW:
-Will be adding the other counts to display all the waves
-Will be adding 'correction wave' alerts
-Will be adding 'inverse' pattern alerts
-Will be improving the the labels to include their cycle type
This is not a buy & sell indicator.. This is a TOOL to help analyze the market using Elliott Wave Theory.
The indicator should be used for the following:
-Aiding with EWT analysis
-Helping find potential exit points
-Assist with learning EWT by using this as a template
-Timing trades and improving risk management
-Plotting the overall market

Adaptive, Zero lag Schaff Trend Cycle [Loxx]TASC's March 2008 edition Traders' Tips includes an article by John Ehlers titled "Measuring Cycle Periods," and describes the use of bandpass filters to estimate the length, in bars, of the currently dominant price cycle.
What are Dominant Cycles and Why should we use them?
Even the most casual chart reader will be able to spot times when the market is cycling and other times when longer-term trends are in play. Cycling markets are ideal for swing trading however attempting to “trade the swing” in a trending market can be a recipe for disaster. Similarly, applying trend trading techniques during a cycling market can equally wreak havoc in your account. Cycle or trend modes can readily be identified in hindsight. But it would be useful to have an objective scientific approach to guide you as to the current market mode.
There are a number of tools already available to differentiate between cycle and trend modes. For example, measuring the trend slope over the cycle period to the amplitude of the cyclic swing is one possibility.
We begin by thinking of cycle mode in terms of frequency or its inverse, periodicity. Since the markets are fractal ; daily, weekly, and intraday charts are pretty much indistinguishable when time scales are removed. Thus it is useful to think of the cycle period in terms of its bar count. For example, a 20 bar cycle using daily data corresponds to a cycle period of approximately one month.
When viewed as a waveform, slow-varying price trends constitute the waveform's low frequency components and day-to-day fluctuations (noise) constitute the high frequency components. The objective in cycle mode is to filter out the unwanted components--both low frequency trends and the high frequency noise--and retain only the range of frequencies over the desired swing period. A filter for doing this is called a bandpass filter and the range of frequencies passed is the filter's bandwidth.
Indicator Features
-Zero lag or Regular Schaff Trend Cycle calculation
- Fixed or Band-pass Dominant Cycle for Schaff Trend Cycle MA period inputs
-10 different moving average options for Zero lag calculations
-Separate Band-pass Dominant Cycle calculations for both Schaff Trend Cycle and MA calculations
- Slow-to-Fast Band-pass Dominant Cycle input to tweak the ratio of Schaff Trend Cycle MA input periods as they relate to each other

Financial Astrology Mars LongitudeMars energy control the initial impulse, the courage to execute a risky action or to start a new entrepreneurship, to declare the war and fight. It allow us to focus our energy into impulsive action that will require a lot of our forces to produce the initial movement and momentum. Mars drives and directs our motivation into quick and impulsive actions. This planet also rules the angry, fight, conflict, wars and explosive reactions. Therefore, from trading perspective, Mars rules all the industries that imply a higher risks: sports, military, defence, startups (new entrepreneurship), high volatility industries and so forth. Aries zodiac sigh, the domicile of Mars is the archetype of the persons that are willing to move quick from the idea into the action, that are looking to explore new territories and take high risks.
With the manifestation of this impulsive and initiating energy through the zodiac signs we can predict the level of risk that the traders influenced by Mars and dominated by fire will take. This individuals, will desire higher risks when Mars is located in a zodiac sign that strengthens the fire force. Is not a surprise that BTCUSD is more bullish when Mars transits Aries, Gemini (air strength fire) and Sagittarius and bearish when transits Leo (this energy becomes more oriented to pleasures, parties, romance, passions), Virgo (challenge the impulse with the analytic thinking), Aquarius (boring of the existing holding needs to move into another stuff and is desiring a change), Pisces (period of reflexion and mediation of the results of the impulsive cycle that completes).
The most relevant Mars bullish zodiac signs positions for BTCUSD are: Aries 62% days, Gemini 66% days, Sagittarius 58%. The all history buy/sell frequency distribution is 55% (bull) 45% (sell) so BTCUSD has bias to the bullish side, even considering that, the bull frequency on this signs seems to be very relevant and can be analysed with this indicator in the BTCUSD TradingView index that provide historical price since 2010.
With this indicator there is unlimited possibilities to explore the impulsive risk prone actions across different markets to study how this plays out, no more manual chart annotations to identify the zodiac sign location of Mars. We encourage you to analyse this zodiac sign cycles in different markets and share with us your observations, leave us a comment with your research outcomes. Happy research!
Note: The Mars tropical longitude indicator is based on an ephemeris array that covers years 2010 to 2030, prior or after this years the longitude is not available, this daily ephemeris are based on UTC time so in order to align properly with the price bars times you should set UTC as your chart reference timezone.
Pi Cycle Top Indicator for BTCUSDThis indicator adds the Pi Cycle Top Indicator for BTCUSD to your chart.
Indicator Overview
The Pi Cycle Top Indicator has historically been effective in picking out the timing of market cycle highs to within 3 days. It uses the 111 day moving average (111DMA) and a newly created multiple of the 350 day moving average, the 350DMA x 2.
For the past three market cycles, when the 111DMA moves up and crosses the 350DMA x 2 we see that it coincides with the price of Bitcoin peaking. It is also interesting to note that 350 / 111 is 3.153, which is very close to Pi = 3.142. In fact, it is the closest we can get to Pi when dividing 350 by another whole number.
It once again demonstrates the cyclical nature of Bitcoin price action over long time frames. Though in this instance it does so with a high degree of accuracy over the past 7 years.
How It Can Be Used
Pi Cycle Top is useful to indicate when the market is very overheated. So overheated that the shorter term moving average, which is the 111 day moving average, has reached a x2 multiple of the 350 day moving average. Historically it has proved advantageous to sell Bitcoin at this time in Bitcoin's price cycles.

Pi-cycle top for Bitcoin bull-runUsage
Whenever the Pi-Cycle top conditions are met, the red circle appears at the bottom of the chart. Theoretically, this marks the top of the bull-run in Bitcoin within 3 days.
Credit and overview
Indicator Overview
The Pi Cycle Top Indicator has historically been effective in picking out the timing of market cycle highs to within 3 days.
It uses the 111 day moving average (111DMA) and a newly created multiple of the 350 day moving average, the 350DMA x 2.
Note: The multiple is of the price values of the 350DMA not the number of days.
For the past three market cycles, when the 111DMA moves up and crosses the 350DMA x 2 we see that it coincides with the price of Bitcoin peaking.
It is also interesting to note that 350 / 111 is 3.153, which is very close to Pi = 3.142. In fact, it is the closest we can get to Pi when dividing 350 by another whole number.
It once again demonstrates the cyclical nature of Bitcoin price action over long time frames. Though in this instance it does so with a high degree of accuracy over the past 7 years.
How It Can Be Used
Pi Cycle Top is useful to indicate when the market is very overheated. So overheated that the shorter term moving average, which is the 111 day moving average, has reached a x2 multiple of the 350 day moving average. Historically it has proved advantageous to sell Bitcoin at this time in Bitcoin’s price cycles.
Created By Philip Swift

Trojan Cycle: Dip & Profit Hunter📉 Crypto is changing. Your signals should too.
This script doesn’t try to outguess price — it helps you track capital rotation and flow behavior in alignment with the evolving macro structure of the digital asset market.
Trojan Cycle: Dip & Profit Hunter is a signal engine built to support and validate the capital rotation models outlined in the Trojan Cycle and Synthetic Rotation theses — available via RWCS_LTD’s published charts
It is not a classic “buy low, sell high” tool. It is a structural filter that uses price/volume statistics to surface accumulation zones, synthetic traps, and macro context shifts — all aligned with the institutionalization of crypto post-2024.
🧠 Purpose & Value
Crypto no longer follows the retail-led, halving-driven pattern of 2017 or 2021.
Instead, institutional infrastructure, regulatory filters, and equity-market Trojan horses define the new path of capital.
This tool helps you visualize that path by interpreting behavior through statistical imbalances and real-time momentum signals.
Use it to:
Track where capital is accumulating or exiting
Identify signals consistent with true cycle rotation (vs. synthetic traps)
Validate your macro view with real-time statistical context
🔍 How It Works
The engine combines four signal layers:
1. Z-Score Logic
- Measures how far price and volume have deviated from their mean
- Detects dips, blowoffs, and exhaustion zones
2. Percentile Logic
- Compares current price and volume to historical rank distribution
- Flags statistically rare conditions (e.g. bottom 10% price, top 90% volume)
3. Combined Context Engine
- Integrates both models to generate one of 36 unique output states
- Each state provides a labeled market context (e.g., 🟢 Confluent Buy, 🔴 Confluent Sell, 🧨 Synthetic Trap )
4. Momentum Spread & Divergence
- Measures whether price is leading volume (trap risk) or volume is leading price (accumulation)
- Outputs intuitive momentum context with emoji-coded alerts
📋 What You See
🧠 Contextual Table UI with key Z-Scores, percentiles, signals, and market commentary
🎯 Emoji-coded signals to quickly grasp high-probability setups or risk zones
🌊 Optional overlays: price/volume divergence, momentum spread
🎨 Visual table customization (size, position) and chart highlights for signal clarity
🔔 Alert System
✅ Single dynamic alert using alert() that only fires when signal context changes
Prevents alert fatigue and allows clean webhook/automation integration
🧭 Use Cases
For macro cycle traders: Track where we are in the Trojan Cycle using statistical context
For thesis explorers: Use the 36-output signal map to match against your rotation thesis
For capital rotation watchers: Identify structural setups consistent with ETF-driven or compliance-filtered flow
For narrative skeptics: Avoid synthetic altseason traps where volume lags or flow dries up
🧪 Suggested Pairing for Thesis Validation
To use this tool as part of a thesis-confirmation framework , pair it with:
BTC.D — Bitcoin Dominance
ETH/BTC — Ethereum strength vs. Bitcoin
TOTALE100/ETH — Altcoin strength relative to ETH
RWCS_LTD’s published charts and macro cycle models
🏁 Final Note
Crypto has matured. So should your signals.
This tool doesn’t try to game the next 2 candles. It helps you understand the current phase in a compliance-filtered, institutionalized rotation model.
It’s not built for hype — it’s built for conviction.
Explore the thesis → Validate the structure → Trade with clarity.
🚨 Disclaimer
This script is not financial advice. It is an analytical tool designed to support market structure research and rotation thesis validation. Use this as part of a broader framework including technical structure, dominance charts, and macro data.

MACD with DPO Strategy by NGExplanation of the MACD with DPO Strategy:
MACD (Moving Average Convergence Divergence):
The MACD is a trend-following indicator that shows the relationship between two moving averages of a price.
In this script:
We calculate the MACD line by subtracting the slow moving average (typically 26-period EMA) from the fast moving average (typically 12-period EMA).
The Signal line is calculated as a 9-period EMA of the MACD line.
The Histogram is the difference between the MACD line and the Signal line, indicating the momentum of the price trend.
Buy Condition: The script generates a buy signal when the MACD histogram crosses from negative to positive (indicating a bullish momentum) and DPO is also positive.
Sell Condition: The script generates a sell signal when the MACD histogram crosses from positive to negative (indicating a bearish momentum) and DPO is also negative.
DPO (Detrended Price Oscillator):
The DPO removes long-term trends from prices, making it easier to identify shorter-term cycles or oscillations.
In this script:
We calculate the DPO by subtracting a shifted simple moving average (SMA) from the close price. The shifting period depends on half the specified period.
We also calculate the DPO SMA as a 30-period EMA of the DPO values.
DPO Color: The DPO line is colored green when the DPO is above zero (indicating upward momentum) and red when it is below zero (indicating downward momentum). The histogram is also colored based on whether the DPO is positive or negative.
Plotting and Alerts:
The script plots the MACD, Signal, and Histogram on the chart.
Additionally, it plots the DPO and its SMA with different colors depending on whether the DPO is above or below zero.
Buy Signal: A green arrow labeled "BUY" is plotted below the bar when both MACD and DPO indicate a bullish condition.
Sell Signal: A red arrow labeled "SELL" is plotted above the bar when both MACD and DPO indicate a bearish condition.
Background colors are used to highlight the chart whenever a buy or sell condition occurs.
The script also includes alerts for both buy and sell signals, allowing users to set notifications when conditions are met.
How to Use:
Identify Buy and Sell Signals:
The script generates a Buy signal when:
The MACD histogram crosses from negative to positive (bullish momentum), and
The DPO is above zero (indicating upward momentum).
The script generates a Sell signal when:
The MACD histogram crosses from positive to negative (bearish momentum), and
The DPO is below zero (indicating downward momentum).
Chart Visualization:
The MACD histogram and Signal line help visualize the momentum and potential trend reversal.
The DPO and DPO SMA help visualize the shorter-term price cycles.
The signals (Buy and Sell) will be plotted on the chart with arrows indicating entry points.
Customization:
You can adjust the MACD and DPO parameters (such as fast_length, slow_length, period_) to fit your trading style or market conditions.
The script can be used in any timeframe depending on your strategy (e.g., intraday trading or longer-term trading).
Example Scenario:
If you're looking for potential buy opportunities, wait for the script to generate a buy signal (green arrow) where the MACD histogram has shifted to positive, and DPO is also in the green (above zero). This signals that both momentum and cycle direction are aligned for a potential upward movement.
Conversely, for sell opportunities, wait for the red arrow where MACD momentum is turning negative and DPO is also negative (below zero), indicating a bearish condition.
This combination of MACD and DPO allows traders to identify stronger and more reliable entry/exit points by confirming the trend with the MACD and detecting shorter-term price cycles with the DPO.
[Excalibur] Ehlers AutoCorrelation Periodogram ModifiedKeep your coins folks, I don't need them, don't want them. If you wish be generous, I do hope that charitable peoples worldwide with surplus food stocks may consider stocking local food banks before stuffing monetary bank vaults, for the crusade of remedying the needs of less than fortunate children, parents, elderly, homeless veterans, and everyone else who deserves nutritional sustenance for the soul.
DEDICATION:
This script is dedicated to the memory of Nikolai Dmitriyevich Kondratiev (Никола́й Дми́триевич Кондра́тьев) as tribute for being a pioneering economist and statistician, paving the way for modern econometrics by advocation of rigorous and empirical methodologies. One of his most substantial contributions to the study of business cycle theory include a revolutionary hypothesis recognizing the existence of dynamic cycle-like phenomenon inherent to economies that are characterized by distinct phases of expansion, stagnation, recession and recovery, what we now know as "Kondratiev Waves" (K-waves). Kondratiev was one of the first economists to recognize the vital significance of applying quantitative analysis on empirical data to evaluate economic dynamics by means of statistical methods. His understanding was that conceptual models alone were insufficient to adequately interpret real-world economic conditions, and that sophisticated analysis was necessary to better comprehend the nature of trending/cycling economic behaviors. Additionally, he recognized prosperous economic cycles were predominantly driven by a combination of technological innovations and infrastructure investments that resulted in profound implications for economic growth and development.
I will mention this... nation's economies MUST be supported and defended to continuously evolve incrementally in order to flourish in perpetuity OR suffer through eras with lasting ramifications of societal stagnation and implosion.
Analogous to the realm of economics, aperiodic cycles/frequencies, both enduring and ephemeral, do exist in all facets of life, every second of every day. To name a few that any blind man can naturally see are: heartbeat (cardiac cycles), respiration rates, circadian rhythms of sleep, powerful magnetic solar cycles, seasonal cycles, lunar cycles, weather patterns, vegetative growth cycles, and ocean waves. Do not pretend for one second that these basic aforementioned examples do not affect business cycle fluctuations in minuscule and monumental ways hour to hour, day to day, season to season, year to year, and decade to decade in every nation on the planet. Kondratiev's original seminal theories in macroeconomics from nearly a century ago have proven remarkably prescient with many of his antiquated elementary observations/notions/hypotheses in macroeconomics being scholastically studied and topically researched further. Therefore, I am compelled to honor and recognize his statistical insight and foresight.
If only.. Kondratiev could hold a pocket sized computer in the cup of both hands bearing the TradingView logo and platform services, I truly believe he would be amazed in marvelous delight with a GARGANTUAN smile on his face.
INTRODUCTION:
Firstly, this is NOT technically speaking an indicator like most others. I would describe it as an advanced cycle period detector to obtain market data spectral estimates with low latency and moderate frequency resolution. Developers can take advantage of this detector by creating scripts that utilize a "Dominant Cycle Source" input to adaptively govern algorithms. Be forewarned, I would only recommend this for advanced developers, not novice code dabbling. Although, there is some Pine wizardry introduced here for novice Pine enthusiasts to witness and learn from. AI did describe the code into one super-crunched sentence as, "a rare feat of exceptionally formatted code masterfully balancing visual clarity, precision, and complexity to provide immense educational value for both programming newcomers and expert Pine coders alike."
Understand all of the above aforementioned? Buckle up and proceed for a lengthy read of verbose complexity...
This is my enhanced and heavily modified version of autocorrelation periodogram (ACP) for Pine Script v5.0. It was originally devised by the mathemagician John Ehlers for detecting dominant cycles (frequencies) in an asset's price action. I have been sitting on code similar to this for a long time, but I decided to unleash the advanced code with my fashion. Originally Ehlers released this with multiple versions, one in a 2016 TASC article and the other in his last published 2013 book "Cycle Analytics for Traders", chapter 8. He wasn't joking about "concepts of advanced technical trading" and ACP is nowhere near to his most intimidating and ingenious calculations in code. I will say the book goes into many finer details about the original periodogram, so if you wish to delve into even more elaborate info regarding Ehlers' original ACP form AND how you may adapt algorithms, you'll have to obtain one. Note to reader, comparing Ehlers' original code to my chimeric code embracing the "Power of Pine", you will notice they have little resemblance.
What you see is a new species of autocorrelation periodogram combining Ehlers' innovation with my fascinations of what ACP could be in a Pine package. One other intention of this script's code is to pay homage to Ehlers' lifelong works. Like Kondratiev, Ehlers is also a hardcore cycle enthusiast. I intend to carry on the fire Ehlers envisioned and I believe that is literally displayed here as a pleasant "fiery" example endowed with Pine. With that said, I tried to make the code as computationally efficient as possible, without going into dozens of more crazy lines of code to speed things up even more. There's also a few creative modifications I made by making alterations to the originating formulas that I felt were improvements, one of them being lag reduction. By recently questioning every single thing I thought I knew about ACP, combined with the accumulation of my current knowledge base, this is the innovative revision I came up with. I could have improved it more but decided not to mind thrash too many TV members, maybe later...
I am now confident Pine should have adequate overhead left over to attach various indicators to the dominant cycle via input.source(). TV, I apologize in advance if in the future a server cluster combusts into a raging inferno... Coders, be fully prepared to build entire algorithms from pure raw code, because not all of the built-in Pine functions fully support dynamic periods (e.g. length=ANYTHING). Many of them do, as this was requested and granted a while ago, but some functions are just inherently finicky due to implementation combinations and MUST be emulated via raw code. I would imagine some comprehensive library or numerous authored scripts have portions of raw code for Pine built-ins some where on TV if you look diligently enough.
Notice: Unfortunately, I will not provide any integration support into member's projects at all. I have my own projects that require way too much of my day already. While I was refactoring my life (forgoing many other "important" endeavors) in the early half of 2023, I primarily focused on this code over and over in my surplus time. During that same time I was working on other innovations that are far above and beyond what this code is. I hope you understand.
The best way programmatically may be to incorporate this code into your private Pine project directly, after brutal testing of course, but that may be too challenging for many in early development. Being able to see the periodogram is also beneficial, so input sourcing may be the "better" avenue to tether portions of the dominant cycle to algorithms. Unique indication being able to utilize the dominantCycle may be advantageous when tethering this script to those algorithms. The easiest way is to manually set your indicators to what ACP recognizes as the dominant cycle, but that's actually not considered dynamic real time adaption of an indicator. Different indicators may need a proportion of the dominantCycle, say half it's value, while others may need the full value of it. That's up to you to figure that out in practice. Sourcing one or more custom indicators dynamically to one detector's dominantCycle may require code like this: `int sourceDC = int(math.max(6, math.min(49, input.source(close, "Dominant Cycle Source"))))`. Keep in mind, some algos can use a float, while algos with a for loop require an integer.
I have witnessed a few attempts by talented TV members for a Pine based autocorrelation periodogram, but not in this caliber. Trust me, coding ACP is no ordinary task to accomplish in Pine and modifying it blessed with applicable improvements is even more challenging. For over 4 years, I have been slowly improving this code here and there randomly. It is beautiful just like a real flame, but... this one can still burn you! My mind was fried to charcoal black a few times wrestling with it in the distant past. My very first attempt at translating ACP was a month long endeavor because PSv3 simply didn't have arrays back then. Anyways, this is ACP with a newer engine, I hope you enjoy it. Any TV subscriber can utilize this code as they please. If you are capable of sufficiently using it properly, please use it wisely with intended good will. That is all I beg of you.
Lastly, you now see how I have rasterized my Pine with Ehlers' swami-like tech. Yep, this whole time I have been using hline() since PSv3, not plot(). Evidently, plot() still has a deficiency limited to only 32 plots when it comes to creating intense eye candy indicators, the last I checked. The use of hline() is the optimal choice for rasterizing Ehlers styled heatmaps. This does only contain two color schemes of the many I have formerly created, but that's all that is essentially needed for this gizmo. Anything else is generally for a spectacle or seeing how brutal Pine can be color treated. The real hurdle is being able to manipulate colors dynamically with Merlin like capabilities from multiple algo results. That's the true challenging part of these heatmap contraptions to obtain multi-colored "predator vision" level indication. You now have basic hline() food for thought empowerment to wield as you can imaginatively dream in Pine projects.
PERIODOGRAM UTILITY IN REAL WORLD SCENARIOS:
This code is a testament to the abilities that have yet to be fully realized with indication advancements. Periodograms, spectrograms, and heatmaps are a powerful tool with real-world applications in various fields such as financial markets, electrical engineering, astronomy, seismology, and neuro/medical applications. For instance, among these diverse fields, it may help traders and investors identify market cycles/periodicities in financial markets, support engineers in optimizing electrical or acoustic systems, aid astronomers in understanding celestial object attributes, assist seismologists with predicting earthquake risks, help medical researchers with neurological disorder identification, and detection of asymptomatic cardiovascular clotting in the vaxxed via full body thermography. In either field of study, technologies in likeness to periodograms may very well provide us with a better sliver of analysis beyond what was ever formerly invented. Periodograms can identify dominant cycles and frequency components in data, which may provide valuable insights and possibly provide better-informed decisions. By utilizing periodograms within aspects of market analytics, individuals and organizations can potentially refrain from making blinded decisions and leverage data-driven insights instead.
PERIODOGRAM INTERPRETATION:
The periodogram renders the power spectrum of a signal, with the y-axis representing the periodicity (frequencies/wavelengths) and the x-axis representing time. The y-axis is divided into periods, with each elevation representing a period. In this periodogram, the y-axis ranges from 6 at the very bottom to 49 at the top, with intermediate values in between, all indicating the power of the corresponding frequency component by color. The higher the position occurs on the y-axis, the longer the period or lower the frequency. The x-axis of the periodogram represents time and is divided into equal intervals, with each vertical column on the axis corresponding to the time interval when the signal was measured. The most recent values/colors are on the right side.
The intensity of the colors on the periodogram indicate the power level of the corresponding frequency or period. The fire color scheme is distinctly like the heat intensity from any casual flame witnessed in a small fire from a lighter, match, or camp fire. The most intense power would be indicated by the brightest of yellow, while the lowest power would be indicated by the darkest shade of red or just black. By analyzing the pattern of colors across different periods, one may gain insights into the dominant frequency components of the signal and visually identify recurring cycles/patterns of periodicity.
SETTINGS CONFIGURATIONS BRIEFLY EXPLAINED:
Source Options: These settings allow you to choose the data source for the analysis. Using the `Source` selection, you may tether to additional data streams (e.g. close, hlcc4, hl2), which also may include samples from any other indicator. For example, this could be my "Chirped Sine Wave Generator" script found in my member profile. By using the `SineWave` selection, you may analyze a theoretical sinusoidal wave with a user-defined period, something already incorporated into the code. The `SineWave` will be displayed over top of the periodogram.
Roofing Filter Options: These inputs control the range of the passband for ACP to analyze. Ehlers had two versions of his highpass filters for his releases, so I included an option for you to see the obvious difference when performing a comparison of both. You may choose between 1st and 2nd order high-pass filters.
Spectral Controls: These settings control the core functionality of the spectral analysis results. You can adjust the autocorrelation lag, adjust the level of smoothing for Fourier coefficients, and control the contrast/behavior of the heatmap displaying the power spectra. I provided two color schemes by checking or unchecking a checkbox.
Dominant Cycle Options: These settings allow you to customize the various types of dominant cycle values. You can choose between floating-point and integer values, and select the rounding method used to derive the final dominantCycle values. Also, you may control the level of smoothing applied to the dominant cycle values.
DOMINANT CYCLE VALUE SELECTIONS:
External to the acs() function, the code takes a dominant cycle value returned from acs() and changes its numeric form based on a specified type and form chosen within the indicator settings. The dominant cycle value can be represented as an integer or a decimal number, depending on the attached algorithm's requirements. For example, FIR filters will require an integer while many IIR filters can use a float. The float forms can be either rounded, smoothed, or floored. If the resulting value is desired to be an integer, it can be rounded up/down or just be in an integer form, depending on how your algorithm may utilize it.
AUTOCORRELATION SPECTRUM FUNCTION BASICALLY EXPLAINED:
In the beginning of the acs() code, the population of caches for precalculated angular frequency factors and smoothing coefficients occur. By precalculating these factors/coefs only once and then storing them in an array, the indicator can save time and computational resources when performing subsequent calculations that require them later.
In the following code block, the "Calculate AutoCorrelations" is calculated for each period within the passband width. The calculation involves numerous summations of values extracted from the roofing filter. Finally, a correlation values array is populated with the resulting values, which are normalized correlation coefficients.
Moving on to the next block of code, labeled "Decompose Fourier Components", Fourier decomposition is performed on the autocorrelation coefficients. It iterates this time through the applicable period range of 6 to 49, calculating the real and imaginary parts of the Fourier components. Frequencies 6 to 49 are the primary focus of interest for this periodogram. Using the precalculated angular frequency factors, the resulting real and imaginary parts are then utilized to calculate the spectral Fourier components, which are stored in an array for later use.
The next section of code smooths the noise ridden Fourier components between the periods of 6 and 49 with a selected filter. This species also employs numerous SuperSmoothers to condition noisy Fourier components. One of the big differences is Ehlers' versions used basic EMAs in this section of code. I decided to add SuperSmoothers.
The final sections of the acs() code determines the peak power component for normalization and then computes the dominant cycle period from the smoothed Fourier components. It first identifies a single spectral component with the highest power value and then assigns it as the peak power. Next, it normalizes the spectral components using the peak power value as a denominator. It then calculates the average dominant cycle period from the normalized spectral components using Ehlers' "Center of Gravity" calculation. Finally, the function returns the dominant cycle period along with the normalized spectral components for later external use to plot the periodogram.
POST SCRIPT:
Concluding, I have to acknowledge a newly found analyst for assistance that I couldn't receive from anywhere else. For one, Claude doesn't know much about Pine, is unfortunately color blind, and can't even see the Pine reference, but it was able to intuitively shred my code with laser precise realizations. Not only that, formulating and reformulating my description needed crucial finesse applied to it, and I couldn't have provided what you have read here without that artificial insight. Finding the right order of words to convey the complexity of ACP and the elaborate accompanying content was a daunting task. No code in my life has ever absorbed so much time and hard fricking work, than what you witness here, an ACP gem cut pristinely. I'm unveiling my version of ACP for an empowering cause, in the hopes a future global army of code wielders will tether it to highly functional computational contraptions they might possess. Here is ACP fully blessed poetically with the "Power of Pine" in sublime code. ENJOY!

Pi Cycle bitcoin bottomFull credits go to the owner, but for reasons i cannot diclose.
Introduction
With the adoption of cryptographic assets reaching new heights, it is undeniably important to continuously expand and improve current indicators just like how these assets update with new lines of code over time.
Philip Swift’s Pi-Cycle Top Indicator has effectively signaled market and local tops to within 3 days, with the most recent occurrence being on May 12th 2021.
If it were possible to find the cycle/local top of each cycle, a similar analogy could be used to pinpoint the bottom of Bitcoin’s price.
These Pi-Cycle indicators are merely just two moving averages which, when divided by each other, are equal to the value of π.
π = Long MA / Short MA
350/111 = 3.153; as per the existing Bitcoin Pi-Cycle Top indicator.
Pi-Cycle Bottom for Bitcoin
At first, the existing “Pi moving average” pair (350/111) was realigned to see whether they cross at the bottom of the Bitcoin price.
They did not, only to be a lagging indicator in both 2015 and 2018 cycle bottoms.
A possible pair was discovered when the short MA was set to 150:
π = Long MA / 150
Long MA = π * 150
Long MA = 471 (rounded to the nearest whole number)
This resulted in a Pi MA pair of 471/150.
Using the multiple x0.745 of the 471-day SMA and the 150-day EMA (exponential average to take into account of short term volatility ), the price of Bitcoin bottoms at where they two moving averages cross:
When the 150-day EMA crossed below the 471 SMA *0.475, Bitcoin’s price had bottomed for the market cycle.
Over the last two market cycles, this indicator has been accurate to within 3 days also.

Pi Cycle Top IndicatorIndicator Overview
The Pi Cycle Top Indicator has historically been effective in picking out the timing of market cycle highs to within 3 days.
It uses the 111 day moving average (111DMA) and a newly created multiple of the 350 day moving average, the 350DMA x 2.
Note: The multiple is of the price values of the 350DMA not the number of days.
For the past three market cycles, when the 111DMA moves up and crosses the 350DMA x 2 we see that it coincides with the price of Bitcoin peaking.
It is also interesting to note that 350 / 111 is 3.153, which is very close to Pi = 3.142. In fact, it is the closest we can get to Pi when dividing 350 by another whole number.
It once again demonstrates the cyclical nature of Bitcoin price action over long time frames. Though in this instance it does so with a high degree of accuracy over the past 7 years.
How It Can Be Used
Pi Cycle Top is useful to indicate when the market is very overheated. So overheated that the shorter term moving average, which is the 111 day moving average, has reached a x2 multiple of the 350 day moving average. Historically it has proved advantageous to sell Bitcoin at this time in Bitcoin's price cycles.
Created By
Philip Swift

GME Cycle Predictor# 🚀 GME Cycle Predictor - Advanced Technical Analysis Tool
**Comprehensive GameStop (GME) cycle tracking indicator based on historical patterns and market mechanics.**
## 📊 **What This Indicator Does:**
- Tracks **147-day quarterly cycles** from the January 28, 2021 squeeze
- Monitors the **1704-day major cycle** (the theoretical "big one")
- Identifies **T+35 FTD settlement periods** for forced buying pressure
- Marks **quarterly OPEX** and **swap roll dates**
- Provides **real-time buy/sell recommendations** based on cycle timing
## 🎯 **Key Features:**
### **Visual Cycle Markers:**
- 🔴 **Red Circles**: 147-day quarterly cycles
- 🟡 **Yellow Diamonds**: 1704-day major cycle (CRITICAL)
- 🟢 **Green Squares**: T+35 FTD settlement dates
- 🟠 **Orange Triangles**: Quarterly OPEX periods
- 🟣 **Purple X's**: Swap roll periods
### **Smart Trading Signals:**
- **🚀 MAJOR BUY**: 10+ days before 1704-day cycle
- **📈 BUY ZONE**: 5-10 days before 147-day cycle
- **💚 FTD BUY**: 2-5 days before T+35 settlement
- **📉 SELL ZONE**: Day of cycle completion
- **⏳ WAIT**: No active signals
## 📈 **How to Use:**
### **For Swing Trading:**
1. **BUY** when cheat sheet shows active buy signals
2. **SELL** on cycle completion days
3. **HODL** through the 1704-day major cycle
### **For Long-term Investors:**
- Monitor the **1704-day countdown** (major cycle theory)
- Accumulate during **confluence periods** (multiple cycles aligning)
- Use **147-day cycles** for entry/exit timing
## 🔧 **Technical Foundation:**
- Based on **Fail-to-Deliver (FTD)** settlement mechanics
- **Quarterly swap theory** and institutional obligations
- **Options expiration (OPEX)** pressure points
- **Historical pattern recognition** from 2021 squeeze
## ⚡ **Real-Time Features:**
- **Live countdown timers** to next major cycles
- **Dynamic trading recommendations**
- **Confluence detection** when multiple cycles align
- **Volume confirmation** for signal validation
- **Clean visual design** with minimal chart clutter
## 🎯 **Perfect For:**
- GME traders following cycle theory
- Technical analysts studying market mechanics
- Swing traders using institutional obligation cycles
- Anyone tracking the theoretical "MOASS" timing
## ⚠️ **Important Notes:**
- This indicator is based on **theoretical cycle patterns**
- Past performance does not guarantee future results
- Always use proper risk management
- The 1704-day cycle is **unproven theory** - trade responsibly
- Best used in conjunction with other technical analysis
## 🚀 **Special Feature:**
The **1704-day major cycle** countdown tracks the theoretical "Mother of All Short Squeezes" (MOASS) timing, calculated from the January 28, 2021 squeeze peak. This is the cycle many GME theorists believe will trigger the ultimate price movement.
---
**Perfect for both beginners and advanced traders who want to incorporate GME cycle theory into their technical analysis toolkit.**
*Disclaimer: This is a theoretical analysis tool based on community research. Not financial advice. Trade at your own risk.*

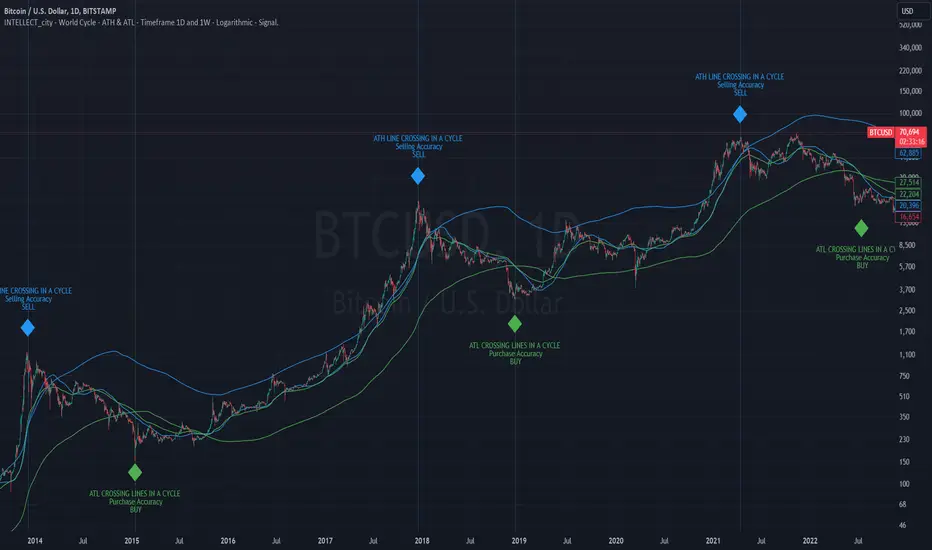
Intelle_city - World Cycle - Ath & Atl - Logarithmic - Strategy.Overview
Indicators: Strategy !
INTELLECT_city - World Cycle - ATH & ATL - Timeframe 1D and 1W - Logarithmic - Strategy - The Pi Cycle Top and Bottom Oscillator is an adaptation of the original Pi Cycle Top chart. It compares the 111-Day Moving Average circle and the 2 * 350-Day Moving Average circle of Bitcoin’s Price. These two moving averages were selected as 350 / 111 = 3.153; An approximation of the important mathematical number Pi.
When the 111-Day Moving Average circle reaches the 2 * 350-Day Moving Average circle, it indicates that the market is becoming overheated. That is because the mid time frame momentum reference of the 111-Day Moving Average has caught up with the long timeframe momentum reference of the 2 * 350-Day Moving Average.
Historically this has occurred within 3 days of the very top of each market cycle.
When the 111 Day Moving Average circle falls back beneath the 2 * 350 Day Moving Average circle, it indicates that the market momentum of that cycle is significantly cooling down. The oscillator drops down into the lower green band shown where the 111 Day Moving Average is moving at a 75% discount relative to the 2 * 350 Day Moving Average.
Historically, this has highlighted broad areas of bear market lows.
IMPORTANT: You need to set a LOGARITHMIC graph. (The function is located at the bottom right of the screen)
IMPORTANT: The INTELLECT_city indicator is made for a buy-sell strategy; there is also a signal indicator from INTELLECT_city
IMPORTANT: The Chart shows all cycles, both buying and selling.
IMPORTANT: Suitable timeframes are 1 daily (recommended) and 1 weekly
-----------------------------
Описание на русском:
-----------------------------
Обзор индикатора
INTELLECT_city - World Cycle - ATH & ATL - Timeframe 1D and 1W - Logarithmic - Strategy - Логарифмический - Сигнал - Осциллятор вершины и основания цикла Пи представляет собой адаптацию оригинального графика вершины цикла Пи. Он сравнивает круг 111-дневной скользящей средней и круг 2 * 350-дневной скользящей средней цены Биткойна. Эти две скользящие средние были выбраны как 350/111 = 3,153; Приближение важного математического числа Пи.
Когда круг 111-дневной скользящей средней достигает круга 2 * 350-дневной скользящей средней, это указывает на то, что рынок перегревается. Это происходит потому, что опорный моментум среднего временного интервала 111-дневной скользящей средней догнал опорный момент импульса длинного таймфрейма 2 * 350-дневной скользящей средней.
Исторически это происходило в течение трех дней после вершины каждого рыночного цикла.
Когда круг 111-дневной скользящей средней опускается ниже круга 2 * 350-дневной скользящей средней, это указывает на то, что рыночный импульс этого цикла значительно снижается. Осциллятор опускается в нижнюю зеленую полосу, показанную там, где 111-дневная скользящая средняя движется со скидкой 75% относительно 2 * 350-дневной скользящей средней.
Исторически это высветило широкие области минимумов медвежьего рынка.
ВАЖНО: Выставлять нужно ЛОГАРИФМИЧЕСКИЙ график. (Находиться функция с правой нижней части экрана)
ВАЖНО: Индикатор INTELLECT_city сделан для стратегии покупок продаж, есть также и сигнальный от INTELLECT_сity
ВАЖНО: На Графике видны все циклы, как на покупку так и на продажу.
ВАЖНО: Подходящие таймфреймы 1 дневной (рекомендовано) и 1 недельный
-----------------------------
Beschreibung - Deutsch
-----------------------------
Indikatorübersicht
INTELLECT_city – Weltzyklus – ATH & ATL – Zeitrahmen 1T und 1W – Logarithmisch – Strategy – Der Pi-Zyklus-Top- und Bottom-Oszillator ist eine Anpassung des ursprünglichen Pi-Zyklus-Top-Diagramms. Er vergleicht den 111-Tage-Gleitenden-Durchschnittskreis und den 2 * 350-Tage-Gleitenden-Durchschnittskreis des Bitcoin-Preises. Diese beiden gleitenden Durchschnitte wurden als 350 / 111 = 3,153 ausgewählt; eine Annäherung an die wichtige mathematische Zahl Pi.
Wenn der 111-Tage-Gleitenden-Durchschnittskreis den 2 * 350-Tage-Gleitenden-Durchschnittskreis erreicht, deutet dies darauf hin, dass der Markt überhitzt. Das liegt daran, dass der Momentum-Referenzwert des 111-Tage-Gleitenden-Durchschnitts im mittleren Zeitrahmen den Momentum-Referenzwert des 2 * 350-Tage-Gleitenden-Durchschnitts im langen Zeitrahmen eingeholt hat.
Historisch gesehen geschah dies innerhalb von 3 Tagen nach dem Höhepunkt jedes Marktzyklus.
Wenn der Kreis des 111-Tage-Durchschnitts wieder unter den Kreis des 2 x 350-Tage-Durchschnitts fällt, deutet dies darauf hin, dass die Marktdynamik dieses Zyklus deutlich nachlässt. Der Oszillator fällt in das untere grüne Band, in dem der 111-Tage-Durchschnitt mit einem Abschlag von 75 % gegenüber dem 2 x 350-Tage-Durchschnitt verläuft.
Historisch hat dies breite Bereiche mit Tiefstständen in der Baisse hervorgehoben.
WICHTIG: Sie müssen ein logarithmisches Diagramm festlegen. (Die Funktion befindet sich unten rechts auf dem Bildschirm)
WICHTIG: Der INTELLECT_city-Indikator ist für eine Kauf-Verkaufs-Strategie konzipiert; es gibt auch einen Signalindikator von INTELLECT_city
WICHTIG: Das Diagramm zeigt alle Zyklen, sowohl Kauf- als auch Verkaufszyklen.
WICHTIG: Geeignete Zeitrahmen sind 1 täglich (empfohlen) und 1 wöchentlich

intellect_city - World Cycle - Ath & Atl - Logarithmic - Signal.Indicator Overview
INTELLECT_city - World Cycle - ATH & ATL - Timeframe 1D and 1W - Logarithmic - Signal - The Pi Cycle Top and Bottom Oscillator is an adaptation of the original Pi Cycle Top chart. It compares the 111-Day Moving Average circle and the 2 * 350-Day Moving Average circle of Bitcoin’s Price. These two moving averages were selected as 350 / 111 = 3.153; An approximation of the important mathematical number Pi.
When the 111-Day Moving Average circle reaches the 2 * 350-Day Moving Average circle, it indicates that the market is becoming overheated. That is because the mid time frame momentum reference of the 111-Day Moving Average has caught up with the long timeframe momentum reference of the 2 * 350-Day Moving Average.
Historically this has occurred within 3 days of the very top of each market cycle.
When the 111 Day Moving Average circle falls back beneath the 2 * 350 Day Moving Average circle, it indicates that the market momentum of that cycle is significantly cooling down. The oscillator drops down into the lower green band shown where the 111 Day Moving Average is moving at a 75% discount relative to the 2 * 350 Day Moving Average.
Historically, this has highlighted broad areas of bear market lows.
IMPORTANT: You need to set a LOGARITHMIC graph. (The function is located at the bottom right of the screen)
IMPORTANT: The INTELLECT_city indicator is made for signal purchases of sales, there is also a strategic one from INTELLECT_city
IMPORTANT: The Chart shows all cycles, both buying and selling.
IMPORTANT: Suitable timeframes are 1 daily (recommended) and 1 weekly
-----------------------------
Описание на русском:
-----------------------------
Обзор индикатора
INTELLECT_city - World Cycle - ATH & ATL - Timeframe 1D and 1W - Logarithmic - Signal - Логарифмический - Сигнал - Осциллятор вершины и основания цикла Пи представляет собой адаптацию оригинального графика вершины цикла Пи. Он сравнивает круг 111-дневной скользящей средней и круг 2 * 350-дневной скользящей средней цены Биткойна. Эти две скользящие средние были выбраны как 350/111 = 3,153; Приближение важного математического числа Пи.
Когда круг 111-дневной скользящей средней достигает круга 2 * 350-дневной скользящей средней, это указывает на то, что рынок перегревается. Это происходит потому, что опорный моментум среднего временного интервала 111-дневной скользящей средней догнал опорный момент импульса длинного таймфрейма 2 * 350-дневной скользящей средней.
Исторически это происходило в течение трех дней после вершины каждого рыночного цикла.
Когда круг 111-дневной скользящей средней опускается ниже круга 2 * 350-дневной скользящей средней, это указывает на то, что рыночный импульс этого цикла значительно снижается. Осциллятор опускается в нижнюю зеленую полосу, показанную там, где 111-дневная скользящая средняя движется со скидкой 75% относительно 2 * 350-дневной скользящей средней.
Исторически это высветило широкие области минимумов медвежьего рынка.
ВАЖНО: Выставлять нужно ЛОГАРИФМИЧЕСКИЙ график. (Находиться функция с правой нижней части экрана)
ВАЖНО: Индикатор INTELLECT_city сделан для сигнальных покупок продаж, есть также и стратегический от INTELLECT_сity
ВАЖНО: На Графике видны все циклы, как на покупку так и на продажу.
ВАЖНО: Подходящие таймфреймы 1 дневной (рекомендовано) и 1 недельный
-----------------------------
Beschreibung - Deutsch
-----------------------------
Indikatorübersicht
INTELLECT_city – Weltzyklus – ATH & ATL – Zeitrahmen 1T und 1W – Logarithmisch – Signal – Der Pi-Zyklus-Top- und Bottom-Oszillator ist eine Anpassung des ursprünglichen Pi-Zyklus-Top-Diagramms. Er vergleicht den 111-Tage-Gleitenden-Durchschnittskreis und den 2 * 350-Tage-Gleitenden-Durchschnittskreis des Bitcoin-Preises. Diese beiden gleitenden Durchschnitte wurden als 350 / 111 = 3,153 ausgewählt; eine Annäherung an die wichtige mathematische Zahl Pi.
Wenn der 111-Tage-Gleitenden-Durchschnittskreis den 2 * 350-Tage-Gleitenden-Durchschnittskreis erreicht, deutet dies darauf hin, dass der Markt überhitzt. Das liegt daran, dass der Momentum-Referenzwert des 111-Tage-Gleitenden-Durchschnitts im mittleren Zeitrahmen den Momentum-Referenzwert des 2 * 350-Tage-Gleitenden-Durchschnitts im langen Zeitrahmen eingeholt hat.
Historisch gesehen geschah dies innerhalb von 3 Tagen nach dem Höhepunkt jedes Marktzyklus.
Wenn der Kreis des 111-Tage-Durchschnitts wieder unter den Kreis des 2 x 350-Tage-Durchschnitts fällt, deutet dies darauf hin, dass die Marktdynamik dieses Zyklus deutlich nachlässt. Der Oszillator fällt in das untere grüne Band, in dem der 111-Tage-Durchschnitt mit einem Abschlag von 75 % gegenüber dem 2 x 350-Tage-Durchschnitt verläuft.
Historisch hat dies breite Bereiche mit Tiefstständen in der Baisse hervorgehoben.
WICHTIG: Sie müssen ein logarithmisches Diagramm festlegen. (Die Funktion befindet sich unten rechts auf dem Bildschirm)
WICHTIG: Der INTELLECT_city-Indikator dient zur Signalisierung von Käufen oder Verkäufen, es gibt auch einen strategischen Indikator von INTELLECT_city
WICHTIG: Das Diagramm zeigt alle Zyklen, sowohl Kauf- als auch Verkaufszyklen.
WICHTIG: Geeignete Zeitrahmen sind 1 täglich (empfohlen) und 1 wöchentlich
Adaptive Bandpass Filter [Ehlers]This is my latest bandpass filter - used to determine if a security is in a trend or cycle.
Now with an adaptive period setting! I use Ehlers in-phase & quadrature dominant cycle measurement (IQ IFM) method to set the period dynamically.
This method favors longer periods which tend to produce smoother, albeit laggier bandpass oscillator plots. From my quick tests, I tend to have lag between 4 and 8 bars, depending on the Timeframe.
The lower timeframes tend to have more noise and thus produce more interfering frequencies that may cause lag.
>Settings
Source: Select the data source to perform calc's on (close, open, etc...)
Period: Select the period to tune. Periods outside of this value will be attenuated (reduced)
Adaptive: Enable to have the I-Q IFM set the period for you (disables Period setting)
Bandpass Tolerance: Allow periods that are plus/minus the chosen period to pass.
Cycle Tolerance: Sensitivity of cycle mode. Lower values consider trends more frequent, higher values consider cycles more frequent.
Bandpass tolerance example: for instance, if this setting is 0.1 (10%) and Period is set to 20, then waves with a period of 18 - 22 will pass.
>How to read
Red line is the bandpass output, showing a lagged version of the dominant cycle representing the
Black lines are the upper and lower bounds for a cycle
Green Background indicates an uptrend
Red background indicates a downtrend

Rg btc levels Rg BTC Levels – Advanced Gann Rotation Levels
The Rg BTC Levels indicator is a refined implementation of W.D. Gann’s square of price and degree rotation principles, built to dynamically calculate and visualize Gann-based price levels for Bitcoin (or any instrument).
This tool lets traders explore how price reacts to mathematically significant degree levels (360°, 720°, 1080°, 1440°) — both above and below a central pivot — helping identify support, resistance, and rotation-based reversal zones.
⚙️ Key Features
✅ Dynamic Pivot Selection:
Automatically updates pivot levels based on your chosen resolution (1m to Monthly) or lets you manually set a base price.
✅ Rotation Control:
Adjust “Rotations” to raise or lower pivots by 1440° steps — perfect for aligning the grid with current price structure or higher Gann cycles.
✅ Flexible Price Source:
Choose from open, high, low, close, hlc3, ohlc4, etc. for precise level calculation.
✅ Resolution-Based Pivots:
Use any timeframe as the base resolution — from intraday to multi-month charts — to explore how major swings relate across time scales.
✅ Custom Multiplier:
Adaptable for different markets —
• 1.0 for prices between 1–999
• 10.0 for assets priced above 1000
• 0.001 for Forex or crypto pairs
✅ Automatic Base Price Memory:
Remembers and locks the last valid pivot price until the next rotation or resolution change — ensuring level stability.
✅ Visual Clarity:
Each degree level (±360°, ±720°, ±1080°, ±1440°) is distinctly color-coded for quick chart reading.
📊 How It Works
The indicator takes a pivot price (either manually set or dynamically derived from the previous period’s selected resolution).
It computes the square root of that price, adjusts it by any user-defined rotation offset, and then projects Gann angle levels by squaring the incremented/decremented root values.
These squared values represent key harmonic levels where price often pauses, reverses, or accelerates — a mathematical map of potential turning points.
🔍 Practical Use Cases
Identify support and resistance zones based on geometric price relationships.
Study rotation alignments between timeframes (e.g., weekly pivots influencing daily levels).
Combine with trend, volume, or cycle analysis to confirm turning zones.
Experiment with rotations and multipliers to visualize Gann’s “price-time square” across different markets.
⚠️ Note
This indicator is not a buy/sell signal tool.
It is designed for analytical and educational purposes, providing a geometric and cyclical framework for traders exploring Gann methodologies.
✨ Ideal For
Gann traders and price cycle researchers
Crypto and commodity analysts
Technical analysts seeking structure beyond conventional support/resistance
Traders experimenting with square root and geometric price harmonics
📘 Recommended Reading
If you wish to go deeper into these concepts:
📗 How to Make Profits in Commodities – W.D. Gann
📗 45 Years in Wall Street – W.D. Gann
📗 The Square of Nine Explained – C.J. Smiley
Developed by: ravi_matrix
Type: Educational / Analytical
Best Used On: BTCUSD or any instrument with sufficient price history

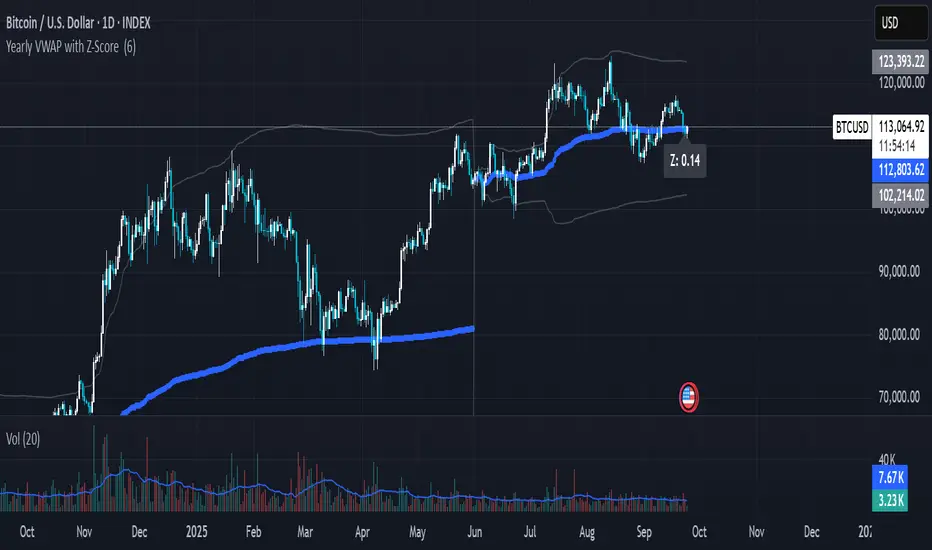
Yearly VWAP with Z-Score V2This script extends the traditional Volume Weighted Average Price (VWAP) by applying it to yearly sessions (with a customizable start month) and combining it with a Z-Score framework to standardize price deviations from VWAP.
Features
Yearly VWAP: Automatically resets at the selected month, making it possible to align VWAP with fiscal or seasonal cycles (e.g., June–May).
Volatility-Weighted Bands: Standard deviation is calculated using volume-weighted price variance, creating adaptive upper and lower bands around VWAP.
Z-Score Calculation: Converts price distance from VWAP into standardized scores, ranging from +2.5 to –2.5. This enables statistical interpretation of whether price is trading at fair value, extended, or oversold relative to VWAP.
Custom Session Control: Input allows users to change the yearly anchor month.
On-Chart Display: VWAP and bands are plotted, with a live Z-Score label shown on the latest bar.
How to Use
Fair Value Reference: VWAP reflects the average price weighted by volume over the yearly session — a natural equilibrium point.
Overbought / Oversold Detection: Extreme Z-Score readings (±2 or beyond) highlight when price is stretched relative to VWAP.
Cycle Analysis: Resetting VWAP by custom months allows studying market behavior over fiscal years, seasons, or custom trading cycles.
Part of a Broader Toolkit: This script is not a standalone trading system. It works best when aggregated with other indicators, confluence factors, or a structured strategy.
Originality
Unlike a standard VWAP, this version:
Uses yearly anchoring with custom start month instead of session/day anchoring.
Adds volume-weighted standard deviation bands for statistical context.
Translates distance into a Z-Score scale for objective overbought/oversold assessment.
Positive Z-Score values indicate zones where price is positioned favorably for accumulation or potential buys, while negative values highlight areas more suitable for distribution or profit-taking — always best used in confluence with other tools rather than as a standalone signal
BTC Parabolic Trend Lines v6 (jerikoo)📈 BTC Parabolic Trend Lines v6 - Power Law Regression Indicator
Description:
Advanced regression analysis tool that fits parabolic curves to Bitcoin's price history, revealing long-term growth patterns and future projections based on mathematical power laws.
This indicator implements three types of regression models optimized for Bitcoin's unique price behavior:
🎯 Key Features:
1. Power Law Regression (Recommended for BTC)
Fits the famous Bitcoin Power Law: Price = Offset + A × time^B
Captures BTC's diminishing growth rate over time
Provides the most accurate long-term fit with R² typically > 0.94
2. Multiple Regression Types
Power Law: Best for long-term BTC analysis
Exponential: For shorter timeframes and aggressive growth phases
Polynomial: Quadratic/cubic curves for alternative modeling
3. Dynamic Channel Bands
Upper band (red): Overvalued zone - potential resistance
Lower band (green): Undervalued zone - potential support
Adjustable deviation multipliers based on historical volatility
4. Starting Price Offset
Accounts for Bitcoin's non-zero starting price (~$5-10)
Provides more realistic lower bounds
Improves fit accuracy for early price data
📊 How to Use:
Settings:
Regression Length: 400 bars recommended for best fit
Starting Price Offset: 5-10 for BTC (it didn't start at $0)
Channel Deviation: 1.5 standard deviations default
Future Projection: Extends regression into future (100 bars default)
Interpretation:
Yellow line: Fair value according to the regression model
Above red band: Potentially overvalued (historical tops often here)
Below green band: Potentially undervalued (historical bottoms often here)
R² Value: Closer to 1 = better fit (>0.9 is excellent)
🔄 Timeframe Adaptability:
Automatically recalculates when switching timeframes
Each timeframe shows its own optimized regression
Works on all timeframes from daily to monthly
📈 Trading Applications:
Long-term Investment: Identify accumulation zones when price is below fair value
Cycle Analysis: Spot potential tops when price exceeds upper band
Risk Management: Use bands as dynamic support/resistance levels
Portfolio Allocation: Increase/decrease position based on valuation zones
⚙️ Technical Details:
Uses logarithmic price transformation for better BTC fitting
Implements least squares regression for coefficient calculation
RMSE-based channel bands adapt to volatility
Smooth polyline rendering for visual clarity
📝 Notes:
Best suited for BTC due to its unique power law characteristics
Longer regression periods (300-500 bars) provide more stable trends
The projection assumes historical patterns continue (not financial advice)
Works best on logarithmic price scale for visualization
🎨 Visual Indicators:
Background coloring: Red (overvalued) / Green (undervalued)
Statistics label: Shows R², equation, and current valuation
Smooth curves: No gaps or jumps at current date
Future projection: Seamlessly extends from current price
⚠️ Important:
This is a statistical analysis tool, not a prediction system. Bitcoin's price can deviate significantly from the regression line during bull/bear cycles. The power law provides a long-term growth framework, not short-term trading signals.
Version: 6.0 Author: Created with Pine Script v6 Best For: BTC long-term analysis, cycle identification, valuation assessment Timeframes: All (Daily to Monthly recommended) Markets: Optimized for Bitcoin, may work on other crypto with adjustments

Trigonometric Sine Cosine WavesTrigonometric Sine Cosine Waves - Advanced Cyclical Analysis
Overview
This innovative indicator applies trigonometric mathematics to market analysis, generating dynamic sine and cosine waves that adapt to price movement and volatility. Unlike traditional oscillators, this tool visualizes market cycles directly on your chart using mathematical wave functions.
How It Works
The indicator calculates phase-based waves using:
• Phase Calculation: 2π × bar_index / cycle_length
• Adaptive Amplitude: EMA-based price + ATR volatility scaling
• Sine Wave: avgPrice + volatility × sin(phase)
• Cosine Wave: avgPrice + volatility × cos(phase)
Key Features
Dynamic Wave Generation
• Sine Wave: Primary cycle indicator with smooth transitions
• Cosine Wave: Leading indicator (90° phase difference from sine)
• Adaptive Amplitude: Automatically adjusts to market volatility using ATR
Turning Point Detection
• Anti-Repaint Signals: Uses confirmed values from previous bars
• Sine Bottom: Potential buy zones when wave transitions from down to up
• Sine Top: Potential sell zones when wave transitions from up to down
Advanced Analytics
• Price Correlation Angle: Shows relationship between price movement and cycle
• Phase Information: Current position in the mathematical cycle
• Real-time Values: Live sine/cosine values and phase degrees
Visual Enhancement
• Background Coloring: Changes based on sine wave position (above/below zero)
• Clean Overlay: Waves plot directly on price chart without cluttering
Parameters
• Cycle Length (5-200): Controls wave frequency - shorter = more sensitive
• Amplitude Multiplier (0.1-5.0): Adjusts wave height relative to volatility
• Display Options : Toggle sine wave, cosine wave, and correlation table
• Show Correlation : Optional table showing mathematical values
Trading Applications
Cycle Analysis
• Identify market rhythm and timing
• Spot potential reversal zones
• Understand price-to-cycle relationships
Entry/Exit Timing
• Buy Signals: Sine wave bottoms (cycle lows)
• Sell Signals: Sine wave tops (cycle highs)
• Confirmation: Use with other indicators for higher probability setups
Market Structure
• Visualize underlying market cycles
• Identify periods of high/low cyclical activity
• Track phase relationships between price and mathematical cycles
Pro Tips
1. Longer cycles (50-100) work better for swing trading
2. Shorter cycles (10-20) suitable for scalping
3. Combine with volume for stronger signal confirmation
4. Monitor correlation angle for trend strength assessment
5. Use background color as quick visual cycle reference
Important Notes
• Signals are anti-repaint using confirmed previous bar values
• Best used in trending or cyclical markets
• Consider market context when interpreting signals
• Mathematical approach - not based on traditional TA concepts
Alerts Included
• Sine Wave Buy Signal: Triggered on wave bottom detection
• Sine Wave Sell Signal: Triggered on wave top detection
Technical Requirements
• Pine Script v6
• Works on all timeframes
• No external dependencies
• Optimized for performance
This is a free, open-source indicator. Feel free to modify and improve according to your trading needs!
Educational Value: Perfect for understanding how mathematical functions can be applied to market analysis and cycle detection.

The Ultimate Buy and Sell Indicator: Unholy Grail Edition"You see, Watson, the market is not random—it simply whispers in a code too complex for the average trader. Lucky for you, I am not average."
They searched for the Holy Grail of trading for decades—promises, false prophets, and overpriced PDFs.
But they were all looking in the wrong place.
This isn’t a relic buried in the desert.
This is the Unholy Grail — a machine-forged fusion of logic, engineering, and tactical overkill .
Built by Sherlock Macgyver , this is not a mystical object. It’s a surveillance system for trend detection, signal validation, and precision entries .
⚠️ Important: This script draws its own candles.
To see it properly, disable regular candles by turning off "Body", "Wick" and "Border" colors.
🔧 What You’re Looking At
This overlay plots confirmed Buy/Sell signals , momentum-based “watch” zones , adaptive candle coloring , SuperTrend bias detection , dual Bollinger Bands , and a moving average ribbon .
It’s not “minimalist” —it’s comprehensive .
📍 Configuring the Tool: Follow the Breadcrumbs
Every setting includes a tooltip — read them . They're not filler. They explain exactly how each feature functions so you can dial this thing in like you're tuning a surveillance rig in a Cold War bunker .
If you skip them, you're walking blind in a minefield .
🕰️ Timeframes: The Signal Sweet Spot
Each asset has a tempo . You need to find the one where signals align with clarity —not chaos .
Start with 4H or 1H —work up or down from there.
Too many fakeouts? → Higher timeframe
Too slow? → Drop to 15m or 5m —but expect more noise and adjust settings accordingly.
The signals scale with time, but you must find the rhythm that best fits your asset—and your trading lifestyle .
♻️ RSI Cycle = Signal Sensitivity
This is the heart of the system . It controls how reactive the RSI engine is.
Adjust based on noise level and how often you can actually monitor your charts.
Short cycle (14–24): More signals, more speed, more noise
Longer cycle (36–64): Smoother entries, better for swing traders
Tip: If your signals feel too jittery, increase the cycle. If they lag too much, reduce it.
📉 SuperTrend: Your Trend Bias Compass
This isn’t your average SuperTrend. It adapts with RSI overlay logic and detects market “silence” via EMA compression— turning white right before the chaos . That said, you still control its aggression.
ATR Length = how many bars to average
ATR Factor = how tight or loose it hugs price
Lower = more sensitive (more trades, more noise)
Higher = confirmation only (fewer, but stronger signals)
Tweak until it feels like a sniper rifle.
No, you won’t get it perfect on the first try.
Yes, it’s worth it.
🛠️ Modular Signals: Why Things Fire (or Don’t)
Buy/Sell entries require conditions to align. The logic is modular, and that’s on purpose.
RSI signals only fire if RSI crosses its smoothed MA outside the dead zone and a “Watch” condition is active.
SuperTrend signals can be enabled to act on crossovers, optionally ignoring the Watch filter .
Watch conditions (colored squares) act as early recon and hint at possible upcoming trades.
Background color changes are “pre-signal warnings” and will repaint . Use them as leading signals, not gospel.
Want more trades? Loosen your filters .
Want sniper entries? Lock them down .
🌈 Candles and MAs: Visual Market Structure
Candles adapt in real-time to MA structure:
Green = bullish (above both fast/slow MAs)
Yellow = indecision (between)
Red = bearish (below both)
Buy/Sell signals override candles with bright orange and fuchsia —because subtlety doesn’t win wars .
You can also enable up to 8 customizable moving averages —great for confluence , trend confirmation , or just looking like a wizard .
🧠 Pro Usage Tips (TL;DR for Smart People):
Use tooltips in the settings menu —every toggle and slider is explained
Test timeframes until signal frequency and reliability match your goals
Adjust RSI cycle to reduce noise or speed up signals based on how frequently you trade
Tweak SuperTrend factor and ATR to fit volatility on your asset
Start with visual confirmation :
• Are watch signals lining up with trend zones?
• Are backgrounds firing before price moves?
• Are candle colors agreeing with signal direction?
📣 Alerts & Integration
Alerts are available for:
Buy/Sell entries (confirmed or advanced background)
Watch signals
Full band agreement (both Bollinger bands bullish or bearish)
Use these with webhook systems , bots , or your own trade journals .
Created by Sherlock Macgyver
Because sometimes the best trade…
is knowing exactly when not to take one.
