Smart Scalper Indicator🎯 How the Smart Scalper Indicator Works
1. EMA (Exponential Moving Average)
EMA 10 (Blue Line):
Shows the short-term trend.
If the price is above this line, the trend is bullish; if below, bearish.
EMA 20 (Orange Line):
Displays the longer-term trend.
If EMA 10 is above EMA 20, it indicates a bullish trend (Buy signal).
2. SuperTrend
Green Line:
Represents support levels.
If the price is above the green line, the market is considered bullish.
Red Line:
Represents resistance levels.
If the price is below the red line, the market is considered bearish.
3. VWAP (Volume Weighted Average Price)
Purple Line:
Indicates the average price considering volume.
If the price is above the VWAP, the market is strong (Buy signal).
If the price is below the VWAP, the market is weak (Sell signal).
4. ATR (Average True Range)
Used to measure market volatility.
An increasing ATR indicates higher market activity, enhancing the reliability of signals.
ATR is not visually displayed but is factored into the signal conditions.
⚡ Entry Signals
Green Up Arrow (Buy):
EMA 10 is above EMA 20.
The price is above the SuperTrend green line.
The price is above the VWAP.
Volatility (ATR) is increasing.
Red Down Arrow (Sell):
EMA 10 is below EMA 20.
The price is below the SuperTrend red line.
The price is below the VWAP.
Volatility (ATR) is increasing.
🔔 Alerts
"Buy Alert" — Notifies when a Buy condition is met.
"Sell Alert" — Notifies when a Sell condition is met.
✅ How to Use the Indicator:
Add the indicator to your TradingView chart.
Enable alerts to stay updated on signal triggers.
Check the signal:
A green arrow suggests a potential Buy.
A red arrow suggests a potential Sell.
Set Stop-Loss:
Below the SuperTrend line or based on ATR levels.
Take Profit:
Target 1-2% for short-term trades.
Cari dalam skrip untuk "smart"

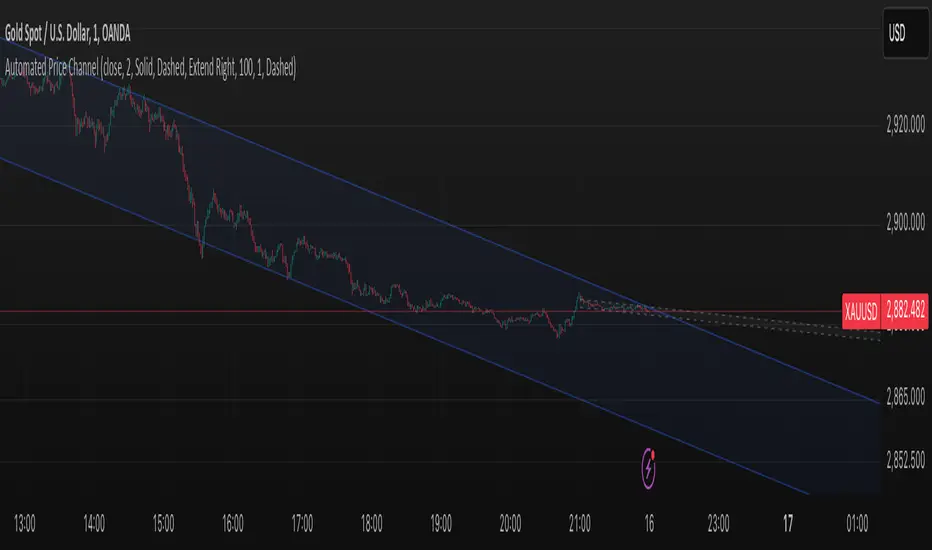
Smart ChannelThe "Smart Channel" indicator is designed to dynamically identify and plot price channels on a chart. It uses a statistical approach based on Pearson's correlation coefficient to determine the best-fit channel for both short-term and long-term trends. This allows traders to visualize potential support and resistance levels, identify trend direction, and potentially anticipate breakouts or reversals.
How it Works:
Data Input: The indicator takes a source input (typically the closing price) as the basis for its calculations.
Period Selection: It defines two sets of lookback periods: one for short-term analysis and one for long-term analysis. The code iterates through these periods, calculating a linear regression and standard deviation for each.
Pearson's Correlation: For each period, the indicator calculates Pearson's R, which measures the strength and direction of the linear relationship between price and time. A higher absolute value of Pearson's R indicates a stronger trend.
Best Fit Channel: The indicator identifies the period with the highest Pearson's R for both short-term and long-term and uses the corresponding linear regression parameters (slope and intercept) to define the midline of the channel.
Standard Deviation: The standard deviation of the price data around the regression line is calculated. This is used to define the upper and lower boundaries of the channel. The channel width is controlled by a "Deviation Multiplier" input.
Channel Plotting: The indicator plots the midline, upper boundary, and lower boundary of the channel on the chart. Separate channels are plotted for the short-term and long-term best-fit periods, using different colors for easy visual distinction.
Dynamic Updates: The channel is dynamically updated as new price data becomes available, adjusting to the evolving market trend.
Key Inputs and Settings:
Source: The price data used for calculations (e.g., close, open, high, low, etc.).
Use Long-Term Channel: A boolean input to enable/disable the calculation and plotting of the long-term channel.
Deviation Multiplier: Controls the width of the channel (how many standard deviations away from the midline the boundaries are).
Channel/Midline Colors and Transparency: Customizable colors and transparency levels for the channel lines and fill.
Line Styles: Options for solid, dotted, or dashed lines for the channel boundaries and midline.
Extend Style: How the channel lines should extend (right, both, none, left).
Interpretation and Usage:
Trend Identification: The direction of the midline indicates the prevailing trend. An upward-sloping midline suggests an uptrend, while a downward-sloping midline suggests a downtrend.
Support and Resistance: The upper and lower channel boundaries can act as potential support and resistance levels.
Breakouts: A price move outside of the channel boundaries may signal a potential breakout or reversal.
Overbought/Oversold: Prices touching or exceeding the upper boundary might suggest an overbought condition, while prices touching or exceeding the lower boundary might suggest an oversold condition.
Short-Term vs. Long-Term: Comparing the short-term and long-term channels can provide insights into the overall market context. For example, a short-term uptrend within a long-term downtrend might suggest a potential buying opportunity before the larger trend resumes.
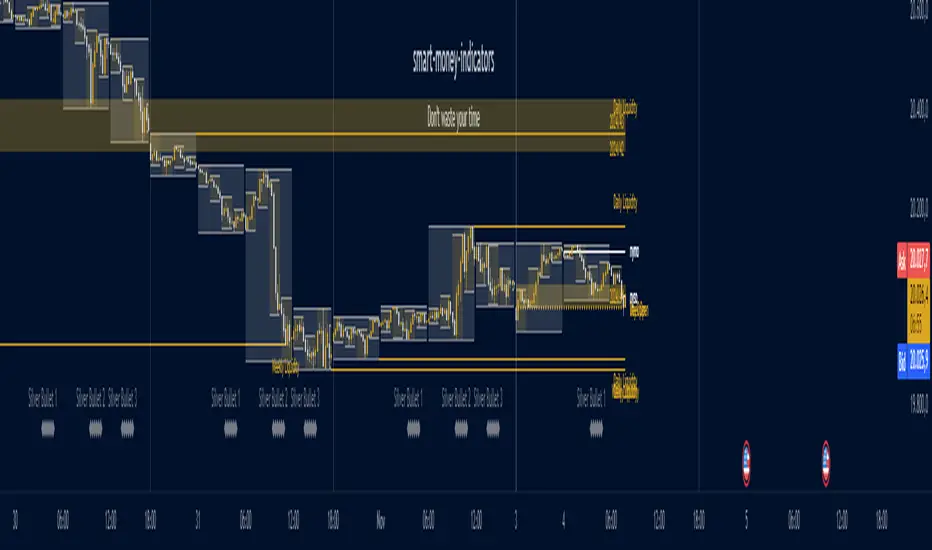
Ultimate ICT [smart-money-indicators]This indicator is a tool to support the "ICT" strategy.
This indicator does not provide entry or exit signals.
This indicator is a tool to mark key price areas.
This indicator is a tool to mark key time areas.
This indicator is particularly distinguished by its high customizability of tools,
setting it apart from the indicators currently available on the TradingView platform.
The following key areas are marked with the help of lines, boxes, background color, or plots:
Time Separators:
- Monthly separator
- Weekly separator
- Daily separator
Liquidity Zones:
- Daily highs/lows
- Weekly highs/lows
- Monthly highs/lows
- Asia Session (during or after the session)
- London Session (during or after the session)
- New York Session (during or after the session)
- London Close Session (during or after the session)
- Session Quarters
- Central Banks Dealer Range
Opening Prices/Average Prices:
- Weekly opening price
- New Week Open Gap
- Daily opening price
- Premium/Discount zone of the day (50% line)
- New York Midnight Open price
- New York Session Open price
Manipulation Times:
- 3 Silver Bullet times
- Macros
How can I use or interpret these areas?
Liquidity Zones:
The liquidity zones used here are time-based.
Liquidity zones can be used, depending on the reaction, either to confirm the continuation of the current trend
or as a signal for a reversal of the current trend.
Opening Prices/Average Prices:
These can be used as separators between the premium and discount zones.
If the price is below one of these values, you are in the discount zone and might look for buy signals.
If the price is above one of these values, you are in the premium zone and might look for sell signals.

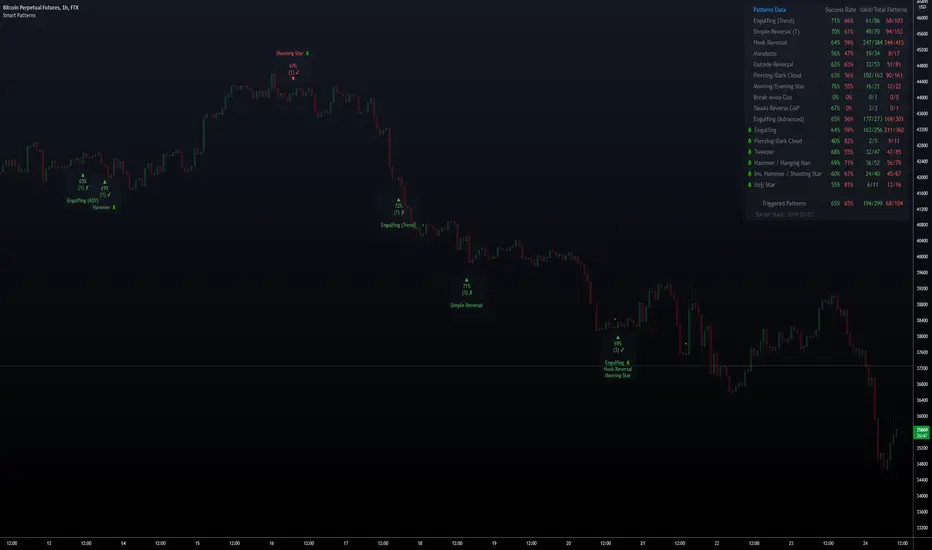
Smart PatternsHi Traders, and welcome to Smart Patterns.
Patterns can be very profitable, yet hard to trade, even when combined with other indicators and techniques. This script aims to increase the accuracy of signals by adding a statistical approach to candle patterns, along with tools to filter them.
For example, if the Success Rate is above a certain threshold, it means that the pattern has resulted in a higher ratio of profitable trades and hence it has a higher likelihood of succeeding in the current market conditions. However, should that pattern fall below the desired Success Rate, the script will "hide" it and won't trigger a signal, but still keeping track of its performance to start firing it again when coming back above the Success Rate.
Key Features
The script features custom patterns as well as some of TradingView's built-in patterns. Not all patterns can be added of course, but let me know if I missed other interesting ones and I will do my best to add them in future updates.
When a Pattern reaches the Min. Target % within the Candles Range selected, it is then considered valid. Please remember that doesn't take into account possible draw-downs or stop-losses.
Patterns are constantly evaluated inside the script; when a pattern's overall score (Success Rate %) is below the required minimum, the signal won't be triggered. However, the script will keep monitoring it in the background, and trigger a signal again when its score comes back above the minimum Success Rate.
The Patterns' signals can be filtered by Success Rate, Minimum Patterns detected and candle size (calculated via ATR).
The Data Panel will show individual statistics for Enabled Patterns as well as final statistics for Triggered Patterns.
Tooltips in the settings panel will further explain available options.
Alerts: simple alerts can be added by selecting "any alert() function call" when adding an Alert. Customizable alerts can also be created through dropdown menu ( Bullish \ Bearish Patterns Detected).
Fully customizable to adapt to light and dark themes
Notes and Recommendations
Always be realistic when tweaking settings, making sure the output makes sense in a normal trading environment. Statistics are helpful but shouldn't be the only factor to base your decisions on - even if a pattern reaches 100% Success Rate, it doesn't mean it will keep being profitable.
Since the script crunches quite some data it may give output errors especially if settings are not properly tweaked - or if the filters are too liberal (e.g. Min Target % set to 0.1) - hence triggering lots of signals. Please adjust the settings or enable only the Patterns you are trading.
If the script gives the error "Too many drawings, cannot clean oldest" it means your settings give too many signals and that is usually not a good sign - it's recommended to double-check your settings as mentioned above.
Credits
Trading View for built-in patterns
Special thanks go to PineCoders community for their incredible efforts and learning material to help mastering PineScript!
Smart Bottom SignalThis indicator is used to find temporary bottoms that are validated with a subsequent candle that closes above the high. The indicator is based on elliott wave theory and tries to signal entries on wave lows. It triggers off of code from " TD D-Wave" 0, 2, 4, A, and C bull wave lows by finding a candle with a close higher that the high of the lowest wave candle or the high of a bullish candle that first breaks above the 8EMA. Green arrows will plot on close indicating that the indicator was triggered.
There are 3 options for display of plots provided:
ShowSmartSigs - This is defaulted to true (display) and allows users to toggle the green arrow alert plots on/off that appear below the candle when triggered.
ShowOnOffPlots - This is logic I use to signal a downturn/upturn and is indicated by red/green arrows appearing above the trigger candle.
ShowBounceSigs - This is defaulted to false and would show as an orange arrow under a candle where a bullish candle first climbs above the 8EMA when ShowOnOffPlots is signaling a downturn and SlowtSochastics is below 21. The SlowStochastics settings are adjustable on the settings screen and default to 21,3.
Alerts Available:
"Smart Buy Bounce" - This alert fires when the ShowSmartSigs signal is triggered.
"Buy Bounce" - This alert fires when the ShowBounceSigs signal is triggered.
"Turn Off Bots"/"Turn On Bots" - This alert fires when the ShowOnOffPlots signals are triggered. I use this to turn off shorter timeframe (15m-1H) bots during a prolonged price drop.
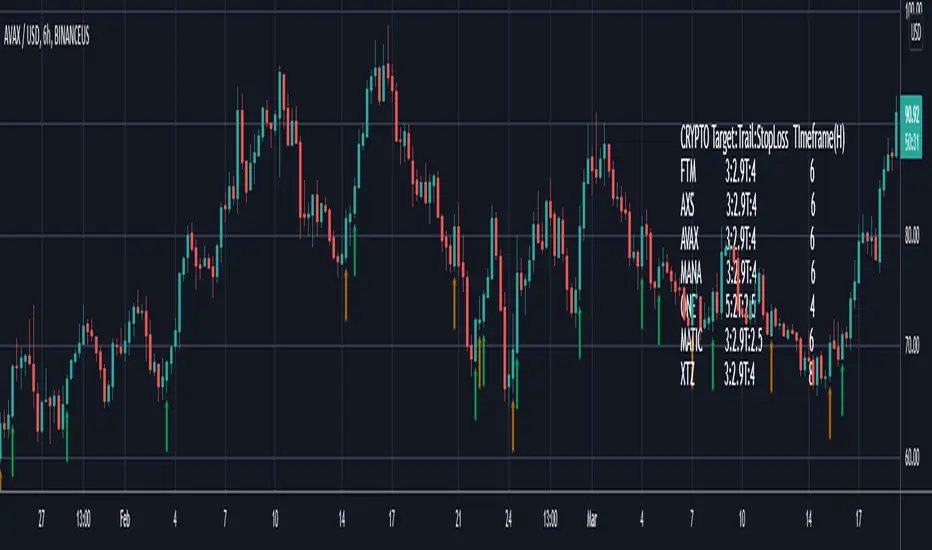
This is an early prototype that is filtered to the following tested cryptos against the specified chart timeframes and using the expressed target/trail/stoploss logic.
CRYPTO Target:Trail:StopLoss TImeframe(H)
FTM 3:2.9T:4 6
AXS 3:2.9T:4 6
AVAX 3:2.9T:4 6
MANA 3:2.9T:4 6
ONE 5:2T:2.5 4
MATIC 3:2.9T:2.5 6
XTZ 3:2.9T:4 8
Smart RebalanceThis script is based on the portfolio rebalancing strategy. It's designed to work with cryptocurrencies, but it can work with any market.
How portfolio rebalance works?
Let's assume your initial capital is $1000, and you want to distribute it into 4 coins. This script takes the USDT as the stable coin for the initial money, so in case you want other currency, the pairs must be with that fiat as the quote.
Following our example, you would take BTC, ETH, BNB, and FTT. After selecting the coins, it's time to choose how much allocation is on each. Let's put 25% on each. This way, $250 of our capital on each coin.
After selecting the coins and their allocation, you choose the price change ratio for rebalancing. Let's use 1%. Next, you start to watch the markets. The first thing that happens, following our example, is the BTCUSDT price moving 1% up.
That amount hit the ratio of 1% for the rebalance. Hence, you sell 1% of BTC for USDT and redistribute to the other coins, buying 0.25% of each currency to rebalance the portfolio.
Next, ETHUSDT goes 1% down, time to rebalance again. This time, you need to take 0.33% of each other coin and buy ETH, so this way, it's all divided as the chosen allocation.
Why use rebalancing?
Looks easy, right? It is, but very time demanding. Demands even more if you raise the number of coins you want to distribute. Having a system to do that automatically is a must to work efficiently. Rebalancing spreads the risk among multiple currencies. This way, you earn small when it goes up, but you lose small when it goes down.
What this script helps with portfolio rebalance?
This indicator will not buy/sell for you but will help you choose the best markets for your rebalancing. Which coin will work best in that period? Do I need to have more than 8 coins? How much must be my ratio? Those questions you can answer using this indicator.
What this script has?
Start and End dates
The script will work for a certain period. All calculations will be done in that period.
Coin Ratio %
The amount of price movement of each asset that will be used to calculate the rebalancing
Initial Capital and Broker Fee
The amount of capital to be used on the rebalancing and the broker fee you want to use the strategy. The cost will be applied on every trade, buying or selling the coins.
Assets, allocations, and colors
It's possible to select from 2 to 10 assets to be used on the portfolio. Each purchase must have the allocation %. Suppose the sum of the allocations is different from 100%. In that case, a warning message will appear on the chart instead of the statistics.
Panel and tooltips
There is a panel with a summary of the results
Set allocations automatically
There is an option to make the indicator use the daily asset volume from the day before to determine the allocation percentage of each asset. This option is better if you are unsure how much allocation you want to use on each coin.
Use this indicator as a backtest for your rebalancing strategy. The selected market on the chart will not affect the calculation on this indicator, but the time frame will. The higher the time frame, the higher the coin ratio % must be.
About the code
The code is written to use arrays to store the values of each asset, making the calculations on each candle inside the time range. The for-loops are used to reduce the code length and make it easy to change the analysis of all assets. Finally, the script has some comments on the code.

Smart Swing Strategy for StockSpecial indicator for stock but you can try another instrument.
Trend determination and buy/sell signals are using the Alligator system from Bill Williams .
To get maximum profit, the system uses the trailing stop technique using Average True Range (ATR) with 4 moving average options (RMA, SMA , EMA , WMA ).
Please leave comments if any opinions.
Disclaimer
The content is in any event provided with the intention of being for general circulation and availability only. As such it is not intended to and does not form part of any offer or recommendation directed at you specifically, or have any regard to your investment objectives, financial situation, or needs of yourself or any other specific person. Before committing to a trade or investment, please seek advice from financial or other professional advisers regarding the suitability of the trade for you. If you do not wish to seek such financial advice, please consider carefully whether the product is suitable for you as you alone remain responsible for your trading gains and losses.

Smart Entry BETAA Custom Unique indicator by NRTH_
Comes included with the Premium Package.
Indicator features
Built-In Alerts
Visual Risk Management
Customizable Entry Rules
Usage Tips
Smart Entry is currently a BETA algo. we are still in the process of tweaking and programming it only give entry signals when they are confirmed, and work of very strict parameters to allow for trading all the way down to the 5m timeframe. It is currently at a stage where it can produce profitable trades or even just act as a confirmation signal in use with another strategy, but this project will be ongoing until we can obtain high profitability levels on very low timeframes.
The algo uses both momentum and trend calculation to find an entry, highly recommended use with the built-in MA Filter for best results.
Works for all markets with the ability to customize to your liking.
Backtesting Results Info
Period 1/1/2021-1/10/2021
Entry value at $1000 with 10x leverage
Binance standard taker fee rate (0.04%)
ATR Exits : 1:2.9 RR
-------------------------------------------
Disclaimer
Copyright NRTH_ Indicators 2021.
NRTH_ and all affiliated parties are not registered as financial advisors. The products & services NRTH_ offers are for educational purposes only and should not be construed as financial advice. You must be aware of the risks and be willing to bear any level of risk to invest in financial markets. Past performance is not necessarily indicative of future results. NRTH_ and all individuals associated assume no responsibility for your trading results or investments.
All investments involve risk, and the past performance of a security, industry, sector, market, financial product, trading strategy, or individual’s trading does not guarantee future results or returns. Investors are fully responsible for any investment decisions they make. Such decisions should be based solely on an evaluation of their financial circumstances, investment objectives, risk tolerance, and liquidity needs.

Smart AlertsThis indicator provides back-tested signals and alerts from multiple technical indicators.
No more guessing whether or not you should trust an indicator. See your indicators' past performance at a glance.
No more false alarms. Disable re-painting of signals.
When multiple indicators overlap, a Confluence indicator will print (large triangle). With your settings properly tuned, this will show a HIGH probability of a move.
Current Signal/Alert Options (more to come):
RSI Oversold
RSI Overbought
EMA Crossing Up
EMA Crossing Down
Buy Signal Confluence
Sell Signal Confluence
Instructions:
-Enable/disable individual indicators so you can fine tune one at a time
-Adjust the indicator's settings
-Adjust your trade parameters (Max Wait, Take Profit %). Signals that would have given the desired profit in the time allowed will be painted orange.
-Repeat this process with each indicator until you're satisfied
-Set-up alerts

Smart EMA SignalsThis indicator starts by plotting each time the price action crosses above or below the EMA, of which you can tune the timeframe and duration.
It then takes it a step further and plots whether or not that indicator would have given you a profitable trade, of which you can also tune the parameters (Max wait time, and % Profit).
Once you have your EMA tuned to your liking, set up alerts to notify you of a golden opportunity.

Smart Labelling - Candlestick ChartingThis is a full-fledged implementation of a system presented in an unique research paper 'Profitability of Candlestick Charting Patterns in the Stock Exchange of Thailand' (2017) on candlestick charting, candlestick patterns, trend identification methods, and testing.
You can easily find this paper in the Web. For example, visit: www.researchgate.net
This script is best suited for middle-to-higher time frames. Possible future developments: trend identification and factor calculation techniques.
Donate: PayPal (paypal.me)

Smart Labelling - Range FilterThis is a labelling module based on a range filter . Notice that the trick here is to use fibonachi numbers . Use smaller range multiplier for higher TFs. This module may serve as a signal generator to be passed through a signal filter.
Quote from the original author:
This is an experimental study designed to filter out minor price action for a clearer view of trends. Inspired by the QQE's volatility filter, this filter applies the process directly to price rather than to a smoothed RSI. First, a smooth average price range is calculated for the basis of the filter and multiplied by a specified amount. Next, the filter is calculated by gating price movements that do not exceed the specified range. Lastly the target ranges are plotted to display the prices that will trigger filter movement.

Smart Target Introduction
This is the first forward-looking indicator on TradingView!
A normal moving average indicator will use two averages of differing lengths, referred to as “fast and slow” or “short and long” moving averages, to identify trends and potential trades.
The Smart Target indicator uses the average trade profitability and trade duration of a moving average strategy to determine a forward-looking target that is specific to the chart that it has been applied to.
Every historical trade is considered when the indicator determines the future price target of an asset and the accuracy will improve with time as new trade data is continually introduced.
Indicator Utility
If the fast-moving average crosses above the slow, a blue target will appear.
A red target will appear when the fast-moving average crosses below the slow.
The target will never change once it has been plotted and will not repaint in any way which means that it is fully functional for trading in real-time.
Input Values
The period length of the two moving averages will need to be determined by the user and can be changed in the indicator settings panel.
View the full documentation on this indicator at this link: www.kenzing.com

Smart VolumeOut of beta!
This script distinguishes up/down volume based on lower resolution.
It's important to set correct input "Detailed Resolution" — it affects detalization/loading speed. If equal to chart resolution, should match builtin "volume". The lower it is, the more detalized up/down border.
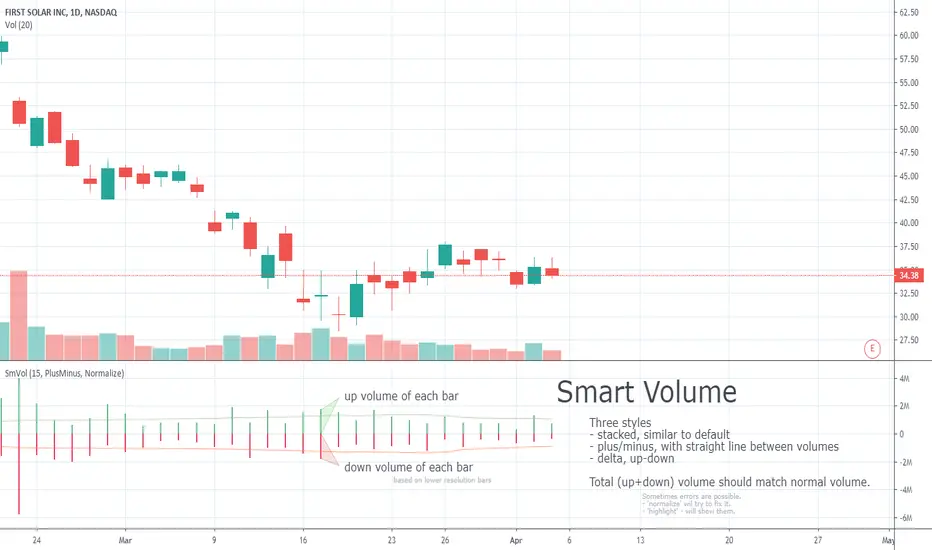
Smart Volume (beta)This script distinguishes up/down volume based on lower resolution.
It's important to set correct inputs. Second - affects detalisation/loading speed. Third one needs to be set according to your chart resolution. 1440 for 'D', 30 for '30'.

DR.SS.SMART BUY/SMARTSELL SCALPER1️⃣ BEST TIMEFRAME
Use this as a scalper / intraday trend tool
✅ Best
5 min
15 min
⚠️ Avoid
1 min (too noisy)
Daily (signals become late)
2️⃣ FIRST CHECK – MARKET CONDITION (Dashboard)
Before taking any trade, look at the Smart Panel (Dashboard):
✔ Trade ONLY when:
Market State = Trending
Volatility = Active
Trend Pressure = Bullish or Bearish
At least 3–4 MTF boxes are same color
❌ Avoid trades when:
Market State = No trend / Ranging
Purple candles (ADX sideways)
Remember:
T-V-T rule → Trend + Volatility + Timeframe agree
3️⃣ BUY SETUP (LONG TRADE)
✅ Conditions in your code:
Price crosses ABOVE Supertrend
Close ≥ SMA 13
Bar color turns BLUE
Price above EMA 200 → Smart Buy
ADX not sideways (no purple bars)
📍 Chart shows label:
“Buy” → normal buy
“Smart Buy” → high-probability trade (BEST)
🔵 HOW TO ENTER BUY
Enter at candle CLOSE where Buy / Smart Buy appears
Do NOT enter mid-candle
🛑 STOP LOSS (Auto from code)
SL = ATR-based stop
Shown as red SL line
👉 Safe rule:
Never widen SL
🎯 TARGETS (Auto plotted)
TP1 = 1:1
TP2 = 2:1
TP3 = 3:1
📌 Recommended management:
Book 50% at TP1
Move SL to Entry
Hold rest till TP2 / Trail
4️⃣ SELL SETUP (SHORT TRADE)
✅ Conditions:
Price crosses BELOW Supertrend
Close ≤ SMA 13
Bar color turns RED
Price below EMA 200 → Smart Sell
No sideways (ADX > 15)
📍 Label shown:
“Sell”
“Smart Sell” (BEST)
🔴 HOW TO ENTER SELL
Enter at close of signal candle
Follow same SL & TP rules
5️⃣ SUPPLY & DEMAND CONFIRMATION (POWER FILTER)
🔹 Best Buy:
Price near Demand Zone
Then Smart Buy appears
🔹 Best Sell:
Price near Supply Zone
Then Smart Sell appears
👉 These are institutional entries
6️⃣ WHEN NOT TO TRADE ❌
Avoid trades when:
Purple candles (Sideways)
Supertrend flipping repeatedly
MTF dashboard mixed colors
During low-volume sessions
7️⃣ SESSION WISE BEST PERFORMANCE
From your session logic:
✅ Best Scalping:
London
London + New York overlap
⚠️ Avoid:
Mid-Tokyo (low volatility)
8️⃣ PERFECT TRADE CHECKLIST (SAVE THIS)
Before clicking BUY/SELL, ask:
✔ Smart Buy / Smart Sell?
✔ Price above/below EMA 200?
✔ Dashboard trend agrees?
✔ No sideways candles?
✔ Volatility Active?
👉 If 4 out of 5 = YES → TAKE TRADE
9️⃣ SIMPLE ONE-LINE STRATEGY
Trade only Smart Buy/Sell in trending market, book partial at 1:1, trail rest with Smart Trail
✅ BEST TRADING SESSIONS (Use ONLY these)
🥇 LONDON SESSION (BEST & SAFE)
🕒 12:30 PM – 4:30 PM IST
Why best for your script
Clean trends
Good volatility
Less fake signals
Supertrend + EMA200 works perfectly
👉 This should be your PRIMARY session
🥈 LONDON → NEW YORK OVERLAP (MOST POWERFUL)
🕒 6:00 PM – 8:30 PM IST
Why
Institutional money enters
Strong breakouts
Smart Buy / Smart Sell accuracy highest
👉 Use only Smart signals in this session
🥉 NEW YORK SESSION (Early Part Only)
🕒 6:00 PM – 9:00 PM IST
Use when
Market State = Trending
Volatility = Active
MTF mostly same color
⚠️ Stop after 9:00 PM IST
❌ SESSIONS TO AVOID
🚫 TOKYO SESSION
🕒 5:30 AM – 10:30 AM IST
Low volatility
Sideways (purple candles)
Many fake reversals
🚫 SYDNEY SESSION
🕒 2:30 AM – 5:30 AM IST
Very low volume
Not suitable for scalping
🚫 INDIAN MIDDAY
🕒 11:00 AM – 12:15 PM IST
Choppy
Stop-hunting candles
📌 BEST DAILY ROUTINE (Follow This)
Time (IST) Action
9:15 – 10:30 ❌ Avoid (fake moves)
12:30 – 4:30 ✅ TRADE (Best zone)
6:00 – 8:30 ✅ TRADE (High accuracy)
After 9:00 ❌ Avoid
🧠 EASY MEMORY RULE (Your Style)
“LON → NY = MONEY” 💰
“ASIA = NO TRADE” ❌
🎯 FINAL RECOMMENDATION
If you want only ONE session:
👉 Trade ONLY: 12:30 PM – 4:30 PM IST
This will give:
Less stress
Higher win-rate
Cleaner Smart Buy/Sell signals
🇮🇳 BEST TRADING SESSIONS (INDIA – IST)
🥇 LONDON SESSION – BEST FOR INDIAN TRADERS
🕒 12:30 PM – 4:30 PM IST
✅ THIS IS THE BEST SESSION
Strong trend moves
High accuracy Smart Buy / Smart Sell
Less sideways (purple candles reduce)
Works perfectly with Supertrend + EMA 200
👉 Use this as your MAIN session
🥈 LONDON → NEW YORK OVERLAP (POWER SESSION)
🕒 6:00 PM – 8:30 PM IST
✅ Very strong moves
Institutional activity
Best breakouts
High RR trades (2:1 / 3:1)
⚠️ Trade only Smart Buy / Smart Sell
⚠️ Avoid over-trading
🥉 INDIAN MARKET OPEN (LIMITED USE)
🕒 9:20 AM – 10:15 AM IST
✔ Use only if:
Dashboard = Trending
Volatility = Active
Direction same as higher TF
❌ Avoid after 10:30 AM
❌ SESSIONS TO AVOID (INDIA)
Session Time (IST) Reason
Tokyo 5:30 – 10:30 AM Sideways / fake moves
Mid-day Chop 11:00 – 12:15 PM Low volume
Late NY After 9:00 PM Whipsaws
📌 BEST DAILY ROUTINE (INDIA)
Time What to Do
9:15 – 9:20 ❌ No trade
9:20 – 10:15 ⚠️ Only clean Smart signals
12:30 – 4:30 ✅ MAIN TRADING WINDOW
6:00 – 8:30 ✅ HIGH PROBABILITY
After 9:00 ❌ Stop trading
🧠 EASY MEMORY RULE
“INDIA → LONDON → MONEY” 💰
“ASIA MIDDAY → NO TRADE” ❌
🎯 FINAL ANSWER (ONE-LINE)
👉 For India (IST), trade ONLY between
12:30 PM – 4:30 PM and 6:00 PM – 8:30 PM

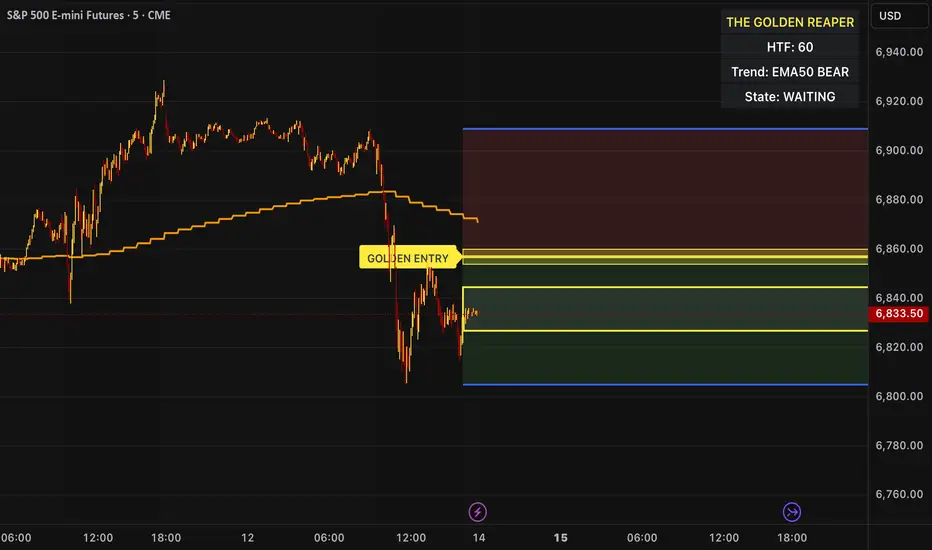
The Golden Reaper 🟡 THE GOLDEN REAPER
HTF OTE + EMA50 — Futures Scalping Framework
The Golden Reaper is a high-timeframe execution framework designed specifically for futures scalpers who trade with precision, patience, and structure.
This indicator focuses on HTF market structure, Optimal Trade Entry (OTE) zones, and equilibrium (50%) reclaim confirmation to identify high-probability execution areas for fast, controlled scalps.
It is not a signal spam tool.
It is a framework built for disciplined traders who wait for price to come to them.
⸻
🔑 Designed For
✔ Futures markets (ES, NQ, MNQ, MES, GC, MGC, CL, etc.)
✔ Scalpers & intraday traders
✔ 1H structure → 5m / 1m execution
✔ Traders who prefer few high-quality setups
⸻
🧠 Core Logic (How It Works)
1️⃣ High-Timeframe Structure (HTF)
The indicator identifies the most recent HTF swing high and low to define the active trading leg.
2️⃣ OTE Zone (Premium / Discount)
Price is expected to react within the OTE zone where liquidity is commonly targeted.
3️⃣ Golden Entry (EQ 50%)
The 50% equilibrium level is marked as the Golden Entry.
Price must reclaim this level for a setup to become valid.
4️⃣ Golden Execution Zone
After reclaim, a golden execution zone appears to define where entries are allowed.
5️⃣ EMA 50 Trend Filter
Trades are taken only in the direction of the HTF EMA 50 to avoid counter-trend scalps.
⸻
⚡ How Futures Scalpers Use It
Recommended Timeframes
• HTF Structure: 1 Hour
• Execution: 5 Minute / 1 Minute
Process
• Wait for price to reach the OTE zone
• Allow the setup to arm
• Enter only after price reclaims the Golden Entry
• Execute within the Golden Execution Zone
• Manage stops and targets manually
This approach helps scalpers:
✔ Avoid chasing price
✔ Reduce over-trading
✔ Improve entry precision
✔ Maintain consistency
⸻
🔔 Alerts Included
• OTE Touched – Setup is armed
• C-Reclaim Confirmed – Entry condition met
(Alerts are designed to assist — not replace — trader judgment.)
⸻
⚠️ Important Notes
• Designed for futures markets only
• Best used with price action confirmation
• No built-in stop loss or take profit (manual risk management required)
• Not financial advice
⸻
🧬 Who This Indicator Is For
✔ Futures scalpers
✔ ICT / Smart Money traders
✔ Structure-based traders
✔ Traders who value patience over frequency
❌ Not for:
• Signal chasers
• Indicator stacking
• Automated trading
• Beginners who want instant entries
⸻
🟡 Created By
ChartReaper / Tactiko
Instagram:
@officialchartreaper
@tactiko
Mxwll Price Action Suite [Mxwll]Introducing the Mxwll Price Action Suite!
The Mxwll Price Action Suite is an all-in-one analysis indicator incorporating elements of SMC and also ideas extending beyond the trading methodology!
Features
Internal structures
External structures
Customizable Sensitivities
BoS/CHoCH
Order Blocks
HH/LH/LL/LH Areas
Rolling TF highs/lows
Rolling Volume Comparisons
Auto Fibs
And more!
The image above shows the indicator's market structure identification capabilities. Internal BoS and CHoCH structures in addition to overarching market structures are available with customizable sensitivities.
The image above shows the indicator identifying order blocks! Additionally, HH/LH/LL/LH areas are also identified.
The image above shows a rolling area of interest. These areas can be compared to supply/demand zones, where traders might consider a bargain long/short/sell area.
The indicator displays a rolling 4hr high/low and 1D high/low, alongside auto fibonacci levels with a customizable sensitivity.
Finally, the Mxwll Price Action Suite shows relevant session information.
Table information
Current Session
Countdown to session close
Next Session
Countdown to next session open
Rolling 4-Hr volume intensity
Rolling 24-Hr volume intensity
Introducing the Mxwll SMC Suite!
The Mxwll SMC Suite is an all-in-one analysis indicator incorporating elements of SMC and also ideas extending beyond the trading methodology!
Features
Internal structures
External structures
Customizable Sensitivities
BoS/CHoCH
Order Blocks
HH/LH/LL/LH Areas
Rolling TF highs/lows
Rolling Volume Comparisons
Auto Fibs
And more!
The image above shows the indicator's market structure identification capabilities. Internal BoS and CHoCH structures in addition to overarching market structures are available with customizable sensitivities.
The image above shows the indicator identifying order blocks! Additionally, HH/LH/LL/LH areas are also identified.
The image above shows a rolling area of interest. These areas can be compared to supply/demand zones, where traders might consider a bargain long/short/sell area.
The indicator displays a rolling 4hr high/low and 1D high/low, alongside auto fibonacci levels with a customizable sensitivity.
Finally, the Mxwll Price Action Suite shows relevant session information.
Table information
Current Session
Countdown to session close
Next Session
Countdown to next session open
Rolling 4-Hr volume intensity
Rolling 24-Hr volume intensity
Expanded Features of Mxwll Price Action Suite
Internal and External Structures
Internal Structures: These elements refer to the price formations and patterns that occur within a smaller scope or a specific trading session. The suite can detect intricate details like minor support/resistance levels or short-term trend reversals.
External Structures: These involve larger, more significant market patterns and trends spanning multiple sessions or time frames. This capability helps traders understand overarching market directions.
Customizable Sensitivities
Adjusting sensitivity settings allows users to tailor the indicator's responsiveness to market changes. Higher sensitivity can catch smaller fluctuations, while lower sensitivity might focus on more significant, reliable market moves.
Break of Structure (BoS) and Change of Character (CHoCH)
BoS: This feature identifies points where the price breaks a significant structure, potentially indicating a new trend or a trend reversal.
CHoCH: Detects subtle shifts in the market's behavior, which could suggest the early stages of a trend change before they become apparent to the broader market.
Order Blocks and Market Phases
Order Blocks: These are essentially price levels or zones where significant trading activities previously occurred, likely pointing to the positions of smart money.
HH/LH/LL/LH Areas: Identifying Higher Highs (HH), Lower Highs (LH), Lower Lows (LL), and Lower Highs (LH) helps in understanding the trend and market structure, aiding in predictive analysis.
Rolling Timeframe Highs/Lows and Volume Comparisons
Tracks highs and lows over specified rolling periods, providing dynamic support and resistance levels.
Compares volume data across different timeframes to assess the strength or weakness of the current price movements.
Auto Fibonacci Levels
Automatically calculates and plots Fibonacci retracement levels, a popular tool among traders to identify potential reversal points based on past movements.
Session Data and Volume Intensity
Session Information: Displays current and upcoming trading sessions along with countdown timers, which is crucial for day traders and those trading on session overlaps.
Volume Intensity: Measures and compares the volume within the last 4 hours and 24 hours to gauge market activity and potential breakout/breakdown movements.
Visualizations and Practical Use
Dynamic Visuals: The suite provides dynamic visual aids, such as real-time updating of high/low markers and Fibonacci levels, which adjust as new data comes in. This feature is critical in fast-paced markets.
Strategic Entry/Exit Points: By identifying order blocks and using Fibonacci levels, traders can pinpoint strategic entry and exit points, maximizing potential returns.
Risk Management: Enhanced features like session countdowns and volume intensity help in better risk management by providing traders with more data on market sentiment and potential volatility.

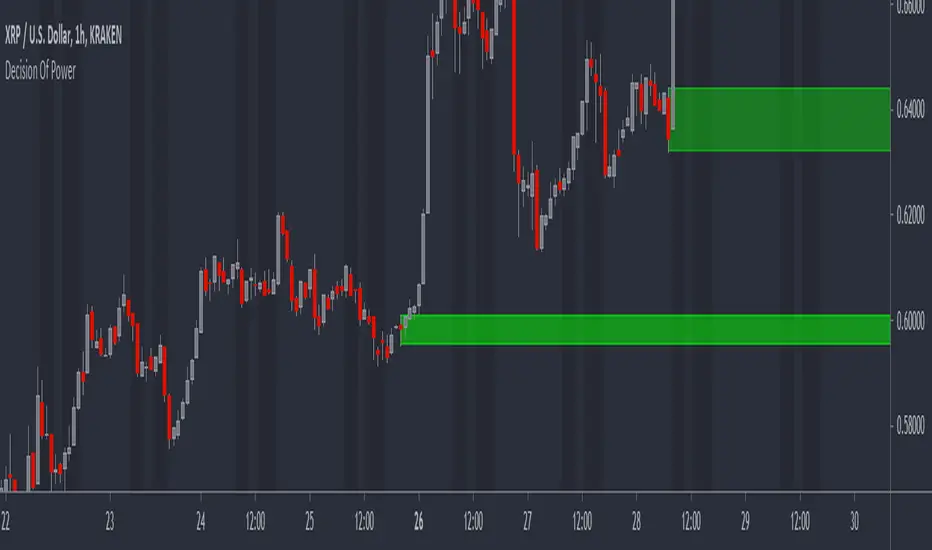
DOP - Load-Level Identification & Setup Assistant (L.I.S.A)This toolkit is made up of more than 3+ innovative indicators that have been designed to assist people in trading smart-money concepts. Get access to a variety of trading tools & relevant data all within one indicator to create your own, smart-money trading strategy.
Catering To SMART-Money Trading Styles
Our toolkit works in any market & allows users to:
• Detect the trend of the market by displaying real-time changes in market structure.
• Detect institutional activity in the market by highlighting structural changes.
• Get automatic order block support and resistance levels in real-time to assist with order entry placement and target take profit levels.
• Timely removal of order blocks that have been run through to give a clear picture of current market structure.
How Does It Work?
The algorithm tracks key pivot points within market data and when these are broken by price movements it provides key information to the user such as when it broke structure, where it broke structure and what levels are now considered support and resistance.
Trend Bar Colouring
The trend bar colouring feature provides a clear visual indication of the market trend by colouring candles red or green depending on the last break in market structure.
Market Structure Breaks
Breaks in market structure are displayed with a single line between two candles, this indicates that there may have been a shift in market trend.
Order Block Levels
Once structure breaks it creates support and resistance levels which can help in trade entries and deciding on take profit targets; these are displayed in real-time with colour coded boxes at either the support or resistance levels. If a level has been broken it is automatically removed from the chart to give a clear representation of the current market state.
If you are using this script you acknowledge past performance is not necessarily indicative of future results and there are many more factors that go into being a profitable trader.
You can see the Author's instructions below to get instant-access to this indicator.
FXC Order Block Finder █ OVERVIEW
The FXC Order Bock Finder finds and draws institutional order blocks according to the Smart Money Concept. Order blocks are zones where institutions have most likely left some orders that need to be filled at a later point in time. In These order blocks or POIs can be used to either place limit orders or to look for instant entries as price comes to retest the zone. It works on all time frames but higher time frames tend to be more precise.
█ HOW DOES IT WORK?
The indicator waits for a break of structure (BOS) and then prints a zone if there's an engulfing pattern and an open imbalance. Basically it draws zones where a fake move followed by aggressive buying or selling happened and Imbalances were left open.
█ WHAT MAKES IT UNIQUE?
Apart from the fact that I haven’t found any indicator that is able to properly draw order blocks most indicators do re-paint which doesn’t make any sense in the case of the Smart Money Concept.
Furthermore does this indicator have settings that let’s you adjust how the order blocks are drawn. From wick to end of the imbalance or candle close to imbalance. Also you can set how many candles it takes into consideration for the imbalance in case the imbalance starts after the engulfing pattern has formed. And you can set how many candles have to checked to determine a BOS or an internal BOS by using fractal breaks.
█ HOW TO USE IT?
Either place sell limits at the lower end of the order block with SL slightly above the OB and buy limits at the upper end of the OB with SL slightly below the OB. Target a fixed Risk Reward Ratio or trade it to the next order block. By using multi time frame analysis you can determine the overall direction of the market and prevent low probability trades. Also worth mentioning is that order blocks that have been created during high volume sessions tend to result in way better trades than with order blocks that have been printed during the Asia session.
█ ADDITIONAL INFO
As soon as price retested an order block the order block is mitigated and therefore not valid anymore. Also order blocks that are too far back in time are less probable to deliver good trades. In general the win rate tends not to be too high using this method but more often than not there's a reaction as price taps into an order block and trades with high RRR are quite often. As always in trading, proper money management and risk management is key.
█ DISCLAIMER
This is not financial advice. The Indicator spots these zones according to the smart money concept . However there's absolutely no guarantee that a nice order blocks results in a good trade.
█ Examples

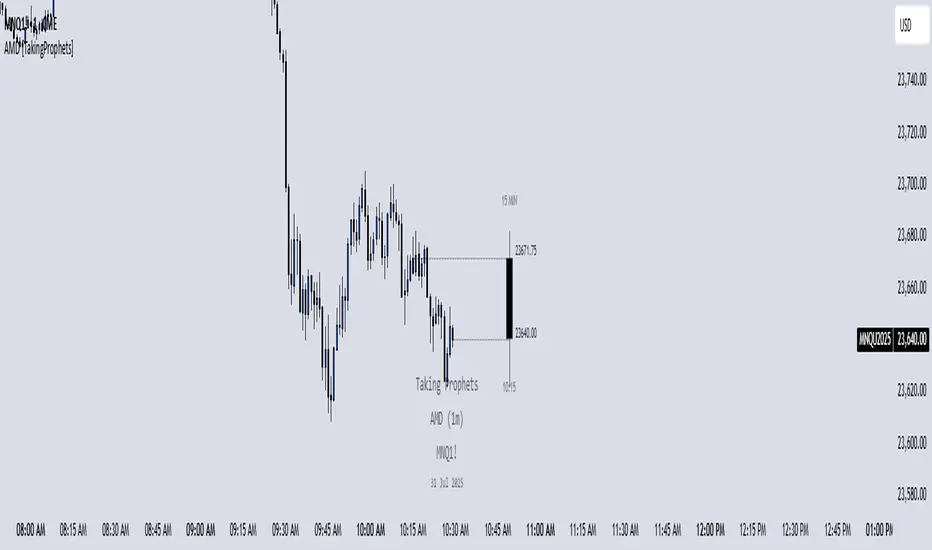
AMD [TakingProphets]Accumulation Manipulation Distribution – Real-Time HTF Candle Projection for ICT/SMC Traders
Accumulation Manipulation Distribution (AMD) is a premium, real-time indicator designed for traders who use ICT and Smart Money Concepts (SMC). It projects higher timeframe (HTF) candles directly onto your lower timeframe chart, allowing you to monitor institutional price behavior without switching timeframes.
By continuously tracking the open, high, low, and close (OHLC) of active HTF candles, AMD helps traders interpret whether the market is in a phase of accumulation, manipulation, or distribution—a key concept for understanding institutional order flow.
Core Features and How It Works
1. Live HTF Candle Visualization
Displays complete HTF candles — including body and wicks — in real time.
Provides immediate higher timeframe context for lower timeframe execution.
Supports any timeframe from 1 minute to monthly.
2. Real-Time OHLC Projections
Projects the open, high, low, and current close of the active HTF candle as it develops.
Acts as evolving reference points for support, resistance, and directional bias.
Fully customizable with adjustable colors, line styles, and labels.
3. Session Timing and Labeling
Optional time labels mark candle openings and help anticipate session closes.
Supports 12-hour and 24-hour formatting for flexibility across markets.
4. Complete Visual Customization
Configure candle width, wick transparency, border color, and projection lines.
Maintain a clean, professional overlay that aligns with your preferred charting style.
How to Use AMD
Determine HTF Bias: Identify whether the active candle is expanding in your trade direction or showing signs of rejection.
Track Price Reaction: Monitor how price interacts with projected HTF highs, lows, and midpoints—especially during ICT killzones or after liquidity events.
Anchor Lower Timeframe Entries: Combine AMD with tools like Order Blocks, Liquidity Levels, or Rejection Blocks to confirm high-probability Smart Money setups.
This approach allows traders to synchronize LTF executions with HTF market structure, enhancing clarity and confidence in trade selection.
SIP SmartlyIntroduction:
The SIP Smartly indicator is designed to mimic the behavior of a systematic investment plan, a popular investment strategy where a fixed quantity of an asset is purchased at regular intervals, typically monthly. In this case, we're applying this concept to trading by specifying a start date, a fixed purchase quantity, and certain conditions for buying.
Indicator Components:
User Inputs:
1. Start Date Inputs:
startyear, startmonth, startday: These inputs allow you to specify the year, month, and day when the SIP strategy begins.
2. buyQty:
This input allows you to specify the quantity of the security to purchase in each SIP installment.
What is Standard SIP ?
A Standard Systematic Investment Plan (SIP) is an investment strategy where individuals consistently invest a fixed amount of money at regular intervals, such as monthly or quarterly, in mutual funds or stocks. This approach promotes disciplined and long-term investing, taking advantage of rupee-cost averaging, where more shares are purchased when prices are low and fewer when prices are high. SIPs are designed for individuals seeking gradual wealth accumulation over time while mitigating the impact of market volatility through consistent, automated investments.
Logic of the Smart SIP Indicator:
Dynamic Quantity: The Smart SIP indicator allows you to invest a fixed quantity of a security at regular intervals based on technical analysis conditions. This is different from a standard SIP, where you typically invest a fixed amount of money.
Technical Analysis Driven: The Smart SIP indicator employs technical analysis indicators, such as multiple moving averages and uses the crossover of a higher MA with a lower MA which indicates a possible trend reversal, to determine Buy signals based on price trends. In contrast, a standard SIP doesn't consider technical factors but rather involves regular investments regardless of market conditions.
Adaptability: Unlike a standard SIP, which follows a predetermined investment schedule, the Smart SIP can adapt to changing market conditions. It triggers Buy actions only when specific technical conditions are met, providing a more flexible and responsive approach to investing or trading.
Market Value Tracking: The Smart SIP continuously tracks the market value of the invested quantity in real-time. This allows you to monitor the performance of your SIP investments dynamically, considering market fluctuations. In a standard SIP, you typically track the overall portfolio value without real-time adjustments.
Alert Notifications: The Smart SIP can send alert notifications when Buy conditions are met. This feature ensures timely execution of trades when favorable market conditions align with the technical criteria. In a standard SIP, you usually follow a fixed investment schedule without real-time alerting.
In summary, the unique logic of the Smart SIP indicator lies in its adaptability, technical analysis-driven approach, and real-time tracking and alerting features, making it well-suited for trading in financial markets while still following the concept of a systematic investment plan.
How to Use the SIP Smartly Indicator:
Start Date Selection:
Input your desired start date using the startyear, startmonth, and startday parameters. This is the date when your SIP strategy will begin.
Buy Quantity Setting:
Set the buyQty input to the quantity of the security you want to purchase in each SIP installment.
Alerts:
The indicator can trigger alerts when Buy conditions are met. These alerts can be configured to notify you when it's time to make a SIP installment.
Risk Management and Considerations:
Confirmation: While the SIP Smartly indicator provides insights, use it alongside other technical and fundamental analysis tools for confirmation before making trading decisions.
Backtesting: Before using this indicator in live trading, conduct thorough backtesting on historical data to evaluate its performance under different market conditions.
Position Sizing: Determine your position size and risk management rules based on the quantity purchased in each SIP installment.
Market Awareness: Stay informed about market conditions and news events that could impact price movements. This indicator is a tool to aid your trading strategy, not a standalone solution.
Conclusion:
The SIP Smartly Indicator offers a systematic approach to trading by simulating a SIP strategy. By inputting your start date and desired buy quantity, you can follow a disciplined investment approach in your trading. Remember to customize the inputs to match your trading preferences and risk tolerance.
Disclaimer: This indicator is provided for educational purposes and should be used with caution. Trading involves risks, and you should thoroughly test any strategy before applying it in live trading.
