Smart Money Setup 06 [TradingFinder] Liquidity Sweeps + OB Swing🔵 Introduction
Smart Money, managed by large investors, injects significant capital into financial markets by entering real capital markets.
Capital entering the market by this group of individuals is called smart money. Traders can profit from financial markets by following such individuals.
Therefore, smart money can be considered one of the effective methods for analyzing financial markets.
Sometimes, before a market movement, fluctuation movements that create price movement cause many traders' "Stop Loss" to be triggered. These movements are created in various patterns.
One of these patterns is similar to an "Expanding Triangle", which touches the stop loss of individuals who have placed their stop loss in the cash area in the form of 5 consecutive openings.
To better understand this setup, pay attention to the images below.
Bullish Setup Details :
Bearish Setup Details :
🔵 How to Use
After adding the indicator to the chart, wait for trading opportunities to appear. By changing the "Time Frame" and "Pivot Period", you can see different trading positions.
In general, the smaller the "Time Frame" and "Pivot Period", the more likely trading opportunities will appear.
Bullish Setup Details on Chart :
Bearish Setup Details on Chart :
🔵 Settings
You have access to "Pivot Period", "Order Block Refine", and "Refine Mode" through settings.
By changing the "Pivot Period", you can change the range of zigzag that identifies the setup.
Through "Order Block Refine", you can specify whether you want to refine the width of the order blocks or not. It is set to "On" by default.
Through "Refine Mode", you can specify how to improve order blocks.
If you are "risk-averse", you should set it to "Defensive" mode because in this mode, the width of the order blocks decreases, the number of your trades decreases, and the "reward-to-risk ratio "increases.
If you are on the opposite side and are "risk-taker", you can set it to "Aggressive" mode. In this mode, the width of the order blocks increases, and the likelihood of losing positions decreases.
Cari dalam skrip untuk "smart"

Smart Money Setup 01 [TradingFinder]Double Order Blocks Proof🔵 Introduction
The Price Action, styled as the "Smart Money Concept" or "SMC," was introduced by Mr. David J. Crouch in 2000 and is one of the most modern technical styles in the financial world. In financial markets, Smart Money refers to capital controlled by major market players (central banks, funds, etc.), and these traders can accurately predict market trends and achieve the highest profits.
In the "Smart Money" style, various types of "order blocks" can be traded. This indicator uses a type of "order block" originating from "BoS" (Breakout of Structure). The most important feature of this indicator is the confirmation of two order blocks.
🟣 Important
For example, after the first "BoS" and the formation of the first Order Block, if a second "BoS" occurs before touching the price of the first Order Block and the formation of the second Order Block, a trading setup with 2 order blocks is formed, which confirms the dominant market trend.
For a better understanding of this subject, see the explanations in the following two images.
Bullish Setup Details :
Bearish Setup Details :
🔵 How to Use
After adding the indicator to the chart, you should wait for the formation of the trading setup. You can observe different trading positions by changing the "Time Frame" and "Pivot Period." Generally, the higher the "Time Frame" and "Pivot Period," the more valid the formed setup is.
Bullish Setup Details on Chart :
Bearish Setup Details on Chart :
You can access the "Pivot Period" input through the settings.

Smart Money Concepts Premium (Expo)Are you a professional Smart Money Concept Trader?
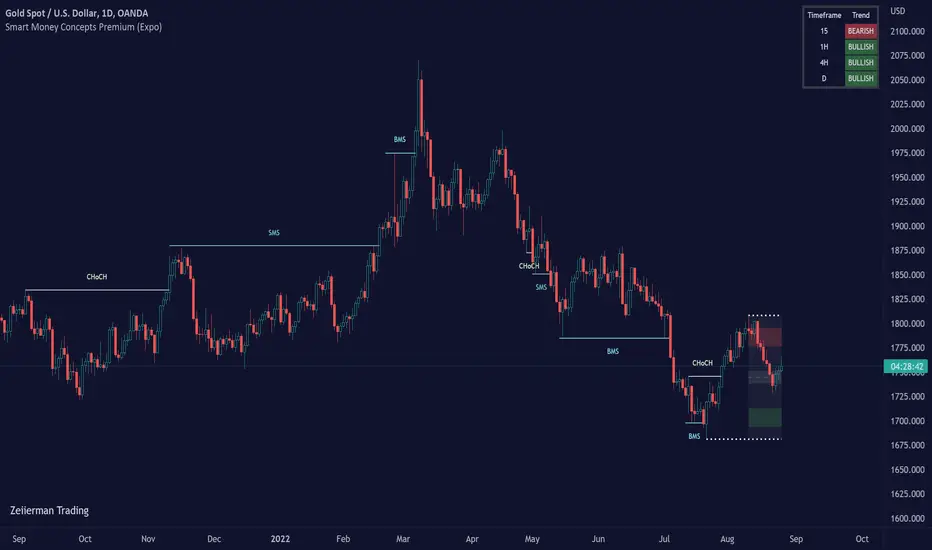
█ This premium version of our SMC indicator includes all advanced Smart Money Concept Trading techniques. The indicator includes all the important concepts such as Market Structure, Change of Character, Current Trading Range, Premium & Discount , Fractals, and Swing Structure. The indicator includes the popular SMC Market Structure Trend to help traders analyze the trend.
In addition to these features, this version adds the following:
Multitimeframe option
Predicted Structure and Range
Backtesting option
External Range Liquidity
Internal Range Liquidity
Liquidity Grab
Fair Value Gap (FVG)
True Fair Value Gap
Imbalance
Order block
Orderflow
Supply & Demand
Equal Highs and Equal Lows
Point of Interest
An alert function that allows you to set any combination of alerts.
This indicator aims to be an all-in-one SMC indicator that helps Smart Money Traders automate their analyzes.
█ HOW TO USE
Use the indicator to trade advanced SMC Trading techniques.
█ Settings
The indicator is fully customized and can be adjusted to fit Swing Trading, Trend Trading, Day Trading, or Scalping.
The indicator works in any market and timeframe.
-----------------
Disclaimer
Copyright by Zeiierman.
The information contained in my Scripts/Indicators/Ideas/Algos/Systems does not constitute financial advice or a solicitation to buy or sell any securities of any type. I will not accept liability for any loss or damage, including without limitation any loss of profit, which may arise directly or indirectly from the use of or reliance on such information.
All investments involve risk, and the past performance of a security, industry, sector, market, financial product, trading strategy, backtest, or individual's trading does not guarantee future results or returns. Investors are fully responsible for any investment decisions they make. Such decisions should be based solely on an evaluation of their financial circumstances, investment objectives, risk tolerance, and liquidity needs.
My Scripts/Indicators/Ideas/Algos/Systems are only for educational purposes!
Skrip berbayar
Smart Money Setup 02 [TradingFinder] Mitigated Major OB Proof🔵 Introduction
"Smart money" is money invested by knowledgeable individuals at the right time, and this investment can yield the highest returns.
The concept we focus on in this indicator is whether the market is in an uptrend or downtrend. The market briefly takes a weak and reversal trend with "Minor BoS" without being able to break the major pivot.
In the next step, it returns to its main trend with a strong bullish move and continues its trend with a "Major BoS". The "order block" behind this rapid and powerful movement can be a valid order block for trading.
To better understand this setup, please refer to the explanations in the two images below.
Bullish Setup Details :
Bearish Setup Details :
🔵 How to Use
After adding the indicator to the chart, you should wait for trading opportunities to form. By changing the "Time Frame" and "Period Pivot", you can see different trading positions. In general, the lower the "Time Frame" and "Period Pivot", the higher the likelihood of forming trading opportunities.
Bullish Setup Details on Chart :
Bearish Setup Details on Chart :
You can access "Period Pivot" via settings as an input.

QuantMotions - Smart Money BlocksSmart Money Blocks – Clean Edition is a minimalistic, high-precision Smart Money Concepts (SMC) tool designed for traders who want clean and reliable market structure signals without chart clutter.
This script detects and visualizes Order Blocks, Fair Value Gaps (FVGs), and Liquidity Levels using a strictly filtered, volume-based institutional logic.
Unlike many SMC indicators that overload the chart with noise, this version is built to stay fast, clean, and accurate — ideal for both scalpers and higher-timeframe traders.
🔍 Features
✔ Institutional Order Block Detection
• Identifies bullish and bearish order blocks
• Uses high-volume + price-displacement confirmation
• OBs extend forward and deactivate when broken
• Includes volume + tick range info-box
✔ Fair Value Gaps (FVG)
• Auto-detects bullish and bearish FVGs
• Marks imbalance zones until they are fully filled
• Clean, non-intrusive visualization
✔ Liquidity Levels
• Smart swing-high/swing-low liquidity detection
• Tracks touches to distinguish strong vs weak levels
• Marks support/resistance liquidity with labels only (no chart clutter)
⚙️ Clean & Minimal Design
This script is optimized for a clean workflow:
• No volume profile
• No BOS/CHOCH spam
• No unused SMC elements
• Only high-value SMC signals
• Clean color theme for dark charts
The goal is to provide only what matters, nothing more.
📈 Use Cases
• Smart Money / ICT style trading
• Scalping (1s – 1m)
• Intraday / London & New York session trading
• Swing trading
• Market structure analysis
• Liquidity and imbalance mapping
Whether you're identifying points of interest (POIs), building a bias, or mapping high-probability reaction zones — this tool helps you see structure clearly.
🔔 Alerts Included
• Order Block creation
• FVG creation
• Price touching an active Order Block
• Volume surge
• Institutional candle detection
• Structure break detection
Great for automation or bias confirmation.
🧠 Why This Script?
Many SMC indicators try to do everything — which often results in clutter, lag, and unreliable signals.
This edition focuses on precision, clarity, and real usability.
The logic is light, efficient, and suited for real-time execution on very fast charts.
📌 Note
This tool does not generate trade signals by itself.
It is designed as a market structure map for traders who already understand Smart Money principles such as:
• Displacement
• Imbalance
• Institutional candles
• OB mitigation
• Liquidity sweeps
Use it as part of your confluence system.

Smart Money Flow Index (SMFI) - Advanced SMC [PhenLabs]📊Smart Money Flow Index (SMFI)
Version: PineScript™v6
📌Description
The Smart Money Flow Index (SMFI) is an advanced Smart Money Concepts implementation that tracks institutional trading behavior through multi-dimensional analysis. This comprehensive indicator combines volume-validated Order Block detection, Fair Value Gap identification with auto-mitigation tracking, dynamic Liquidity Zone mapping, and Break of Structure/Change of Character detection into a unified system.
Unlike basic SMC indicators, SMFI employs a proprietary scoring algorithm that weighs five critical factors: Order Block strength (validated by volume), Fair Value Gap size and recency, proximity to Liquidity Zones, market structure alignment (BOS/CHoCH), and multi-timeframe confluence. This produces a Smart Money Score (0-100) where readings above 70 represent optimal institutional setup conditions.
🚀Points of Innovation
Volume-Validated Order Block Detection – Only displays Order Blocks when formation candle exceeds customizable volume multiplier (default 1.5x average), filtering weak zones and highlighting true institutional accumulation/distribution
Auto-Mitigation Tracking System – Fair Value Gaps and Order Blocks automatically update status when price mitigates them, with visual distinction between active and filled zones preventing trades on dead levels
Proprietary Smart Money Score Algorithm – Combines weighted factors (OB strength 25%, FVG proximity 20%, Liquidity 20%, Structure 20%, MTF 15%) into single 0-100 confidence rating updating in real-time
ATR-Based Adaptive Calculations – All distance measurements use 14-period Average True Range ensuring consistent function across any instrument, timeframe, or volatility regime without manual recalibration
Dynamic Age Filtering – Automatically removes liquidity levels and FVGs older than configurable thresholds preventing chart clutter while maintaining relevant levels
Multi-Timeframe Confluence Integration – Analyzes higher timeframe bias with customizable multipliers (2-10x) and incorporates HTF trend direction into Smart Money Score for institutional alignment
🔧Core Components
Order Block Engine – Detects institutional supply/demand zones using characteristic patterns (down-move-then-strong-up for bullish, up-move-then-strong-down for bearish) with minimum volume threshold validation, tracks mitigation when price closes through zones
Fair Value Gap Scanner – Identifies price imbalances where current candle's low/high leaves gap with two-candle-prior high/low, filters by minimum size percentage, monitors 50% fill for mitigation status
Liquidity Zone Mapper – Uses pivot high/low detection with configurable lookback to mark swing points where stop losses cluster, extends horizontal lines to visualize sweep targets, manages lifecycle through age-based removal
Market Structure Analyzer – Tracks pivot progression to identify trend through higher-highs/higher-lows (bullish) or lower-highs/lower-lows (bearish), detects Break of Structure and Change of Character for trend/reversal confirmation
Scoring Calculation Engine – Evaluates proximity to nearest Order Blocks using ATR-normalized distance, assesses FVG recency and distance, calculates liquidity proximity with age weighting, combines structure bias and MTF trend into smoothed final score
🔥Key Features
Customizable Display Limits – Control maximum Order Blocks (1-10), Liquidity Zones (1-10), and FVG age (10-200 bars) to maintain clean charts focused on most relevant institutional levels
Gradient Strength Visualization – All zones render with transparency-adjustable coloring where stronger/newer zones appear more solid and weaker/older zones fade progressively providing instant visual hierarchy
Educational Label System – Optional labels identify each zone type (Bullish OB, Bearish OB, Bullish FVG, Bearish FVG, BOS) with color-coded text helping traders learn SMC concepts through practical application
Real-Time Smart Money Score Dashboard – Top-right table displays current score (0-100) with color coding (green >70, yellow 30-70, red <30) plus trend arrow for at-a-glance confidence assessment
Comprehensive Alert Suite – Configurable notifications for Order Block formation, Fair Value Gap detection, Break of Structure events, Change of Character signals, and high Smart Money Score readings (>70)
Buy/Sell Signal Integration – Automatically plots triangle markers when Smart Money Score exceeds 70 with aligned market structure and fresh Order Block detection providing clear entry signals
🎨Visualization
Order Block Boxes – Shaded rectangles extend from formation bar spanning high-to-low of institutional candle, bullish zones in green, bearish in red, with customizable transparency (80-98%)
Fair Value Gap Zones – Rectangular areas marking imbalances, active FVGs display in bright colors with adjustable transparency, mitigated FVGs switch to gray preventing trades on filled zones
Liquidity Level Lines – Dashed horizontal lines extend from pivot creation points, swing highs in bearish color (short targets above), swing lows in bullish color (long targets below), opacity decreases with age
Structure Labels – "BOS" labels appear above/below price when Break of Structure confirmed, colored by direction (green bullish, red bearish), positioned at 1% beyond highs/lows for visibility
Educational Info Panel – Bottom-right table explains key terminology (OB, FVG, BOS, CHoCH) and score interpretation (>70 high probability) with semi-transparent background for readability
📖Usage Guidelines
General Settings
Show Order Blocks – Default: On, toggles visibility of institutional supply/demand zones, disable when focusing solely on FVGs or Liquidity
Show Fair Value Gaps – Default: On, controls FVG zone display including active and mitigated imbalances
Show Liquidity Zones – Default: On, manages liquidity line visibility, disable on lower timeframes to reduce clutter
Show Market Structure – Default: On, toggles BOS/CHoCH label display
Show Smart Money Score – Default: On, controls score dashboard visibility
Order Block Settings
OB Lookback Period – Default: 20, Range: 5-100, controls bars scanned for Order Block patterns, lower values detect recent activity, higher values find older blocks
Min Volume Multiplier – Default: 1.5, Range: 1.0-5.0, sets minimum volume threshold as multiple of 20-period average, higher values (2.0+) filter for strongest institutional candles
Max Order Blocks to Display – Default: 3, Range: 1-10, limits simultaneous Order Blocks shown, lower settings (1-3) maintain focus on most recent zones
Fair Value Gap Settings
Min FVG Size (%) – Default: 0.3, Range: 0.1-2.0, defines minimum gap size as percentage of close price, lower values detect micro-imbalances, higher values focus on significant gaps
Max FVG Age (bars) – Default: 50, Range: 10-200, removes FVGs older than specified bars, lower settings (10-30) for scalping, higher (100-200) for swing trading
Show FVG Mitigation – Default: On, displays filled FVGs in gray providing visual history, disable to show only active untouched imbalances
Liquidity Zone Settings
Liquidity Lookback – Default: 50, Range: 20-200, sets pivot detection period for swing highs/lows, lower values (20-50) mark shorter-term liquidity, higher (100-200) identify major swings
Max Liquidity Age (bars) – Default: 100, Range: 20-500, removes liquidity lines older than specified bars, adjust based on timeframe
Liquidity Sensitivity – Default: 0.5, Range: 0.1-1.0, controls pivot detection sensitivity, lower values mark only major swings, higher values identify minor swings
Max Liquidity Zones to Display – Default: 3, Range: 1-10, limits total liquidity levels shown maintaining chart clarity
Market Structure Settings
Pivot Length – Default: 5, Range: 3-15, defines bars to left/right for pivot validation, lower values (3-5) create sensitive structure breaks, higher (10-15) filter for major shifts
Min Structure Move (%) – Default: 1.0, Range: 0.1-5.0, sets minimum percentage move required between pivots to confirm structure change
Multi-Timeframe Settings
Enable MTF Analysis – Default: On, activates higher timeframe trend analysis incorporation into Smart Money Score
Higher Timeframe Multiplier – Default: 4, Range: 2-10, multiplies current timeframe to determine analysis timeframe (4x on 15min = 1hour)
Visual Settings
Bullish Color – Default: Green (#089981), sets color for bullish Order Blocks, FVGs, and structure elements
Bearish Color – Default: Red (#f23645), defines color for bearish elements
Neutral Color – Default: Gray (#787b86), controls color of mitigated zones and neutral elements
Show Educational Labels – Default: On, displays text labels on zones identifying type (OB, FVG, BOS), disable once familiar with patterns
Order Block Transparency – Default: 92, Range: 80-98, controls Order Block box transparency
FVG Transparency – Default: 92, Range: 80-98, sets Fair Value Gap zone transparency independently from Order Blocks
Alert Settings
Alert on Order Block Formation – Default: On, triggers notification when new volume-validated Order Block detected
Alert on FVG Formation – Default: On, sends alert when Fair Value Gap appears enabling quick response to imbalances
Alert on Break of Structure – Default: On, notifies when BOS or CHoCH confirmed
Alert on High Smart Money Score – Default: On, alerts when Smart Money Score crosses above 70 threshold indicating high-probability setup
✅Best Use Cases
Order Block Retest Entries – After Break of Structure, wait for price retrace into fresh bullish Order Block with Smart Money Score >70, enter long on zone reaction targeting next liquidity level
Fair Value Gap Retracement Trading – When price creates FVG during strong move then retraces, enter as price approaches unfilled gap expecting institutional orders to continue trend
Liquidity Sweep Reversals – Monitor price approaching swing high/low liquidity zones against prevailing Smart Money Score trend, after stop hunt sweep watch for rejection into premium Order Block/FVG
Multi-Timeframe Confluence Setups – Identify alignment when current timeframe Order Block coincides with higher timeframe FVG plus MTF analysis showing matching trend bias
Break of Structure Continuations – After BOS confirms trend direction, trade pullbacks to nearest Order Block or FVG in direction of structure break using Smart Money Score >70 as entry filter
Change of Character Reversal Plays – When CHoCH detected indicating potential reversal, look for Smart Money Score pivot with opposing Order Block formation then enter on structure confirmation
⚠️Limitations
Lagging Pivot Calculations – Pivot-based features (Liquidity Zones, Market Structure) require bars to right of pivot for confirmation, meaning these elements identify levels retrospectively with delay equal to lookback period
Whipsaw in Ranging Markets – During choppy conditions, Order Blocks fail frequently and structure breaks produce false signals as Smart Money Score fluctuates without clear institutional bias, best used in trending markets
Volume Data Dependency – Order Block volume validation requires accurate volume data which may be incomplete on Forex pairs or limited in crypto exchange feeds
Subjectivity in Scoring Weights – Proprietary 25-20-20-20-15 weighting reflects general institutional behavior but may not optimize for specific instruments or market regimes, user cannot adjust factor weights
Visual Complexity on Lower Timeframes – Sub-hour timeframes generate excessive zones creating cluttered charts, requires aggressive display limit reduction and higher minimum thresholds
No Fundamental Integration – Indicator analyzes purely technical price action and volume without incorporating economic events, news catalysts, or fundamental shifts that override technical levels
💡What Makes This Unique
Unified SMC Ecosystem – Unlike indicators displaying Order Blocks OR FVGs OR Liquidity separately, SMFI combines all three institutional concepts plus market structure into single cohesive system
Proprietary Confidence Scoring – Rather than manual setup assessment, automated Smart Money Score quantifies probability by weighting five institutional dimensions into actionable 0-100 rating
Volume-Filtered Quality – Eliminates weak Order Blocks forming without institutional volume confirmation, ensuring displayed zones represent genuine accumulation/distribution
Adaptive Lifecycle Management – Automatically updates mitigation status and removes aged zones preventing trades on dead levels through continuous validity and age monitoring
Educational Integration – Built-in tooltips, labeled zones, and reference panel make indicator functional for both learning Smart Money Concepts and executing strategies
🔬How It Works
Order Block Detection – Scans for patterns where strong directional move follows counter-move creating last down-candle before rally (bullish OB) or last up-candle before sell-off (bearish OB), validates formations only when candle exhibits volume exceeding configurable multiple (default 1.5x) of 20-bar average volume
Fair Value Gap Identification – Compares current candle’s high/low against two-candles-prior low/high to detect price imbalances, calculates gap size as percentage of close and filters micro-gaps below minimum threshold (default 0.3%), monitors whether subsequent price fills 50% triggering mitigation status
Liquidity Zone Mapping – Employs pivot detection using configurable lookback (default 50 bars) to identify swing highs/lows where retail stops cluster, extends horizontal reference lines from pivot creation and applies age-based filtering to remove stale zones
Market Structure Analysis – Tracks pivot progression using structure-specific lookback (default 5 bars) to determine trend, confirms uptrend when new pivot high exceeds previous by minimum move percentage, detects Break of Structure when price breaks recent pivot level, flags Change of Character for potential reversals
Multi-Timeframe Confluence – When enabled, requests security data from higher timeframe (current TF × HTF multiplier, default 4x), compares HTF close against HTF 20-period MA to determine bias, contributes ±50 points to score ensuring alignment with institutional positioning on superior timeframe
Smart Money Score Calculation – Evaluates Order Block component via ATR-normalized distance producing max 100-point contribution weighted at 25%, assesses FVG factor through age penalty and distance at 20% weight, calculates Liquidity proximity at 20%, incorporates structure bias (±50-100 points) at 20%, adds MTF component at 15%, applies 3-period smoothing to reduce volatility
Visual Rendering and Lifecycle – Draws Order Block boxes, Fair Value Gap rectangles with color coding (green/red active, gray mitigated), extends liquidity dashed lines with fade-by-age opacity, plots BOS labels, displays Smart Money Score dashboard, continuously updates checking mitigation conditions and removing elements exceeding age/display limits
💡Note:
The Smart Money Flow Index combines multiple Smart Money Concepts into unified institutional order flow analysis. For optimal results, use the Smart Money Score as confluence filter rather than standalone entry signal – scores above 70 indicate high-probability setups but should be combined with risk management, higher timeframe bias, and market regime understanding.

Smart Auto Levels Renko Pro $ [ #Algo ] ( Fx, Alt, Crypto ) : Smart Levels is Smart Trades 🏆
"Smart Auto Levels Renko Pro $ ( Fx, Alt, Crypto ) " indicator is specially designed for " Crypto, Altcoins, Forex pairs, and US exchange" . It gives more power to day traders, pull-back / reverse trend traders / scalpers & trend analysts. This indicator plots the key smart levels , which will be automatically drawn at the session's start or during the session, if specific input is selected.
🔶 Usage and Settings :
A :
⇓ ( *refer 📷 image ) ⇓
B :
⇓ ( *refer 📷 images ) ⇓
🔷 Features :
a : automated smart levels with #algo compatibility.
b : plots Trend strength ▲, and current candle strength count value label.
c : ▄▀ RENKO Emulator engine ( plots *Non-repaintable #renko data as a line chart over the standard chart).
d : session 1st candle's High, Low & 50% levels ( irrespective of chart time-frame ).
e : 1-hour High & Low levels of specific candle ( from the drop-down menu ), for any global
market crypto / altcoins / forex or USA exchange symbols.
f : previous Day / Week / Month, chart High & Low.
g : pivot point levels of the Daily, Weekly & Monthly charts.
h : 2 class types of ⏰ alerts ( only signals or #algo execution ).
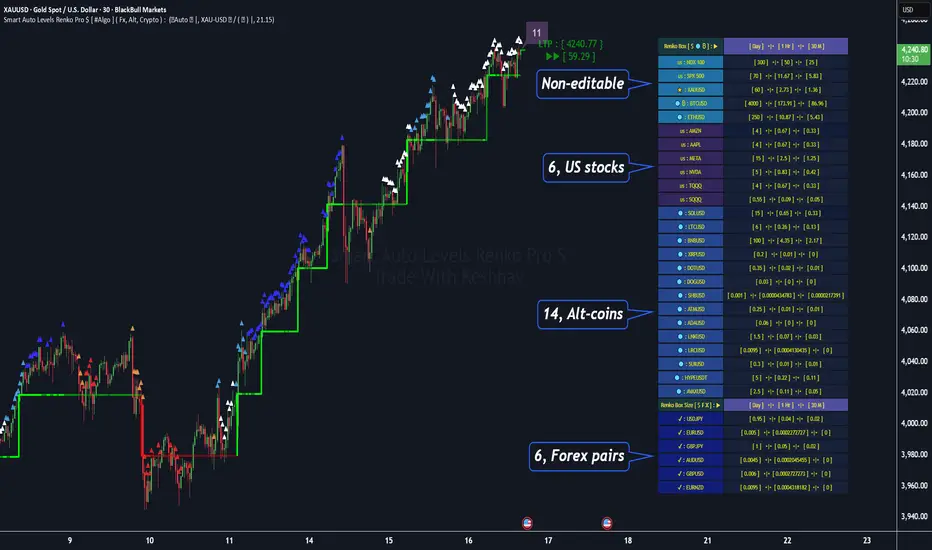
i : auto RENKO box size (ATR-based) table for 31 symbols (5 Default non-editable symbols,
6 US exchange symbols, 14 Alt-coins, 6 Forex pairs.)
j : auto processes " daylight saving time 🌓" data and plots accordingly.
💠Note: "For key smart levels, it processes data from a customized time frame, which is not available for the *free Trading View subscription users , and requires a premium plan." By this indicator, you have an edge over the paid subscription plan users and can automatically plot the Non-repaintable RENKO emulator for the current chart on the Trading View free Plan for any time-frame ."
⬇ Take a deep dive 👁️🗨️ into the Smart levels trading Basic Demonstration ⬇
▄▀ 1: "RENKO Emulator Engine" ⭐ , plots a noiseless chart for easy Top/Bottom set-up analysis. 11 types of 💼 asset classes options available in the drop-down menu.
LTP is tagged to the current RSI value ➕ volatility color change for instant quick decisions.
⇓ ( *refer 📷 image ) ⇓
🟣 2: "Trend Strength ▲ Label with color condition.
The strength of the trend will be shown as a number label ( for the current candle ), and the ▲ color format represents the strength of the trend. Can be utilized as an Entry or Exit condition.
⇓ ( *refer 📷 image ) ⇓
🟠 3: plots "Session first candle High, low, and 50%" levels ( irrespective of chart time-frame ), which are critical levels for an intraday trader with add-on levels of Previous Day, Week & Month High and Low levels.
⇓ ( *refer 📷 image ) ⇓
🔵 4: plots "Hourly chart candle" High & Low levels for the specific candles, selected from the drop-down menu with Pivot Points levels of Daily, Weekly, Monthly chart.
⇓ ( *refer 📷 image ) ⇓
🔲 5: "Auto RENKO box size" ( ATR based ) : This indicator is specially designed for 'Renko' trading enthusiasts, where the Box size of the ' Renko chart ' for intraday or swing trading ( ATR based ) , automatically calculated for the selected ( editable ) symbols in the table.
⇓ ( *refer 📷 image ) ⇓
*NOTE :
Table symbols (Non-editable) for 2 USA index, XAU, BTC, ETH.
Symbols (editable) for USA index/stocks.
Table Symbols (editable) for alt-coins.
Table Symbols (editable) for Forex pairs.
⏰ 6: "Alert functions."
⇓ ( *refer 📷 image ) ⇓
◻ : Total 7 signal alerts can be possible in a Single alert.
◻ : Total 10 #algo alerts , ( must ✔ tick the Consent check box for algo execution ).
Note: : alert with RSI ( *manual ✍ input value ) condition.
After selecting alert/alerts ( signals 7 / #algo 10 ), an additional RSI condition can also be used as an input to trigger the alert.
ex: alert = { 🟠 𝟭 Hr 🕯 H & L ➕ ✅ RSI✍ } condition, will trigger the alert when both conditions meet simultaneously.
This Indicator will work like a Trading System . It is different from other indicators, which give Signals only. This script is designed to be tailored to your personal trading style by combining user input components to create your own comprehensive strategy . The synergy between the components is key to its usefulness.
🚀 It focuses on the key Smart Levels and gives you an Extra edge over others.
✅ HOW TO GET ACCESS :
You can see the Author's instructions below to get instant access to this indicator & our premium indicator suites. If you like any of my Invite-Only indicators, kindly DM and let me know!
⚠ RISK DISCLAIMER :
All content provided by "@TradeWithKeshhav" is for informational & educational purposes only.
It does not constitute any financial advice or a solicitation to buy or sell any securities of any type. All investments / trading involve risks. Past performance does not guarantee future results / returns.
Regards :
Team @TradeWithKeshhav
Happy trading and investing!
Smart Money Techniques (SMT) Divergence by RiseSmart Money Divergence - Early Reversal Indicator
This sophisticated indicator identifies and analyzes Smart Money Divergence patterns by systematically examining pivot point relationships between a primary asset and a secondary correlated instrument.
The indicator establishes divergence signals through precise algorithmic detection when pivot pairs exhibit opposing directional patterns between the primary and secondary assets. This sophisticated analysis reveals institutional positioning discrepancies that often precede significant market reversals.
Following divergence confirmation, the indicator provides comprehensive visualization tools and optional alert systems to capitalize on these high-probability trading opportunities. Advanced filtering capabilities allow traders to customize sensitivity levels, timeframe parameters, and styling to align with their specific trading methodology.
This powerful solution delivers unmatched functionality for traders seeking to identify and exploit Smart Money positioning through multi-asset divergence analysis. With its robust detection algorithms and granular customization options, it provides capabilities that surpass conventional divergence indicators by incorporating institutional flow analysis principles highly regarded in professional trading circles.
What is Smart Money Divergence?
Smart Money Divergence is another name for Smart Money Techniques (SMT). These patterns appear when comparing swing points, of adjustable strength, between correlated assets...
When an asset makes a higher high while the other makes a lower high.
When an asset makes a lower low while the other makes a higher low.
Potential Divergence
This indicator allows users to see potential SMT before the second swing point of the pair forms. It is showcased with different styling until it's confirmation, when enough bars pass based on the user-defined strength parameter.
Multi-Timeframe
Our tool allows traders to have higher/lower-timeframe divergences displayed on the chart of their choice, further automating their trading strategies.
Input Settings:
This tool offers a lot of customizable options, which could be overwhelming to some users. Below you will find an in-depth definition of every input's purpose to complement the tooltips that can be found directly in the indicator's settings.
Symbol 📊
This parameter let's users define the asset used in search of SMT divergence. We recommend using correlated assets, like NASDAQ100 with S&P500 or EURUSD with GBPUSD...
Timeframe 🔧
This is where users choose, if they wish, to set a different timeframe which will be utilized when looking for divergences.
Mode ⚙️
Default -> Displays all SMTs.
Bullish -> Displays only bullish SMTs using low pivots.
Bearish -> Displays only bearish SMTs using high pivots.
Historical 📜
This indicator allows users to display only a specific amount of SMTs... The historical input will display the specified amount of divergences up to 25, which will then showcase all available SMTs.
Parameters
This section defines the main parameters uses in establishing and managing SMT divergences.
Pivot Strength -> Number of bars to the left and right for pivot considerations.
Pivot Lookback -> Amount of past pivots to maintain in memory.
Allow Time Difference? -> Allow up to one bar difference when comparing pivots.
Time Filters -> The indicator allows for up to two time filters...
Checkbox -> Activate this time filter.
Time Range-> Define the time range which will only validate SMTs during.
Remove After Invalidation? -> Remove drawings from invalidated SMTs.
Style
Colors for bullish and bearish SMTs respectively.
Line styling and width
Potential Divergence -> checkbox and line styling.
Text
Label Contents :
Long -> "Smart Money Divergence"
Short -> "SMT"
None -> No text.
Include Symbol? -> Include the comparing asset's symbol within label text.
Size .
Font (Default or Monospace) and Format (None, Italic or Bold).
Align -> vertical and horizontal positioning.
This indicator is for educational and informational purposes only. Past performance and historical patterns do not guarantee future results. Trading involves substantial risk of loss and is not suitable for all investors. Always conduct your own analysis and consider your financial situation before making any trading decisions. The identification of patterns does not constitute trading advice.

Smart Money Interest Index [AlgoAlpha]🌟 Smart Money Interest Index by AlgoAlpha 🌟
Welcome to the innovative Smart Money Interest Index indicator, designed meticulously by AlgoAlpha to revolutionize the way you trade! 📈🧠 This indicator is engineered to decipher the activities of smart money investors relative to the less informed (dumb money) and dynamically display their dominance in the trading landscape through a sophisticated visual index. 🚀💹
🔑 Key Features:
- Smart vs. Dumb Money Analysis: Tracks and compares the movements of smart money (informed investors) and dumb money (general public) within the market to identify potential investment signals.
- Relative Strength Index (RSI) Based Ratios: Utilizes RSI for both smart and dumb money to create a ratio that indicates buying or selling pressures.
- Dynamic Normalization: Employs a long-term peak normalization over a customizable period to ensure the index remains relevant regardless of market conditions.
- Visual Thresholds and Signals: Highlights significant shifts in market dynamics with color-coded thresholds, making it easier to spot changes at a glance.
🛠 How to Use the Smart Money Interest Index:
🔹 🚀 Step 1: Adding the Indicator
- Add the indicator to your favourites.
- Customize the settings according to your analysis needs:
- `Index Period`, `Volume Flow Period`, `Normalization Period`, `High Interest Threshold`
🔹 📊 Step 2: Interpretation of the Index
- Monitor the index plot; a rising index suggests increasing smart money interest, potentially indicating a buying opportunity.
- A value above the high interest threshold (in yellow) highlights significant interest by smart money, suggesting a good time to buy.
🔹 🔔 Step 3: Setting Alerts
- Configure alerts to notify you when the index crosses above the set threshold, enabling you to capitalize on trading opportunities timely and efficiently.
📐 Basic Logic Overview:
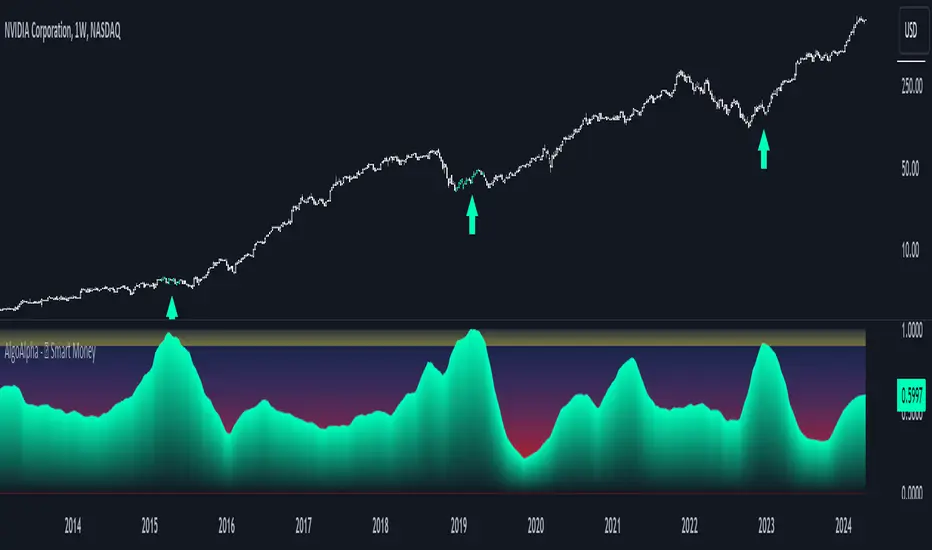
The Smart Money Interest Index by AlgoAlpha provides a unique metric that contrasts the investment behaviors of informed (smart money) and general (dumb money) investors. Utilizing the Relative Strength Index (RSI), this indicator evaluates the trading pressure exerted by both groups over specified periods, then forms a ratio of these activities to identify dominance in buying or selling trends. For example, when we see dumb money selling and smart buying, this suggests that the conditions for buying the asset is optimal as smart money is willing to buy the dip. The outputs are normalized against the highest values observed in a user-defined term to maintain consistency through varying market conditions. When the index exceeds a certain threshold, it suggests that smart money presence is particularly strong, possibly indicating that smart money is looking to enter positions on the asset. This tool serves as a sophisticated visual guide to understanding market dynamics and making well-informed trading decisions based on the activities of market-savvy investors. Smart money activity is identified during areas of low volume and the opposite for dumb money, the indicator uses the NVI and PVI metrics as its foundation for smart and dumb money analysis.
📊 Enhance Your Trading Strategy:
Leverage the Smart Money Interest Index to gain deeper insights into market dynamics and enhance your decision-making process with a powerful, data-driven approach. Whether you're looking to identify entry points or set strategic exits, this tool is designed to provide you with the competitive edge you need in the fast-paced world of trading. 🌐✨
Transform your trading with the power of smart money analysis—start using the Smart Money Interest Index today! 🚀🔔
Smart Money Toolkit - PD Engine Bias Map [KedArc Quant]Description
Smart Money is an advanced multi-layer Smart Money Concepts framework that automatically detects structure shifts, premium-discount zones, and institutional order flow.
It is built around the PD Engine, which calculates the midpoint of the most recent market swing and dynamically determines BUY or SELL bias based on where current price trades relative to that equilibrium. This toolkit visualizes structure, order blocks, and bias context in one clean map, giving traders an institutional-grade view without unnecessary signal clutter.
Why It Is Unique
- All CHoCH, BOS, Order Block, FVG, and PD logic are coded from scratch.
- Uses true equilibrium (50 percent PD midpoint) for dynamic bias.
- Optimized for stability and non-repainting behavior.
- Designed for clarity with minimal, performance-safe visuals.
Entry and Exit Logic (Discretionary Framework)
- This toolkit is not a signal generator. It provides market context that guides discretionary trading.
BUY Bias (Discount Zone)
- Price trades below PD Mid: the market is in discount.
- Wait for a bullish CHoCH or reaction from a demand OB or FVG before buying.
- Target 1 = PD Mid. Target 2 = next opposite OB or FVG.
SELL Bias (Premium Zone)
- Price trades above PD Mid: the market is in premium.
- Wait for a bearish CHoCH or reaction from a supply OB or FVG before shorting.
- Target 1 = PD Mid. Target 2 = next opposite OB or FVG.
Institutional concept sequence: Bias → Structure Shift → Confirmation → Execution.
Input Configuration
Swing Sensitivity - Determines how far back to identify HH and LL pivots.
OB / FVG Detection - Toggles visual Order Block or Fair Value Gap zones.
PD Engine - Shows PD midpoint line, zone shading, and bias table.
Multi-TF Bias Sync - Optionally reads a higher timeframe bias for confirmation.
Color Themes - Switch between light, dark, or institutional palettes.
Formula / Logic Summary
Concept Formula
PD Mid (Equilibrium) (Recent Swing High + Recent Swing Low) / 2
BUY Bias close < PD Mid
SELL Bias close > PD Mid
CHoCH / BOS Pivot-based structure reversal: HH→LL or LL→HH
Order Block Last bullish or bearish candle before displacement.
FVG Gap between prior candle high/low and next candle range.
These formulas follow the structure used in institutional Smart Money Concepts.
How It Helps Traders
- Shows institutional premium and discount zones visually.
- Defines clear directional bias before entry.
- Combines structure, order blocks, FVG, and equilibrium in one layout.
- Works on any timeframe or asset.
- Prevents emotional trades by giving objective bias context.
Glossary
PD Mid Midpoint between recent swing high and low (market fair value).
Premium Zone Price above PD Mid; sellers control.
Discount Zone Price below PD Mid; buyers control.
CHoCH Change of Character, first reversal signal.
BOS Break of Structure, trend continuation confirmation.
OB Order Block, last institutional candle before move.
FVG Fair Value Gap, price imbalance often revisited.
FAQ
Q: Is this a signal indicator?
A: No. It is a contextual framework that supports manual decision-making.
Q: Does it repaint?
A: No. All structure logic is confirmed on bar close.
Q: Does it work on all markets?
A: Yes. It is purely price-based and timeframe independent.
Q: When does bias change?
A: Only after a new confirmed swing high or low.
Q: Can it be backtested?
A: You can build strategies on top of this context using your own entry and exit rules.
Disclaimer
This script is provided for educational purposes only.
It is not financial advice.
Trading carries risk. Past performance does not guarantee future results.
Use proper risk management and test on demo accounts before applying to live markets.

Smart Moving Average Dynamics [ChartNation]Smart Moving Average Dynamics (SMAD) — by Chart Nation
What it does:
SMAD maps how far price deviates from a chosen moving average and normalizes that distance into a bounded oscillator (−100…+100). It detects extreme expansions and prints non-repainting dots when the move exits an extreme. Price-level rails are drawn from those events (with optional fade/expiry) to highlight likely reaction zones. The MA line is colored by bias. A slim gauge summarizes the current oscillator percentile; a compact info panel shows TF, Trend, Volume rank, and Volatility rank.
How it works (high-level, closed-source)
Core signal: diff = price – MA(type, length) where MA can be SMA/EMA/RMA/WMA/VWMA.
Normalization (choose one):
Highest Abs (N): scales diff by the highest absolute excursion over N bars (fast, adaptive).
Z-Score: scales by stdev(diff, N) and maps ±σ to ±100 via a user factor.
ATR-Scaled: scales by ATR * k, relating deviation to current volatility.
Percent Rank: ranks the magnitude of |diff| over N bars and reapplies the original sign.
All methods clamp to −100…+100 to keep visuals consistent across assets/TFs.
Extremes & confirmation: Dots print only when an extreme exits ±100 (optionally on bar close) and can be filtered by linger bars and short-term slope flip, reducing one-bar spikes.
Rails: When an extreme confirms, a rail is anchored at the corresponding price swing and can soft-fade and/or expire after X bars.
Trend color: MA color = Up (green) when oscillator > threshold and MA slope > 0; Down (magenta) for the opposite; Neutral otherwise.
Context panels:
Slim Gauge: current oscillator bucket (0–20) with the exact normalized reading.
Info Panel: TF, Trend, and 0–100 percent-ranks of Volume and ATR-based volatility grouped as Low / Medium / High.
SMAD isn’t a collection of plots; it’s a single framework that integrates:
a deviation-from-MA engine,
four interchangeable normalization models (selected per market regime),
a gated extreme detector (linger + slope + confirm-on-close), and
time-aware rails with soft fade/expiry, presented with a minimal gauge and info panel so traders can compare regimes across TFs without recalibrating thresholds.
How to use (examples, not signals)
Mean-revert plays: When price exits an extreme and prints a dot, look for reactions near the new rail. Combine with your S/R and risk model.
Trend continuation: In strong trends the oscillator will spend more time above/below zero; the colored MA helps keep you aligned and avoid fading every push.
Regime switching: Try Percent Rank or ATR-Scaled on choppy/alts; Z-Score on majors; Highest Abs (N) when you want fastest adaptation.
Risk ideas: Rails can be used as partial-take or invalidate levels. Always backtest on your pair/TF.
Key settings
Normalization: Highest Abs / Z-Score / ATR-Scaled / Percent Rank (with N & factors).
Filters: Extreme threshold, linger bars, slope lookback, confirm on close.
Rails: Expire after X bars; soft-fade step.
Panels: Slim gauge (bottom-right), Info panel (middle-right).
Notes & limits
Prints confirm after the extreme exits ±100; nothing repaints retroactively.
Normalization can change sensitivity—choose the one matching your asset’s regime.

Smart Money Volume Activity [AlgoAlpha]🟠 OVERVIEW
This tool visualizes how Smart Money and Retail participants behave through lower-timeframe volume analysis. It detects volume spikes far beyond normal activity, classifies them as institutional or retail, and projects those zones as reactive levels. The script updates dynamically with each bar, showing when large players enter while tracking whether those events remain profitable. Each event is drawn as a horizontal line with bubble markers and summarized in a live P/L table comparing Smart Money versus Retail.
🟠 CONCEPTS
The core logic uses Z-score normalization on lower-timeframe volumes (like 5m inside a 1h chart). This lets the script detect statistically extreme bursts of buying or selling activity. It classifies each detected event as:
Smart Money — volume inside the candle body (suggesting hidden accumulation or distribution)
Retail — volume closing at bar extremes (suggesting chase entries or panic exits)
When new events appear, the script plots them as horizontal levels that persist until price interacts again. Each level acts as a potential reaction zone or liquidity footprint. The integrated P/L table then measures which class (Retail or Smart Money) is currently “winning” — comparing cumulative profitable versus losing volume.
🟠 FEATURES
Classifies flows into Smart Money or Retail based on candle-body context.
Displays live P/L comparison table for Smart vs Retail performance.
Alerts for each detected Smart or Retail buy/sell event.
🟠 USAGE
Setup : Add the script to any chart. Set Lower Timeframe Value (e.g., “5” for 5m) smaller than your main chart timeframe. The Period input controls how many bars are analyzed for the Z-score baseline. The Threshold (|Z|) decides how extreme a volume must be to plot a level.
Read the chart : Horizontal lines mark where heavy Smart or Retail volume occurred. Bright bubbles show the strongest events — their size reflects Z-score intensity. The on-chart table updates live: green cells show profitable flows, red cells show losing flows. A dominant green Smart Money row suggests institutions are currently controlling price.
See what others are doing :
Settings that matter : Raising Threshold (|Z|) filters noise, showing only large players. Increasing Period smooths results but reacts slower to new bursts. Use Show = “Both” for full comparison or isolate “Smart Money” / “Retail” to focus on one class.

Smart Money Footprint & Cost Basis Engine [AlgoPoint]Smart Money Footprint & Cost Basis Engine
This indicator is a comprehensive market analysis tool designed to identify the "footprints" of Smart Money (institutions, whales) and pinpoint high-probability reaction zones. Instead of relying on lagging averages, this engine analyzes the very structure of the market to find where large players have shown their hand.
How It Works: The Core Logic
The indicator operates on a multi-stage confirmation process to identify and validate Smart Money zones:
Smart Money Detection (The Trigger): The engine first scans the chart for signs of intense, urgent buying or selling. It does this by identifying Fair Value Gaps (FVGs) created by large, high-volume Displacement Candles. This is our initial Point of Interest (POI).
Cost Basis Calculation (The Average Price): Once a potential Smart Money move is detected, the indicator calculates the Volume-Weighted Average Price (VWAP) for that specific move. This gives us a highly accurate estimate of the average price at which the large players entered their positions.
Historical Confirmation (The "Memory"): This is the indicator's most unique feature. It checks its historical database to see if a similar Smart Money move (in the same direction) has occurred in the same price area in the past. If a match is found, the zone's significance is confirmed.
Verified Cost Basis Zone (The Final Output): A zone that passes all the above checks is drawn on the chart as a high-probability Verified Cost Basis Zone. These are the "memory zones" where the market is likely to react upon a re-visit.
How to Use This Indicator
Cost Basis Zones (The Boxes):
Green Boxes: Bullish zones where Smart Money likely accumulated positions. When the price returns here, a BUY reaction is expected.
Red Boxes: Bearish zones where Smart Money likely distributed positions. When the price returns here, a SELL reaction is expected.
Zone Strength (★★★): Each zone is created with a star rating. More stars indicate a higher-confidence zone (based on factors like volume intensity and historical confirmation).
BUY/SELL Signals: A signal is only generated when the price enters a zone AND the confirmation filters (if enabled in the settings) are passed.
Zone Statuses:
Green/Red: Active and waiting to be tested.
Gray: The zone has been tested, and a signal was produced.
Dark Gray (Invalidated): The zone was broken decisively and is no longer considered valid support/resistance.
Key Settings
Signal Accuracy Filters: You can enable/disable three powerful filters to balance signal quantity and quality:
Momentum Confirmation (Stoch): Waits for momentum to align with the zone's direction.
Candlestick Confirmation (Engulfing): Waits for a strong reversal candle inside the zone.
Lower Timeframe MSS Confirmation: The most advanced filter; waits for a trend shift on a lower timeframe before giving a signal.
Historical Confirmation:
Require Historical Confirmation: Toggle the "Memory" feature on/off. Turn it off to see all potential SM zones.
Tolerance Calculation Method: Choose between a dynamic ATR Multiplier (recommended for all-around use) or a fixed Percentage to define the zone size.

Smart Money Precision Structure [BullByte]Smart Money Precision Structure
Advanced Market Structure Analysis Using Institutional Order Flow Concepts
---
OVERVIEW
Smart Money Precision Structure (SMPS) is a comprehensive market analysis indicator that combines six analytical frameworks to identify high-probability market structure patterns. The indicator uses multi-dimensional scoring algorithms to evaluate market conditions through institutional order flow concepts, providing traders with professional-grade market analysis.
---
PURPOSE AND ORIGINALITY
Why This Indicator Was Developed
• Addresses the gap between retail and institutional analysis methods
• Consolidates multiple analysis techniques that professionals use separately
• Automates complex market structure evaluation into actionable insights
• Eliminates the need for multiple indicators by providing comprehensive analysis
What Makes SMPS Original
• Six-Layer Confluence System - Unique combination of market regime, structure, volume flow, momentum, price action, and adaptive filtering
• Institutional Pattern Recognition - Identifies smart money accumulation and distribution patterns
• Adaptive Intelligence - Parameters automatically adjust based on detected market conditions
• Real-Time Market Scoring - Proprietary algorithm rates market quality from 0-100%
• Structure Break Detection - Advanced pivot analysis identifies trend reversals early
---
HOW IT WORKS - TECHNICAL METHODOLOGY
1. Market Regime Analysis Engine
The indicator evaluates five core market dimensions:
• Volatility Score - Measures current volatility against 50-period historical baseline
• Trend Score - Analyzes alignment between 8, 21, and 50-period EMAs
• Momentum Score - Combines RSI divergence with MACD signal alignment
• Structure Score - Evaluates pivot point formation clarity
• Efficiency Score - Calculates directional movement efficiency ratio
These scores combine to classify markets into five regimes:
• TRENDING - Strong directional movement with aligned indicators
• RANGING - Sideways movement with mixed directional signals
• VOLATILE - Elevated volatility with unpredictable price swings
• QUIET - Low volatility consolidation periods
• TRANSITIONAL - Market shifting between different regimes
2. Market Structure Analysis
Advanced pivot point analysis identifies:
• Higher Highs and Higher Lows for bullish structure
• Lower Highs and Lower Lows for bearish structure
• Structure breaks when established patterns fail
• Dynamic support and resistance from recent pivot points
• Key level proximity detection using ATR-based buffers
3. Volume Flow Decoding
Institutional activity detection through:
• Volume surge identification when volume exceeds 2x average
• Buy versus sell pressure analysis using price-volume correlation
• Flow strength measurement through directional volume consistency
• Divergence detection between volume and price movements
• Institutional threshold alerts when unusual volume patterns emerge
4. Multi-Period Momentum Synthesis
Weighted momentum calculation across four timeframes:
• 1-period momentum weighted at 40%
• 3-period momentum weighted at 30%
• 5-period momentum weighted at 20%
• 8-period momentum weighted at 10%
Result smoothed with 6-period EMA for noise reduction.
5. Price Action Quality Assessment
Each bar evaluated for:
• Range quality relative to 20-period average
• Body-to-range ratio for directional conviction
• Wick analysis for rejection pattern identification
• Pattern recognition including engulfing and hammer formations
• Sequential price movement analysis
6. Adaptive Parameter System
Parameters automatically adjust based on detected regime:
• Trending markets reduce sensitivity and confirmation requirements
• Volatile markets increase filtering and require additional confirmations
• Ranging markets maintain neutral settings
• Transitional markets use moderate adjustments
---
COMPLETE SETTINGS GUIDE
Section 1: Core Analysis Settings
Analysis Sensitivity (0.3-2.0)
• Default: 1.0
• Lower values require stronger price movements
• Higher values detect more subtle patterns
• Scalpers use 0.8-1.2, swing traders use 1.5-2.0
Noise Reduction Level (2-7)
• Default: 4
• Controls filtering of false patterns
• Higher values reduce pattern frequency
• Increase in volatile markets
Minimum Move % (0.05-0.50)
• Default: 0.15%
• Sets minimum price movement threshold
• Adjust based on instrument volatility
• Forex: 0.05-0.10%, Stocks: 0.15-0.25%, Crypto: 0.20-0.50%
High Confirmation Mode
• Default: True (Enabled)
• Requires all technical conditions to align
• Reduces frequency but increases reliability
• Disable for more aggressive pattern detection
Section 2: Market Regime Detection
Enable Regime Analysis
• Default: True (Enabled)
• Activates market environment evaluation
• Essential for adaptive features
• Keep enabled for best results
Regime Analysis Period (20-100)
• Default: 50 bars
• Determines regime calculation lookback
• Shorter for responsive, longer for stable
• Scalping: 20-30, Swing: 75-100
Minimum Market Clarity (0.2-0.8)
• Default: 0.4
• Quality threshold for pattern generation
• Higher values require clearer conditions
• Lower for more patterns, higher for quality
Adaptive Parameter Adjustment
• Default: True (Enabled)
• Enables automatic parameter optimization
• Adjusts based on market regime
• Highly recommended to keep enabled
Section 3: Market Structure Analysis
Enable Structure Validation
• Default: True (Enabled)
• Validates patterns against support/resistance
• Confirms trend structure alignment
• Essential for reliability
Structure Analysis Period (15-50)
• Default: 30 bars
• Period for structure pattern analysis
• Affects support/resistance calculation
• Match to your trading timeframe
Minimum Structure Alignment (0.3-0.8)
• Default: 0.5
• Required structure score for valid patterns
• Higher values need stronger structure
• Balance with desired frequency
Section 4: Analysis Configuration
Minimum Strength Level (3-5)
• Default: 4
• Minimum confirmations for pattern display
• 5 = Maximum reliability, 3 = More patterns
• Beginners should use 4-5
Required Technical Confirmations (4-6)
• Default: 5
• Number of aligned technical factors
• Higher = fewer but better patterns
• Works with High Confirmation Mode
Pattern Separation (3-20 bars)
• Default: 8 bars
• Minimum bars between patterns
• Prevents clustering and overtrading
• Increase for cleaner charts
Section 5: Technical Filters
Momentum Validation
• Default: True (Enabled)
• Requires momentum alignment
• Filters counter-trend patterns
• Essential for trend following
Volume Confluence Analysis
• Default: True (Enabled)
• Requires volume confirmation
• Identifies institutional participation
• Critical for reliability
Trend Direction Filter
• Default: True (Enabled)
• Only shows patterns with trend
• Reduces counter-trend signals
• Disable for reversal hunting
Section 6: Volume Flow Analysis
Institutional Activity Threshold (1.2-3.5)
• Default: 2.0
• Multiplier for unusual volume detection
• Lower finds more institutional activity
• Stock: 2.0-2.5, Forex: 1.5-2.0, Crypto: 2.5-3.5
Volume Surge Multiplier (1.8-4.5)
• Default: 2.5
• Defines significant volume increases
• Adjust per instrument characteristics
• Higher for stocks, lower for forex
Volume Flow Period (12-35)
• Default: 18 bars
• Smoothing for volume analysis
• Shorter = responsive, longer = smooth
• Match to timeframe used
Section 7: Analysis Frequency Control
Maximum Analysis Points Per Hour (1-5)
• Default: 3
• Limits pattern frequency
• Prevents overtrading
• Scalpers: 4-5, Swing traders: 1-2
Section 8: Target Level Configuration
Target Calculation Method
• Default: Market Adaptive
• Three modes available:
- Fixed: Uses set point distances
- Dynamic: ATR-based calculations
- Market Adaptive: Structure-based levels
Minimum Target/Risk Ratio (1.0-3.0)
• Default: 1.5
• Minimum acceptable reward vs risk
• Higher filters lower probability setups
• Professional standard: 1.5-2.0
Fixed Mode Settings:
• Fixed Target Distance: 50 points default
• Fixed Invalidation Distance: 30 points default
• Use for consistent instruments
Dynamic Mode Settings:
• Dynamic Target Multiplier: 1.8x ATR default
• Dynamic Invalidation Multiplier: 1.0x ATR default
• Adapts to volatility automatically
Market Adaptive Settings:
• Use Structure Levels: True (default)
• Structure Level Buffer: 0.1% default
• Places levels at actual support/resistance
Section 9: Visual Display Settings
Color Theme Options
• Professional (Teal/Red)
- Bullish: Teal (#26a69a)
- Bearish: Red (#ef5350)
- Neutral: Gray (#78909c)
- Best for: Traditional traders, clean appearance
• Dark (Neon Green/Pink)
- Bullish: Neon Green (#00ff88)
- Bearish: Hot Pink (#ff0044)
- Neutral: Dark Gray (#333333)
- Best for: Dark theme users, high contrast
• Light (Green/Red Classic)
- Bullish: Green (#4caf50)
- Bearish: Red (#f44336)
- Neutral: Light Gray (#9e9e9e)
- Best for: Light backgrounds, traditional colors
• Vibrant (Cyan/Magenta)
- Bullish: Cyan (#00ffff)
- Bearish: Magenta (#ff00ff)
- Neutral: Medium Gray (#888888)
- Best for: High visibility, modern appearance
Dashboard Position
• Options: Top Left, Top Right, Bottom Left, Bottom Right, Middle Left, Middle Right
• Default: Top Right
• Choose based on chart layout preference
Dashboard Size
• Full: Complete information display (desktop)
• Mobile: Compact view for small screens
• Default: Full
Analysis Display Style
• Arrows : Simple directional markers
• Labels : Detailed text information
• Zones : Colored areas showing pattern regions
• Default: Labels (most informative)
Display Options:
• Display Analysis Strength: Shows star rating
• Display Target Levels: Shows target/invalidation lines
• Display Market Regime: Shows regime in pattern labels
---
HOW TO USE SMPS - DETAILED GUIDE
Understanding the Dashboard
Top Row - Header
• SMPS Dashboard title
• VALUE column: Current readings
• STATUS column: Condition assessments
Market Regime Row
• Shows: TRENDING, RANGING, VOLATILE, QUIET, or TRANSITIONAL
• Color coding: Green = Favorable, Red = Caution
• Status: FAVORABLE or CAUTION trading conditions
Market Score Row
• Percentage from 0-100%
• Above 60% = Strong conditions
• 40-60% = Moderate conditions
• Below 40% = Weak conditions
Structure Row
• Direction: BULLISH, BEARISH, or NEUTRAL
• Status: INTACT or BREAK
• Orange BREAK indicates structure failure
Volume Flow Row
• Direction: BUYING or SELLING
• Intensity: STRONG or WEAK
• Color indicates dominant pressure
Momentum Row
• Numerical momentum value
• Positive = Upward pressure
• Negative = Downward pressure
Volume Status Row
• INST = Institutional activity detected
• HIGH = Above average volume
• NORM = Normal volume levels
Adaptive Mode Row
• ACTIVE = Parameters adjusting
• STATIC = Fixed parameters
• Shows required confirmations
Analysis Level Row
• Minimum strength level setting
• Pattern separation in bars
Market State Row
• Current analysis: BULLISH, BEARISH, NEUTRAL
• Shows analysis price level when active
T:R Ratio Row
• Current target to risk ratio
• GOOD = Meets minimum requirement
• LOW = Below minimum threshold
Strength Row
• BULL or BEAR dominance
• Numerical strength value 0-100
Price Row
• Current price
• Percentage change
Last Analysis Row
• Previous pattern direction
• Bars since last pattern
Reading Pattern Signals
Bullish Structure Pattern
• Upward triangle or "Bullish Structure" label
• Star rating shows strength (★★★★★ = strongest)
• Green line = potential target level
• Red dashed line = invalidation level
• Appears below price bars
Bearish Structure Pattern
• Downward triangle or "Bearish Structure" label
• Star rating indicates reliability
• Green line = potential target level
• Red dashed line = invalidation level
• Appears above price bars
Pattern Strength Interpretation
• ★★★★★ = 6 confirmations (exceptional)
• ★★★★☆ = 5 confirmations (strong)
• ★★★☆☆ = 4 confirmations (moderate)
• ★★☆☆☆ = 3 confirmations (minimum)
• Below minimum = filtered out
Visual Elements on Chart
Lines and Levels:
• Gray Line = 21 EMA trend reference
• Green Stepline = Dynamic support level
• Red Stepline = Dynamic resistance level
• Green Solid Line = Active target level
• Red Dashed Line = Active invalidation level
Pattern Markers:
• Triangles = Arrow display mode
• Text Labels = Label display mode
• Colored Boxes = Zone display mode
Target Completion Labels:
• "Target" = Price reached target level
• "Invalid" = Pattern invalidated by price
---
RECOMMENDED USAGE BY TIMEFRAME
1-Minute Charts (Scalping)
• Sensitivity: 0.8-1.2
• Noise Reduction: 3-4
• Pattern Separation: 3-5 bars
• High Confirmation: Optional
• Best for: Quick intraday moves
5-Minute Charts (Precision Intraday)
• Sensitivity: 1.0 (default)
• Noise Reduction: 4 (default)
• Pattern Separation: 8 bars
• High Confirmation: Enabled
• Best for: Day trading
15-Minute Charts (Short Swing)
• Sensitivity: 1.0-1.5
• Noise Reduction: 4-5
• Pattern Separation: 10-12 bars
• High Confirmation: Enabled
• Best for: Intraday swings
30-Minute to 1-Hour (Position Trading)
• Sensitivity: 1.5-2.0
• Noise Reduction: 5-7
• Pattern Separation: 15-20 bars
• Regime Period: 75-100
• Best for: Multi-day positions
Daily Charts (Swing Trading)
• Sensitivity: 1.8-2.0
• Noise Reduction: 6-7
• Pattern Separation: 20 bars
• All filters enabled
• Best for: Long-term analysis
---
MARKET-SPECIFIC SETTINGS
Forex Pairs
• Minimum Move: 0.05-0.10%
• Institutional Threshold: 1.5-2.0
• Volume Surge: 1.8-2.2
• Target Mode: Dynamic or Market Adaptive
Stock Indices (ES, NQ, YM)
• Minimum Move: 0.10-0.15%
• Institutional Threshold: 2.0-2.5
• Volume Surge: 2.5-3.0
• Target Mode: Market Adaptive
Individual Stocks
• Minimum Move: 0.15-0.25%
• Institutional Threshold: 2.0-2.5
• Volume Surge: 2.5-3.5
• Target Mode: Dynamic
Cryptocurrency
• Minimum Move: 0.20-0.50%
• Institutional Threshold: 2.5-3.5
• Volume Surge: 3.0-4.5
• Target Mode: Dynamic
• Increase noise reduction
---
PRACTICAL APPLICATION EXAMPLES
Example 1: Strong Trending Market
Dashboard Reading:
• Market Regime: TRENDING
• Market Score: 75%
• Structure: BULLISH, INTACT
• Volume Flow: BUYING, STRONG
• Momentum: +0.45
Interpretation:
• Strong uptrend environment
• Institutional buying present
• Look for bullish patterns as continuation
• Higher probability of success
• Consider using lower sensitivity
Example 2: Range-Bound Conditions
Dashboard Reading:
• Market Regime: RANGING
• Market Score: 35%
• Structure: NEUTRAL
• Volume Flow: SELLING, WEAK
• Momentum: -0.05
Interpretation:
• No clear direction
• Low opportunity environment
• Patterns are less reliable
• Consider waiting for regime change
• Or switch to a range-trading approach
Example 3: Structure Break Alert
Dashboard Reading:
• Previous: BULLISH structure
• Current: Structure BREAK
• Volume: INST flag active
• Momentum: Shifting negative
Interpretation:
• Trend reversal potentially beginning
• Institutional participation detected
• Watch for bearish pattern confirmation
• Adjust bias accordingly
• Increase caution on long positions
Example 4: Volatile Market
Dashboard Reading:
• Market Regime: VOLATILE
• Market Score: 45%
• Adaptive Mode: ACTIVE
• Confirmations: Increased to 6
Interpretation:
• Choppy conditions
• Parameters auto-adjusted
• Fewer but higher quality patterns
• Wider stops may be needed
• Consider reducing position size
Below are a few chart examples of the Smart Money Precision Structure (SMPS) indicator in action.
• Example 1 – Bullish Structure Detection on SOLUSD 5m
• Example 2 – Bearish Structure Detected with Strong Confluence on SOLUSD 5m
---
TROUBLESHOOTING GUIDE
No Patterns Appearing
Check these settings:
• High Confirmation Mode may be too restrictive
• Minimum Strength Level may be too high
• Market Clarity threshold may be too high
• Regime filter may be blocking patterns
• Try increasing sensitivity
Too Many Patterns
Adjust these settings:
• Enable High Confirmation Mode
• Increase Minimum Strength Level to 5
• Increase Pattern Separation
• Reduce Sensitivity below 1.0
• Enable all technical filters
Dashboard Shows "CAUTION"
This indicates:
• Market conditions are unfavorable
• Regime is RANGING or QUIET
• Market score is low
• Consider waiting for better conditions
• Or adjust expectations accordingly
Patterns Not Reaching Targets
Consider:
• Market may be choppy
• Volatility may have changed
• Try Dynamic target mode
• Reduce target/risk ratio requirement
• Check if regime is VOLATILE
---
ALERTS CONFIGURATION
Alert Message Format
Alerts include:
• Pattern type (Bullish/Bearish)
• Strength rating
• Market regime
• Analysis price level
• Target and invalidation levels
• Strength percentage
• Target/Risk ratio
• Educational disclaimer
Setting Up Alerts
• Click Alert button on TradingView
• Select SMPS indicator
• Choose alert frequency
• Customize message if desired
• Alerts fire on pattern detection
---
DATA WINDOW INFORMATION
The Data Window displays:
• Market Regime Score (0-100)
• Market Structure Bias (-1 to +1)
• Bullish Strength (0-100)
• Bearish Strength (0-100)
• Bull Target/Risk Ratio
• Bear Target/Risk Ratio
• Relative Volume
• Momentum Value
• Volume Flow Strength
• Bull Confirmations Count
• Bear Confirmations Count
---
BEST PRACTICES AND TIPS
For Beginners
• Start with default settings
• Use High Confirmation Mode
• Focus on TRENDING regime only
• Paper trade first
• Learn one timeframe thoroughly
For Intermediate Users
• Experiment with sensitivity settings
• Try different target modes
• Use multiple timeframes
• Combine with price action analysis
• Track pattern success rate
For Advanced Users
• Customize per instrument
• Create setting templates
• Use regime information for bias
• Combine with other indicators
• Develop systematic rules
---
IMPORTANT DISCLAIMERS
• This indicator is for educational and informational purposes only
• Not financial advice or a trading system
• Past performance does not guarantee future results
• Trading involves substantial risk of loss
• Always use appropriate risk management
• Verify patterns with additional analysis
• The author is not a registered investment advisor
• No liability accepted for trading losses
---
VERSION NOTES
Version 1.0.0 - Initial Release
• Six-layer confluence system
• Adaptive parameter technology
• Institutional volume detection
• Market regime classification
• Structure break identification
• Real-time dashboard
• Multiple display modes
• Comprehensive settings
## My Final Thoughts
Smart Money Precision Structure represents an advanced approach to market analysis, bringing institutional-grade techniques to retail traders through intelligent automation and multi-dimensional evaluation. By combining six analytical frameworks with adaptive parameter adjustment, SMPS provides comprehensive market intelligence that single indicators cannot achieve.
The indicator serves as an educational tool for understanding how professional traders analyze markets, while providing practical pattern detection for those seeking to improve their technical analysis. Remember that all trading involves risk, and this tool should be used as part of a complete analysis approach, not as a standalone trading system.
- BullByte

Smart Money SignalsSmart Money Signals – Market Flow & Structure Visualizer
Overview
Smart Money Signals is a precision trading tool designed for traders who want to see market structure and momentum flow in real time. By detecting pivots, momentum imbalances, and dynamic support/resistance levels, the indicator transforms raw price action into a clear visual narrative of where capital is entering and exiting the market.
Instead of lagging averages or cluttered signals, Smart Money Signals highlights the moments that matter most—where bullish and bearish flows are confirmed, where support or resistance breaks, and where momentum zones show the true battleground between buyers and sellers. Its adaptive design makes it equally effective for scalpers seeking sharp entries, swing traders tracking reversals, and longer-term traders looking for confirmation of bias.
How It Works
The engine behind Smart Money Signals relies on swing detection and a configurable sensitivity filter. By monitoring directional momentum across recent bars, the system identifies bullish pivots (where downside exhaustion flips into strength) and bearish pivots (where upward thrust collapses into weakness).
When price confirms a pivot, the indicator draws flow lines to mark the breakout and labels them as either continuation or reversal events, depending on existing market bias. Momentum zones are automatically plotted, highlighting the critical areas where buyers defended price or sellers pressed it lower.
Dynamic support and resistance levels extend forward in time, updating live as price develops. These zones change color when broken, visually signaling whether structure has held or failed. Gradient background shading further emphasizes moments of extreme momentum, such as overbought or oversold surges, so that traders instantly see when market pressure intensifies.
Signals and Market Flows
Smart Money Signals provides visual cues that are both intuitive and actionable:
📈 Bullish Flow Signals appear when price breaks above a confirmed pivot, signaling continuation or reversal into strength.
📉 Bearish Flow Signals appear when price breaks below a confirmed pivot, indicating continuation or reversal into weakness.
Momentum Zones highlight the defended areas between pivots, giving traders a visual map of where structure is strongest.
Dynamic Support & Resistance lines extend across the chart, shifting from defense to failure when broken, ensuring that the most relevant levels are always visible.
Break Signals mark the exact bar where key levels give way, confirming structural violations in real time.
By filtering out noise and focusing on meaningful flow events, the system helps traders avoid overreaction and focus only on high-probability structural shifts.
Strategy Integration
Smart Money Signals is versatile across trading styles:
Trend Continuation : Enter in the direction of flow signals, using dynamic zones as both confirmation and stop-loss placement.
Reversal Trading : Watch for pivots tagged as reversal points, where market bias flips and new structure is created.
Momentum Zone Entries : Use the automatically drawn zones to identify low-risk entries on pullbacks or retests.
Bias Alignment : The integrated dashboard reveals the current market bias—bullish, bearish, or neutral—helping traders stay aligned with the dominant flow.
Stop-losses can be positioned beyond the dynamic zone on the opposite side, while take-profits may be guided by the width of zones or momentum-driven extensions. On higher timeframes, the indicator provides context for macro structure, while lower timeframes allow for tactical entry refinement.
Advanced Techniques
Traders seeking deeper precision can combine Smart Money Signals with volume or order flow tools to validate pivots and zone defenses. Monitoring the sequence of bullish and bearish flows helps identify trend maturity, while analyzing the success rate of pivots in the analytics panel builds a data-driven approach to confidence in signals.
Adjusting swing period and sensitivity allows the indicator to adapt to different market conditions, from volatile crypto pairs to steady forex majors. The flexible visual themes—Cyber, Ocean, Sunset, Matrix—ensure readability across setups, while gradient shading keeps the chart intuitive even under fast-moving conditions.
Why Use Smart Money Signals
Markets are driven by liquidity, momentum, and structure. Smart Money Signals uncovers these forces by translating price action into a clear visual map of flow. It shows:
Where structure was built.
Where it was defended.
Where it was broken.
And where momentum is likely to carry next.
By combining flow detection, dynamic zones, and a live analytics dashboard, the indicator provides traders with a complete framework for reading price action in real time.
Whether you trade crypto, forex, or indices, Smart Money Signals adapts seamlessly to any asset class, giving you clarity, precision, and confidence to execute without second-guessing.

Smart Money Scalper v1 [Structure | VIDYA | Oscillator | Delta]🧠 What’s Included in the Core Module:
Component Description-
🔹 Trend Structure + Bias- Detect BoS/ChoCH from Lux-style logic to define bullish/bearish intent.
🟩 Key Level Mapping Structure- based support/resistance and smart money reaction zones.
🔺 VIDYA Slope Filter- Detects smart money accumulation via adaptive volume/trend shifts.
🔸 Two Pole Oscillator- Fast trend strength + direction change confirmation.
🧃 Delta Volume Pressure- Measures real buy/sell aggression (accumulation vs distribution).
🚫 No Trade Zone Logic- Triggers in low volatility, mixed signals, or structure uncertainty.
📊 Bias Labels & Arrows- Display directional bias, trade zones, and visual entries only when clear.
📈 What You’ll See on Chart-
- Key structure swing highs/lows.
- Bull/Bear bias labels (top left).
- Buy/Sell arrows only when all smart money confirmations align.
- Gray zones showing no-trade periods (chop, conflict, low delta).

Smart Money Liquidity Zones ProThe Smart Money Liquidity Zones Pro indicator identifies and visualizes key liquidity areas in the market where institutional traders (smart money) are likely to have placed their stop-loss orders. These zones represent areas of high liquidity that often act as magnets for price, making them valuable reference points for trading decisions.
What the Indicator Does
Core Functionality
Swing Point Detection: The indicator identifies significant swing highs and lows using three different methods (Classic, Fractal, or Combined) to locate potential liquidity pools.
Liquidity Zone Creation: At each valid swing point, the indicator creates a horizontal zone representing an area where stop-loss orders are likely clustered.
Zone Clustering: When multiple swing points occur near the same price level, the indicator intelligently combines them into larger cluster zones, indicating stronger liquidity areas.
Volume Confirmation: The indicator can filter zones based on volume, showing only those swing points that occurred with significant trading volume.
Zone Break Detection: When price closes through a liquidity zone, the indicator marks it as "Liquidity Taken" and removes the zone from the chart.
Zone Types
Buy-Side Liquidity Zones (Green): Created at swing highs where short sellers' stop-losses are likely placed
Sell-Side Liquidity Zones (Red): Created at swing lows where long traders' stop-losses are likely placed
Trading Strategies
Basic Concepts
Liquidity Runs: Price often moves toward these zones to trigger stop-loss orders before reversing. This creates trading opportunities.
Support and Resistance: Unbroken liquidity zones can act as support (sell-side) or resistance (buy-side) levels.
Breakout Confirmation: When price breaks through a zone with strong momentum, it often continues in that direction.
Entry Strategies
Strategy 1: Liquidity Grab Reversa l
Wait for price to spike into a liquidity zone
Look for rejection candles (wicks) at the zone
Enter in the opposite direction after confirmation
Place stop-loss beyond the liquidity zone
Strategy 2: Zone Break Continuation
Wait for price to close decisively through a zone
Enter on the retest of the broken zone
Target the next liquidity zone in the direction of the break
Strategy 3: Zone Clustering Trade
Focus on areas with multiple overlapping zones (clusters)
These areas offer higher probability setups
Trade bounces from cluster zones with tighter risk management
Risk Management
Always use stop-losses beyond the liquidity zones
Consider the overall market context and trend
Zones on higher timeframes are generally more significant
Volume-confirmed zones have higher reliability
Settings Explanation
Swing Detection Settings
Swing Strength (Lookback Bars)
Determines how many bars to look back for swing point validation
Higher values find more significant swings but fewer zones
Recommended settings:
1m-5m charts: 3-5
15m-1h charts: 5-8
Daily charts: 5-10
Weekly charts: 3-5
Monthly charts: 2-3
Adaptive Swing Detection
Automatically adjusts swing detection based on available historical data
Prevents errors when there's limited chart history
Recommended to keep enabled
Minimum Bars for Swing
Sets the absolute minimum bars required for swing detection
Lower values allow detection in limited data conditions
Swing Detection Method
Classic: Strict price comparison for pure swing highs/lows
Fractal: Williams Fractal pattern (2 bars on each side)
Combined: Uses both methods for maximum zone detection
Auto-Adjust for Timeframe
Automatically optimizes settings based on chart timeframe
Prevents inappropriate settings on higher timeframes
Zone Settings
Max Number of Visible Zones
Limits the number of zones displayed to prevent chart clutter
Older zones are automatically removed
Max Zone Duration (Bars)
Zones older than this are automatically deleted
Keeps the chart focused on recent liquidity areas
Enable Zone Clustering
Groups nearby zones into larger clusters
Identifies stronger liquidity areas
Cluster Threshold (%)
Maximum price distance for zones to be clustered
Lower values create tighter clusters
Show Cluster Labels
Displays "Cluster x2", "Cluster x3" etc. on grouped zones
Volume Filter Settings
Enable Volume Filter
When enabled, only creates zones at high-volume swing points
Increases zone quality but reduces quantity
Volume Multiplier
Multiplier for average volume to determine "high volume"
Lower values (0.7-0.9) create more zones
Higher values (1.2+) create fewer, higher-quality zones
Volume SMA Period
Period for calculating average volume
Higher values create smoother volume baseline
Show Volume Confirmation Icon
Displays a fire emoji on volume-confirmed zones
Volume Visualization Settings
Show Volume Dots
Displays dots below high-volume bars
Dynamic Zone Colors
Volume-confirmed zones appear with more intense colors
Show Volume Background
Highlights the chart background on high-volume bars
Visual Settings
Buy-Side/Sell-Side Zone Colors
Customize colors for long and short liquidity zones
Border Width
Thickness of zone borders (1-3)
Show 'Liquidity Taken' Labels
Displays labels when zones are broken
Label Size
Size of the liquidity taken labels
Show Swing Point Markers
Displays triangles at detected swing points
Show Debug Info
Shows diagnostic information for troubleshooting
Dashboard Settings
Show Dashboard
Toggles the information panel display
Dashboard Position
Choose from 6 positions on the chart
Background Color
Dashboard background color
Text Color
Dashboard text color
Text Size
Dashboard text size (tiny/small/normal/large)
Tips for Effective Use
Start with default settings and adjust based on your trading style and timeframe
Use multiple timeframes to identify confluence between zones on different scales
Combine with other indicators like trend analysis or momentum oscillators
Pay attention to clusters as they represent stronger liquidity areas
Monitor volume-confirmed zones for higher probability setups
Adjust zone duration based on your trading timeframe (shorter for scalping, longer for swing trading)
Use the debug feature if zones aren't appearing to understand why
Keep the chart clean by limiting the number of visible zones
Common Issues and Solutions
No zones appearing:
Lower the Swing Strength setting
Switch to Combined detection method
Disable volume filter if active
Check if there's enough historical data
Too many zones:
Increase Swing Strength
Enable volume filter
Reduce Max Number of Visible Zones
Increase Cluster Threshold
Zones disappearing too quickly:
Increase Max Zone Duration
Check if zones are being broken by price
Poor performance on higher timeframes:
Enable Auto-Adjust for Timeframe
Use appropriate Swing Strength for the timeframe
Consider using Classic method instead of Fractal
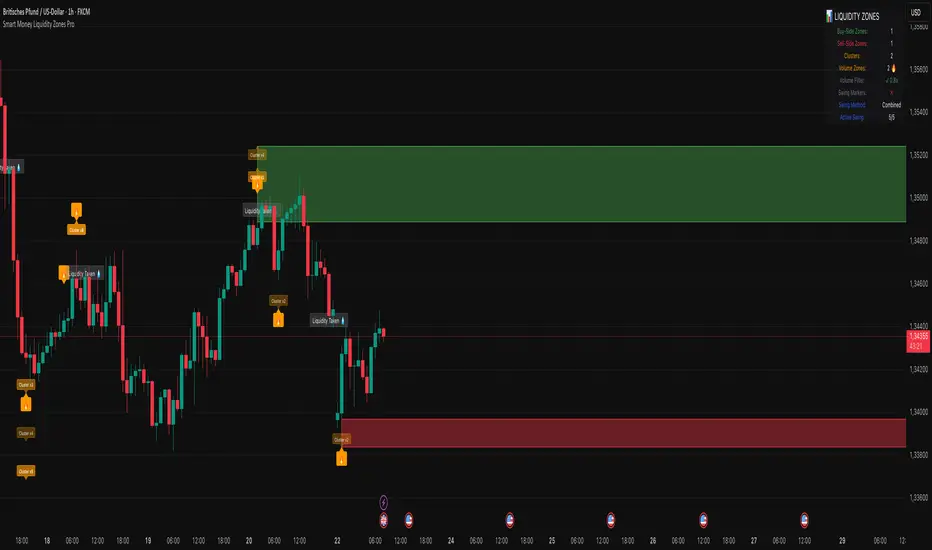
Smart Money Breakout & Order Block StrategySmart Money Breakout & Order Block Strategy
Created by Shubham
This strategy was developed by Shubham, designed to provide traders with a structured approach to smart money trading by combining breakout entries and order block reversals. It focuses on liquidity zones, volatility filters, and ATR-based stop management to adapt to different market conditions.
🔹 Strategy Overview
The Smart Money Breakout & Order Block Strategy is built for traders who want to identify institutional moves while avoiding false breakouts. This non-repainting strategy helps traders detect:
✅ Momentum Breakouts – Price breaking key support & resistance levels.
✅ Order Block Reversals – Institutional buying & selling zones.
✅ Dynamic Stop Management – No fixed SL/TP; uses ATR-based trailing stops.
✅ Volatility Filtering – Avoids choppy market conditions.
🔹 Trading Logic
1️⃣ Breakout Trading (Momentum Entries)
Long Entry: When price breaks above resistance with high volatility.
Short Entry: When price breaks below support with high volatility.
2️⃣ Order Block Reversals (Liquidity Entries)
Bullish Order Block: A strong price rejection after consecutive bearish candles signals smart money accumulation, triggering a long trade.
Bearish Order Block: A strong price rejection after consecutive bullish candles signals smart money distribution, triggering a short trade.
3️⃣ Volatility Filter (False Signal Prevention)
Uses normalized volatility to ensure breakouts are backed by strong momentum.
Helps filter out low-volume, choppy market conditions.
4️⃣ ATR-Based Position Management (Dynamic Stops & Trailing Stop)
No fixed SL/TP → Uses ATR-based stop-loss to adapt to market volatility.
Implements a trailing stop for maximizing potential profits in trending markets.
🔹 Key Features
✔️ Developed by Shubham – Designed for precision trading with institutional techniques.
✔️ Smart Money Concept – Identifies liquidity zones, breakouts, and order blocks.
✔️ Volatility Filter – Prevents false breakouts by analyzing market momentum.
✔️ ATR-Based Dynamic Stops – No fixed SL/TP, making it more adaptive.
✔️ Trailing Stop Functionality – Allows profits to run while reducing risk.
✔️ Fully Automated Execution – Uses TradingView’s strategy functions for automatic trade placement and exits.
✔️ Commission-Adjusted Backtesting – Includes realistic commission settings to ensure accurate results.
📊 Backtesting & Realistic Expectations
✅ Best for Higher Timeframes (1H, 4H, Daily) – Avoids market noise.
✅ Most Effective in Trending & Volatile Markets – Crypto, forex, indices, and commodities.
✅ Performance Varies with Market Conditions – Works best in strong trends.
✅ No Unrealistic Promises – Strategy performance is dependent on market behavior and risk management.
📌 IMPORTANT DISCLAIMER:
This strategy is provided for educational purposes only and should not be considered financial advice. Past performance in backtesting does not guarantee future results. Users should conduct their own research before applying this strategy in live markets.
🚀 Developed by Shubham – Test it yourself and see how it performs! 🚀

Smart Money Liquidity Heatmap [AlgoAlpha]🌟📈 Introducing the Smart Money Liquidity Heatmap by AlgoAlpha! 🗺️🚀
Dive into the depths of market liquidity with our innovative Pine Script™ indicator designed to illuminate the trading actions of smart money! This meticulously crafted tool provides an enhanced visualization of liquidity flow, highlighting the dynamics between smart and retail investors directly on your chart! 🌐🔍
🙌 Key Features of the Smart Money Liquidity Heatmap:
🖼️ Visual Clarity: Uses vibrant heatmap colors to represent liquidity concentrations, making it easier to spot significant trading zones.
🔧 Customizable Settings: Adjust index periods, volume flow periods, and more to tailor the heatmap to your trading strategy.
📊 Dynamic Ratios: Computes the ratio of smart money to retail trading activity, providing insights into who is driving market movements.
👓 Transparency Options: Modify color intensity for better visibility against various chart backgrounds.
🛠 How to Use the Smart Money Liquidity Heatmap:
1️⃣ Add the Indicator:
Add the indicator to favourites. Customize settings to align with your trading preferences, including periods for index calculation and volume flow.
2️⃣ Market Analysis:
Monitor the heatmap for high liquidity zones signalled by the heatmap. These are potential areas where smart money is actively engaging, providing crucial insights into market dynamics.
Basic Logic Behind the Indicator:
The Smart Money Liquidity Heatmap utilizes the Smart Money Interest Index Indicator and operates by differentiating between the trading behaviors of informed (smart money) and less-informed (retail) traders. It calculates the differences between specific volume indices—Positive Volume Index (PVI) for retail investors and Negative Volume Index (NVI) for institutional players—and their respective moving averages, highlighting these differences using the Relative Strength Index (RSI) over user-specified periods. This calculation generates a ratio that is then normalized and compared against a threshold to identify areas of high institutional trading interest, visually representing these zones on your chart as vibrant heatmaps. This enables traders to visually identify where significant trading activities among smart money are occurring, potentially signalling important buying or selling opportunities.
🎉 Elevate your trading experience with precision, insight, and clarity by integrating the Smart Money Liquidity Heatmap into your toolkit today!

smart money - main trend and counter trendIn today's dynamic financial markets, keeping ahead requires more than just technical analysis.
Introducing the Smart Money indicator – a Pine Script tool made to discover the activity of market maker.
Smart Money is a helpful method for traders seeking a deeper understanding of market dynamics. This method shows the actions of big investors and large financial firms.
Keen traders pay close attention to what market makers do to stay ahead.
Trading strategies based on the Smart Money aim to align with the actions of these informed players.
Similar to the price action method, Smart Money method involves using classic concepts like supply and demand, price patterns, and support and resistance.
This indicator not only identifies usual parameters like Break of Structure (BOS), Change of Character (CHOCH), Inducement (IDM), Engineering Liquidity (Eng), and Order Blocks (OB), but also excels at uncovering these market events within counter-trend (internal trend).
Break of Structure (BOS)
BOS is formed when the price breaks the market structure (reliable support or resistance level) in the direction of the trend.
Change of Character (CHOCH)
CHOCH is formed when the price breaks the market structure in the opposite direction of the trend. This indicates a change in the market behavior. When traders can see these changes, they can adjust their strategies early on.
Inducement (IDM)
Inducement is a concept based on liquidity principles and technically is the last price pullback in the market structure.
IDM is the extreme point of the last pullback in the structure when the price makes a BOS or CHOCH. It's like a trap that makes traders jump into the market too early.
Engineering Liquidity (Eng Liq)
Also known as trend line liquidity and technically is the first extreme point in that trend.
Order Blocks (OB)
Order blocks are strategic market areas that indicate the final bearish or bullish activity before a significant price shift.
An Order Block is a handy tool that helps us see where the big guys are likely to put their money (potential reversal zones).
OB is determined based on the extreme points by considering last opposite candle (before a significant price movement) and fair value gaps.
This indicator has the ability to identify the decisional order block (the closest OB) and the extremum order blocks (the farthest OB).
Counter Trend
The standout feature of this indicator lies in its ability to detect and display all above features within internal trends.
Internal trends or counter trend, where the market moves against the main trend, are often challenging to navigate.
This comprehensive feature enables traders to navigate market complexities with confidence, identifying potential trend reversals and strategic entry points even when the broader trend suggests otherwise.
Some features of this indicator:
- Ability to identify BOS, CHOCH, IDM, Eng Liq and OBs in both main trend and counter trend.
- The text, color and size of each characteristic of the main trend and the counter trend are optional and you can manage their display type on the chart
- Ability to display swings with HH, LH, LL and HL labels
- Sending alarms when the price hits any of the levels (alarm levels are optional for both the main trend and the counter trend)
- Sending sweep alarms of each level (optional)
- Ability to display main structures and internal structures with desired color and thickness
- The possibility of displaying live and real-time structures
- Ability to see decision boxes
- Showing the structure trend by changing the background color

Smart Money Concepts [UAlgo]🔶 Description:
Smart Money Concepts (SMC) refer to a trading strategy that revolves around understanding and following the actions of institutional investors, such as banks and hedge funds, who are considered the “smart money” in the market. The concept is based on the idea that these institutions have more information and resources, and thus their market activities can indicate future market movements.
This script designed to be a tool that will automatically provide many features related to SMC concept for investors, offering a market structure analysis that includes the identification of order blocks, breaker blocks, and liquidity points. It also delineates premium and discount zones, highlights Fair Value Gaps (FVG), Volume Imbalance (VI) and Order Gap (OG) areas, providing users with a multifaceted view of market dynamics.
🔶 Key Features:
Market Structure Analysis : Simplifies the overview of market behavior, identifies market breakouts or trend continuation.
It detects the market structure as shown in the image below :
Order Blocks : Detects Order Blocks based on market structure analysis and volume characteristics. It draws these blocks and provides information such as volume.
Order Block Identification:
Breaker Blocks : Detects Breaker Blocks based on market structure analysis.
Breaker Block Identification:
When Order Block above is broken,
As you can see, it has now turned into a Bearish Breaker Block,
And it seems that the price is getting a reaction from this breaker block above.
Liquidity Sweeps : Tracks liquidity sweeps on both the buy and sell sides, offering traders a perspective on market momentum and potential shifts.
Multi-Timeframe Fair Value Gap (FVG), Volume Imbalance (VI), Order Gaps (OG) Detection : Detects Fair Value Gap (FVG), Volume Imbalance (VI) and Order Gaps (OG) based on different criteria such as price movements and volume characteristics. It marks these gaps/voids and provides visual cues for analysis.
Examle for FVG:
Premium & Discount Zone Analysis : Analyzes premium and discount zones, showing prices within these zones and highlighting equilibrium (0.5) levels.
Customizable Options : Provides various input parameters for customization, such as market structure length, sensitivity settings, display preferences, and mitigation methods.
Previous Key Levels : Identifies previous key levels include previous highs, lows, equilibrium points, and open prices across different timeframes such as daily, weekly, and monthly.
🔶 Disclaimer:
Use with Caution: This indicator is provided for educational and informational purposes only and should not be considered as financial advice. Users should exercise caution and perform their own analysis before making trading decisions based on the indicator's signals.
Not Financial Advice: The information provided by this indicator does not constitute financial advice, and the creator (UAlgo) shall not be held responsible for any trading losses incurred as a result of using this indicator.
Backtesting Recommended: Traders are encouraged to backtest the indicator thoroughly on historical data before using it in live trading to assess its performance and suitability for their trading strategies.
Risk Management: Trading involves inherent risks, and users should implement proper risk management strategies, including but not limited to stop-loss orders and position sizing, to mitigate potential losses.
No Guarantees: The accuracy and reliability of the indicator's signals cannot be guaranteed, as they are based on historical price data and past performance may not be indicative of future results.
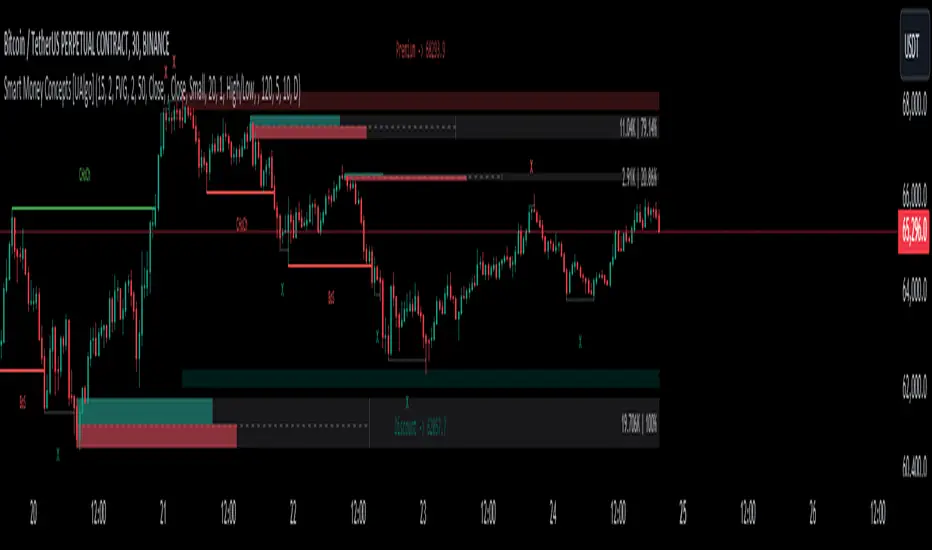
BigBeluga - Smart Money ConceptsSmart Money Concepts (SMC) is a comprehensive toolkit built around the around the principles of "smart money" behavior, which refers to the actions and strategies of institutional investors.
SMC transcends traditional technical analysis by delving deeper into this framework. This approach allows users to decipher the actions of these influential players, anticipate their potential impact on market dynamics, and gain insights beyond just price movements.
This all-in-one toolkit provide the user with a unique experience by automating most of the basic and advanced concepts on the chart, saving them time and improving their trading ideas.
🔹Real-time market structure analysis simplifies complex trends by pinpointing key support, resistance, and breakout levels.
🔹Advanced order block analysis leverages detailed volume data to pinpoint high-demand zones, revealing internal market sentiment and predicting potential reversals. This analysis utilizes bid/ask zones to provide supply/demand insights, empowering informed trading decisions.
🔹Imbalance Concepts (FVG and Breakers) allows traders to identify potential market weaknesses and areas where price might be attracted to fill the gap, creating opportunities for entry and exit
🔹Swing failure patterns help traders identify potential entry points and rejection zones based on price swings
🔹Liquidity Concepts, our advanced liquidity algorithm, pinpoints high-impact events, allowing you to predict market shifts, strong price reactions, and potential stop-loss hunting zones. This gives traders an edger to make informed trading decisions based on multi-timeframe liquidity dynamics
🔶 FEATURES
The indicator has quite a lot of features that are provided below:
Swing market structure
Internal market structure
Mapping structure
Discount/Premium zone
Adjustable market structure
Strong/Weak H&L
Sweep
Volumetric Order block / Breakers
Fair Value Gaps / Breakers (multi-timeframe)
Swing Failure Patterns (multi-timeframe)
Deviation area
Equal H&L
Liquidity Prints
Buyside & Sellside
Sweep Area
Highs and Lows (multi-timeframe)
🔶 BASIC DEMONSTRATION
The preceding image illustrates the market structure functionality within the Smart Money Concepts indicator.
Solid lines: These represent the core indicator's internal structure, forming the foundation for most other components. They visually depict the overall market direction and identify major reversal points marked by significant price movements (denoted as 'x').
Dotted lines: These represent an alternative internal structure with the potential to drive more rapid market shifts. This is particularly relevant when a significant gap exists in the established swing structure, specifically between the Break of Structure (BOS) and the most recent Change of High/Low (CHoCH). Identifying these formations can offer opportunities for quicker entries and potential short-term reversals.
Sweeps (x): These signify potential turning points in the market where liquidity is removed from the structure. This suggests a possible trend reversal and presents crucial entry opportunities. Sweeps are identified within both swing and internal structures, providing valuable insights for informed trading decisions.
🔶 USAGE & EXAMPLES
The image above showcases a detailed example of several features from our toolkit that can be used in conjunction for a comprehensive analysis.
Price rejecting from the bullish order block (POC), while printing inside a bullish SFP and internal structure turning bullish (Internal CHoCH).
The image further demonstrates how two bearish order blocks could potentially act as resistance zones when prices approach those levels. These areas might also offer attractive locations to place take-profit orders.
The price has reached our first take-profit level, but is exhibiting some signs of weakness, suggesting a potential pullback which could put the trade at higher risk.
On the other hand, the price action currently exhibits strong bullish sentiment, suggesting favorable entry points and a potential upward trend.
The price has now fully reached our take-profit zone and is also exhibiting bearish confluence, indicating a potential price reversal or trend shift.
🔶 USING CONFLUENCE
The core principle behind the success of this toolkit lies in identifying "confluence." This refers to the convergence of multiple trading indicators all signaling the same information at a specific point or area. By seeking such alignment, traders can significantly enhance the likelihood of successful trades.
In the image above we can see a few examples of the indicator used in confluence with other metrics included in the toolkit.
Liquidity Prints within order blocks
SFP close to the POC
Sweep in liquidity close to a fair value gaps
These are just a few examples of what applying confluence can look like.
🔶 SETTINGS
Window: limit calculation period
Swing: limit drawing function
Internal: a period of the beginning of the internal structure
Mapping structure: show structural points
Algorithmic Logic: (Extreme-Adjusted) Use max high/low or pivot point calculation
Algorithmic loopback: pivot point look back
Premium / Discount: Lookback period of the pivot point calculation
Show Last: Amount of Order block to display
Hide Overlap: hide overlapping order blocks
Construction: Size of the order blocks
Fair value gaps: Choose between normal FVG or Breaker FVG
Mitigation: (close - wick- avg) point to mitigate the order block/imbalance
SFP lookback: find a higher / lower point to improve accuracy
Threshold: remove less relevant SFP
Equal h&L: (short-mid-long term) display longer term
Any Alert(): Trigger alerts based on the selected inputs
Skrip berbayar

ArtiumPro Smart Money ConceptsSmart money concepts refer to the use of institutional trading strategies which align with the perspectives of Smart Money in the market. i.e. the composite man. Market Structure is the foundation of price action trading, understanding price action is fundamental to SMC.
ArtiumPro SMC 2.1 is an SMC (Smart Money Concepts) indicator full of features to aid SMC traders. Our aim is to save you time with automatic chart mark-up and help you spot areas of interest you may miss with the naked eye.
Fvg (Fair Value Gap) - is also known as an imbalance. An FVG is an imbalance of orders, for instance, for sellers to complete their trades, there must be buyers and vice versa so when a market receives too many of one kind of order buys or sells, and not enough of the order's counterpart. When the amount is not balanced and too many orders are put in for one direction, it creates an imbalance.
Multi timeframe FVG - this will show the same as above but on the higher timeframe you choose. It’ll show as 2 lines that show the higher timeframe fvg with a filled box that mitigates on entry.
Order Blocks - These are supply and demand zones, displayed typically as the last down/up candle before a move in the opposite direction. Great POI’s for entry and take profits.
Outside candle - this is a candle that sweeps the highs and lows of the previous candle, best used for the 1 hour or above these can indicate a change of price direction.
Previous day high & low
Not only does it show your previous day's low and high but it also shows your opening and close of the day. You have settings where you can turn off the open and close and just have daily highs and lows. It’s your choice within your settings.
Market Structure - We have packed this feature with options that are customizable for you,
Break of Structure (BOS) indicates a trend continuation.
Change of Character (CHoCH) indicates the first sign of a possible trend change.
Equal Highs/lows - this will mark your double/triple tops and bottoms.
Retracement - set this to your preferred retracement amount to customize your market structure to what you qualify as a valid pullback.
Elliott Wave ZigZag
Many people ask for the Elliott Waves. Well, here it is, inside this SMC. Just like your pivot highs and lows, the Elliott Wave is showing in real-time so you can see where your previous highs and lows are with the Elliott Wave break of structures that you can use in conjunction with the Smart Money Concepts Indicator of ArtiumPro.
Fib levels - for Premium & Discount areas - in this Instance the fib is used to determine if the price has pulled back into a premium or discount zone for optimal trade entry.
Trading Sessions
One of the most advanced trading session indicators out there and it’s included inside the most advanced SMC indicator on the market today. It has open breakout and settings to filter the opening range along with your pip daily range. You can select what timezone you are in and it automatically adjusts on the chart. Cool right? Hope you enjoy it, happy trading!