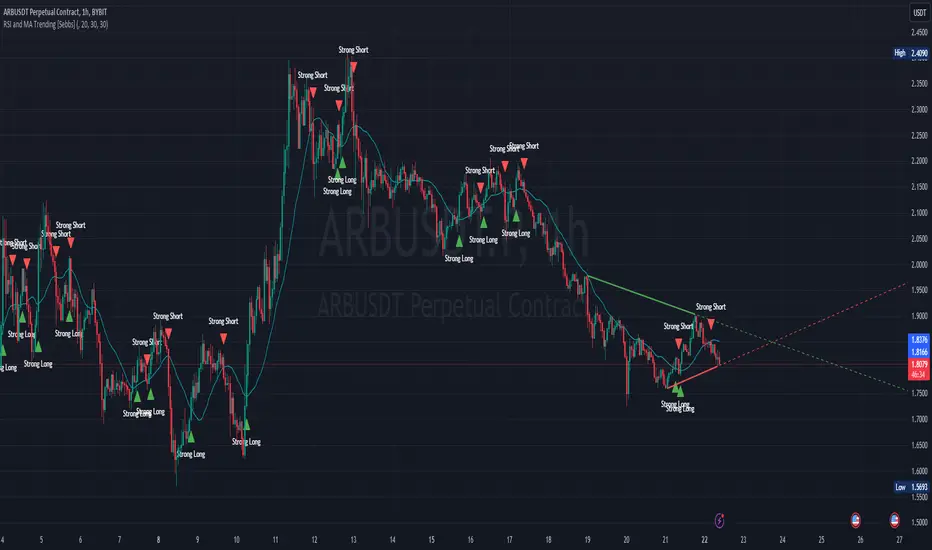
RSI and MA Trending [Sebbs]A simple indicator based on RSI strength and a custom SMA trendline.
RSI
RSI Strength is determined by a baseline.
The baseline is the 200 bar RSI
The current RSI value is compared to the Baseline and determines the current trend.
This Use of the RSI is unique because the strength indication point is not a static number (eg: 50) and the long term strength will trend up in a Bullish market.
This causes the reversal point of the strength to become much closer to the top of the waves end point.
SMA
The default SMA is a 20 bar length but is adjustable to suit any timeframe or chart.
The SMA determines the trend direction.
SIGNALS
When both are showing strength it will give a buy signal.
When both are showing weakness it will show a sell signal.
STRATEGY
I personally use 15 Minute chart and 20 bar SMA.
This method can have a close stop as it uses strength as an entry condition.
If the strength drops exit the trade.
For example, a 15 minute entry I would set a single candle stop as if that candle is taken back, the trade is no good.
The best entries are when a trendline breaks and strength changes direction.
FILTERS
Additional filters are provided such as other SMAs and Heikin Ashi bars for entry requirements.
DIVERGENCES
The Overlay also shows Divergence lines which use my own unique calculations.
The pivot low/high function provided by Pine Script requires a set number of bars to pass prior to locating a swing low/high.
This can mean large moves have occurred prior to a swing low having passed if the lookback range was set to five bars (5).
5 bars on a 2 hour chart is a long time and large moves may be missed.
As I don't use these functions, there is no requirement for a set number of bars to have passed prior to swing low/high positions to be identified.
This means it doesn't rely on a set number of bars to pass prior to finding a new pivot point.
* Code loops are a function which will check conditions in a range until a defined condition is met.
In this case a pivot low is a bar with no lower bars within 3 bars either side of the current checked bar.
Additional:
Lines will redraw and delete previous divergences to remove clutter on the indicator.
A table cells for alternate timeframe Stochastic RSI values so you don't need to swap between charts constantly.
RSI TABLE
A table is available for monitoring the RSI values of the current chart and a Higher Timeframe.
This helps keep track of which direction your should be looking for trades in.
This can be hidden in the indicator options.
Note
This indicator can not be open source due to a usage of a Private Library.
Cari dalam skrip untuk "trendline"
Gorb WallIntroduction:
Gorb Wall is a trading tool that offers a unique approach to market trend analysis. It extends the capabilities of the Gorb Algo indicator by presenting a multi-ticker, multi-timeframe dashboard, enabling traders to capture crucial market movements across various financial instruments without flipping through charts.
Overview:
Multi-Ticker Analysis: Monitor and analyze multiple financial instruments simultaneously.
Customizable Timeframes: Tailor the script to various timeframes to suit your trading strategy.
Gorb Algo Market Trend: An algorithm that adapts to market conditions, providing insights into trend changes.
User-Friendly Dashboard: Easily configure and customize the dashboard placement on your chart.
Color-Coded Trend Indicators: Visual cues to quickly assess bullish or bearish trends.
Optimized for Performance: Efficiently coded to ensure smooth running on TradingView without overloading resources.
How Gorb Wall Works:
The script utilizes Gorb Algo's market trend algorithm to process price and volume data across selected tickers and timeframes.
It applies a complex calculation to identify trends, using a combination of volatility analysis, momentum measurements, and trend strength indicators.
The output is a simplified visual representation on the dashboard, where colored circles indicate the trend direction, providing an at-a-glance market overview.
Unique Features:
Proprietary Algorithm: The heart of Gorb Wall lies in its unique Gorb Algo Market Trend algorithm. Unlike standard trend-following indicators, this proprietary algorithm integrates multiple technical analysis concepts (e.g., moving averages, volume data, price action, and oscillators) to provide a more comprehensive market trend analysis.
Multi-Dimensional Analysis: The script analyzes market trends by simultaneously processing data across multiple tickers and timeframes, offering a broader view of market movements than traditional single-ticker indicators.
We recommend exploring & choosing which tickers/timeframes best suits your needs and style of trading, and use that to combine with our suite of indicators.
Settings:
All skill-level friendly presets, easy to enable features with one-click
Dashboard Placement: Choose from top/bottom left/right for dashboard positioning.
Trend Speed Mode: Select the algorithm speed - Fast, Medium, Slow, Slowest.
Bullish/Bearish Trend Colors: Customize colors for trend indicators.
Additional Tickers: Input options for monitoring multiple financial instruments.
Timeframe Selection: Choose from a range of timeframes for each ticker.
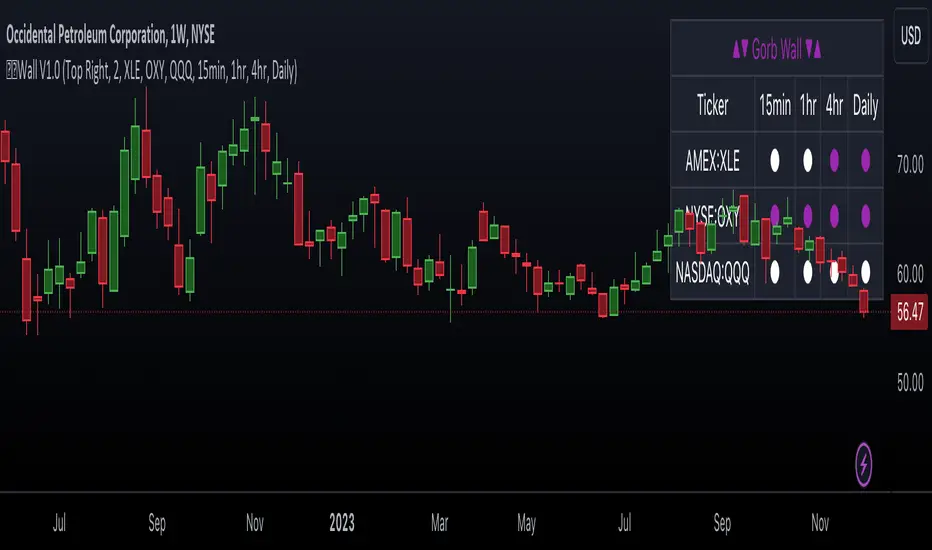
How to Use
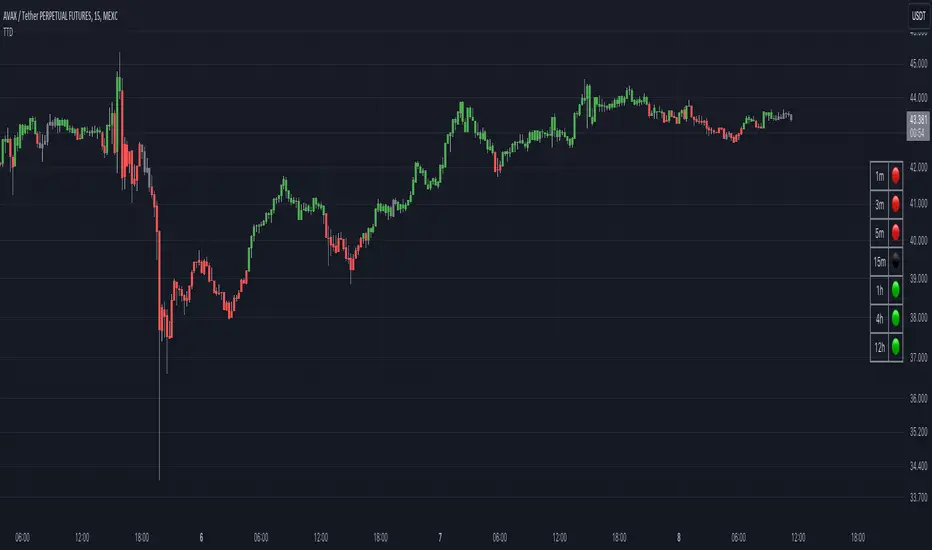
In the image below, we can see a basic example of how this indicator functions.
The dashboard displays up to three different tickers per the user's choice, with 4 different timeframes the user can choose. It that runs the algorithm line on the specified ticker & timeframe and plots a colored circle that identifies that tickers trend on the specified timeframes.
There are two colors, white for bullish trend and purple for bearish trend. These are the two consistent colors across our suit of indicators to help simplify trading by using simple color matching for confluence. Below is a continued breakdown on using this indicator:
Dynamic Trend Visualization in Real-Time Updates
The dashboard dynamically updates trend colors (white for bullish, purple for bearish) based on real-time market data, offering immediate insights into market sentiment. The next three images below these the live change in data as price action begins developing over multiple timeframes.
In the image above, we are on the 5min AAPL chart, we have SPY, QQQ, and VIX as our tickers on the dashboard with 1min, 2min, 3min, and 10min timeframes chosen. We begin to see VIX flip bullish, which can usually mean down side for indices.
We then see as AAPL's price begins to slow and reverse, we see SPY's trend following on the smaller timeframes first with VIX still leading the way indicating possible bearish change.
In the image above, we can see that price dips down and SPY & QQQ market trends have flipped bearish on all timeframes, while VIX continues to be bullish(validating the downwards price action)
Customizable Settings
Users can adjust settings such as dashboard placement, trend speed mode, and color themes to suit individual trading styles.
In the image below, we can see the dashboard placement setting offers four different locations the user can move the dashboard. Just like in Gorb Algo , the user can choose which trendline speed they want to use to best fit their trading strategy.
In the image below, we can see the "bullish trend" & "bearish trend" colors setting. These colors by default match the rest of our suite of indicators, white is bullish and purple is bearish. Users can change these color settings to meet their preferences.
In the image below, we can see there are three market ticker options that the user can change. This allows users to monitor their favorite tickers across or easily flip through multiple tickers in order to gauge their current market trends without having to change their chart
In the image below, we can see the 4 timeframes that are on the dashboard. The user has the ability to change each of those four, to whatever timeframe best suits their trading needs. There are 12 different timeframe options to choose from.
Quick Dashboard Review
Using color-coded trend detection, this quickly gauges market trends and provides a visual to easily identify these changes in real-time across multiple timeframes. When a circle changes color, this means that price has flipped that direction, causing a change in the Gorb Algo market trendline. As stated above, white is for bullish trend and purple is for bearish trend, but these colors can be changed to fit the users trading strategy and style. Each timeframe the user chooses will be updated in real-time, including the higher time frames like the daily & weekly. They have been modified to pull data a same speed the lower timeframes are.
This helps provide quick visual identification of real market trend changes as price action develops. It is best used in conjunction with other forms of technical analysis for a holistic trading approach.
Conclusion:
This indicator is designed to streamline market trend analysis, offering traders an innovative, efficient, and easy-to-use tool for making informed trading decisions. This tool complements our suite of indicators, providing unique market insights that are not typically available in traditional open-source scripts.
How to get access:
You can see the Author's instructions to get access to this indicator
RISK DISCLAIMER
All content, tools, scripts & education provided by Gorb Algo are for informational & educational purposes only. Trading is risky and most lose their money, past performance does not guarantee future results.
maRSI - Moving Averages for RSI with Outer BandsWhat distinguishes this indicator?
This indicator can help to identify a trend at an early stage or as a confirmation - based on a RSI and its Moving Average. It should invite you to experiment and thereby be adapted to your own way of trading.
The type of moving average could be defined: "SMA", "EMA", "DEMA", "TEMA", "SMMA", "LSMA", "HMA", "WMA"
A suggestion for interpretation of “maRSI”:
A cross over the middle line (Signal Line) can be interpreted as a trend change. Is often used for more aggressive trading styles.
Everything above the middle line (Signal Line) could be interpreted as Uptrend. Vice versa.
Depending on how the outer bands were configured, these could be interpreted as earlier signals of a trend change. Is often used for slightly less aggressive trading styles.
Depending on the selected moving average, more or less conservative signals can be output.
The plot "RSI" shows the RSI based on the settings you have made.
The plot "Signal Line" is colored and shows whether the Signal Line is up- or downtrending.
The plot "Direction: RSI to Signal Line" provides clear information about the direction in which the "Signal Line" intersects the RSI and where the RSI is to the "Signal Line". "1" means RSI above "Signal Line" and "-1" means RSI below "Signal Line"
The plot "Direction: Signal Line” provides clear information about the direction of the Signal Line. "1" means uptrending while "-1" means downtrending.
What do I need to consider?
By definition this indicator can be classified as lagging - since it based on historical prices/values. It may be advisable to add further indicators and an analysis of the market structure in order to confirm the signals issued by the indicator. Please note that when you make adjustments to any strategy, you always carry out particularly detailed tests.
Details concerning the crosses of maRSI with its Signal Line and Outer Bands:
#revision: lv07

Bull Bear Indicator (BBI)/Introduction
The Bull Bear Indicator (BBI) identifies bull market conditions and bear market conditions for equity investors so they can avoid missing a bull market or getting caught in a bear market.
/Signals
There are two signals:
1. Bull Market Alert - This indicates prices of stocks in the broader market are rising.
2. Bear market Alert - This indicates prices of stocks in the broader market are falling.
Both signals are indicated by a background colour and an upward/downward triangle. A green background and an upward green triangle below the bar signifies an environment of rising prices. A red background and a downward red triangle above the bar indicates an environment of falling prices.
Lack of a coloured background indicates a transition period from Bull to Bear or Bear to Bull conditions. The transitions may be rapid during periods of high volatility.
/Construction
The indicator is constructed using market breadth, price action and moving averages.
1.Market Breadth:
Definition: Market breadth refers to the number of stocks advancing versus the number declining in the stock market. It provides insight into the overall health and strength of a market move.
Use in Identifying Bull/Bear Markets:
Bull Market Indicators: In a bull market, market breadth is typically strong, with a large number of stocks advancing. This indicates widespread participation in the market rally, confirming the strength and sustainability of the upward trend.
Bear Market Indicators: Conversely, in a bear market, market breadth weakens, with more stocks declining than advancing. This suggests that the downward movement is broad-based across the market, reinforcing the bearish sentiment.
How the indicator does this: The number of stocks in a bullish/bearish trend is counted and normalised to a percentage to determine what percentage of stocks in the overall market are bullish/bearish.
2. Price Action:
Definition: Price action involves the study of historical price movements to predict future price direction. It includes analyzing patterns, trends, and the reactions of prices to certain levels (like support and resistance).
Use in Identifying Bull/Bear Markets:
Bull Market Indicators: In a bull market, price action typically shows higher highs and higher lows, indicating an ongoing upward trend. The reaction to support levels is often strong, with prices bouncing off these levels.
Bear Market Indicators: In a bear market, the price action is characterized by lower highs and lower lows. Prices tend to break through support levels and bounce off resistance levels, reflecting the dominant downward trend.
3. Trend Analysis:
Definition: Trend analysis involves identifying the direction and strength of market movements. This was done using moving averages.
Use in Identifying Bull/Bear Markets:
Bull Market Indicators: A bull market is often identified by upward-sloping trendlines and prices consistently staying above key moving averages.
Bear Market Indicators: In a bear market, the trendlines slope downwards, and prices remain below key moving averages.
How the indicator does this: The average closing prices of the largest capitalised stocks and their intermediate trend is assessed relative to their moving averages, the moving average combines price action and trend because it is simply the average closing price over time.
/Originality
This indicator is simple and effective in that it uses multiple factors to assess the market environment. Market breadth gives an overview of the participation level in the market trend, price action helps identify specific patterns and reactions to key levels indicating a bull or bear market, and trend analysis provides a macro view of the market direction and its strength. Combining these tools can gives a comprehensive picture of the market environment and help in distinguishing between bull and bear markets. The market environments are boldly marked out through background colours and triangle markers. The indicator performance is only valid from 2002 to date because the market breadth data used is not available before this date.
Why market Market breadth: Because it takes into account all the stocks in the market, this is essential in identifying the level of participation in a trend.
Why moving averages: Because it ensures that the price action and overall trend of the stocks can be monitored over a given lookback period
So together, moving average/price action + market breadth = trend + participation
Note:
The indicator has no predictive power, performance described here does not guarantee future results. Equity markets are particularly volatile and prone to cycles, and individual psychology can significantly affect indicator interpretation. Price data may also vary across exchanges.
/Settings
The parameters are fixed and there is no room for optimisation however, style settings can be modified by the user.
/Tickers
The BBI indicator is ticker agnostic but best viewed on a 1 day chart of the SPY.

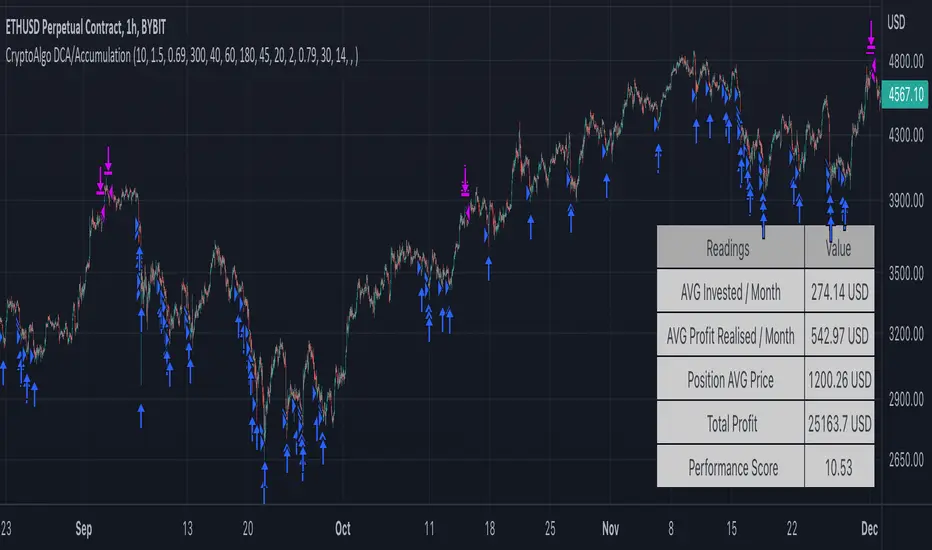
YinYang TrendTrend Analysis has always been an important aspect of Trading. There are so many important types of Trend Analysis and many times it may be difficult to identify what to use; let alone if an Indicator can/should be used in conjunction with another. For these exact reasons, we decided to make YinYang Trend. It is a Trend Analysis Toolkit which features many New and many Well Known Trend Analysis Indicators. However, everything in there is added specifically for the reason that it may work well in conjunction with the other Indicators prevalent within. You may be wondering, why bother including common Trend Analysis, why not make everything unique? Ideally, we would, however, you need to remember Trend Analysis may be one of the most common forms of charting. Therefore, many other traders may be using similar Trend Analysis either through plotting manually or within other Indicators. This all boils down to Psychology; you are trading against other traders, who may be seeing some of the similar information you are, and therefore, you may likewise want to see this information. What affects their trading decisions may affect yours as well.
Now enough about Trend Analysis, what is within this Indicator, and what does it do? Well, first let’s quickly mention all of its components, then we will, through a Tutorial, discuss each individually and finally how each comes together as a cohesive whole. This Indicator features many aspects:
Bull and Bear Signals
Take Profit Signals
Bull and Bear Zones
Information Tables displaying: (Boom Meter, Bull/Bear Strength, Yin/Yang State)
16 Cipher Signals
Extremes
Pivots
Trend Lines
Custom Bollinger Bands
Boom Meter Bar Colors
True Value Zones
Bar Strength Indexes
Volume Profile
There are many things to cover within our Tutorial so let's get started, chronologically from the list above.
Tutorial:
Bull and Bear Signals:
We’ve zoomed out quite a bit for this example to help give you a broader aspect of how these Bull and Bear signals work. When a signal appears, it is displaying that there may be a large amount of Bullish or Bearish Trend Analysis occurring. These signals will remain in their state of Bull or Bear until there is enough momentum change that they change over. There are a couple Options within the Settings that dictate when/where/why these signals appear, and this example is using their default Settings of ‘Medium’. They are, Purchase Speed and Purchase Strength. Purchase Speed refers to how much Price Movement is needed for a signal to occur and Purchase Strength refers to how many verifications are required for a signal to occur. For instance:
'High' uses 15 verifications to ensure signal strength.
'Medium' uses 10 verifications to ensure signal strength.
'Low' uses 5 verifications to ensure signal strength.
'Very Low' uses 3 verifications to ensure signal strength.
By default it is set to Medium (10 verifications). This means each verification is worth 10%. The verifications used are also relevant to the Purchase Speed; meaning they will be verified faster or slower depending on its speed setting. You may find that Faster Speeds and Lower Verifications may work better on Higher Time Frames; and Slower Speeds and Higher Verifications may work better on Lower Time Frames.
We will demonstrate a few examples as to how the Speed and Strength Settings work, and why it may be beneficial to adjust based on the Time Frame you’re on:
In this example above, we’ve kept the same Time Frame (1 Day), and scope; but we’ve changed Purchase Speed from Medium->Fast and Purchase Strength from Medium-Very Low. As you can see, it now generates quite a few more signals. The Speed and Strength settings that you use will likely be based on your trading style / strategy. Are you someone who likes to stay in trades longer or do you like to swing trade daily? Likewise, how do you go about identifying your Entry / Exit locations; do you start on the 1 Day for confirmation, then move to the 15/5 minute for your entry / exit? How you trade may determine which Speed and Strength settings work right for you. Let's jump to a lower Time Frame now so you can see how it works on the 15/5 minute.
Above is what BTC/USDT looks like on the 15 Minute Time Frame with Purchase Speed and Strength set to Medium. You may note that the signals require a certain amount of movement before they get started. This is normal with Medium and the amount of movement is generally dictated by the Time Frame. You may choose to use Medium on a Lower Time Frame as it may work well, but it may also be best to change it to a little slower.
We are still on the 15 Minute Time Frame here, however we simply changed Purchase Speed from Medium->Slow. As you can see, lots of the signals have been removed. Now signals may ‘hold their ground’ for much longer. It is important to adjust your Purchase Speed and Strength Settings to your Time Frame and personalized trading style accordingly.
Above we have now jumped down to the 5 Minute Time Frame. Our Purchase Speed is Slow and our Purchase Strength is Medium. We can see it looks pretty good, although there is some signal clustering going on in the middle there. If we change our Settings, we may be able to get rid of that.
We have changed our Purchase Speed from Slow->Snail (Slowest it can go) and Purchase Strength from Medium->Very Low (Lowest it can go). Changing it from Slow-Snail helped get rid of the signal clustering. You may be wondering why we lowered the Strength from Medium->Very Low, rather than going from Medium->High. This is a use case scenario and one you’ll need to decide for yourself, but we noticed when we changed the Speed from Slow->Snail that the signal clustering was gone, so then we checked both High and Very Low for Strengths to see which produced the best looking signal locations.
Please remember, you don’t have to use it the exact way we’ve displayed in this Tutorial. It is meant to be used to suit your Trading Style and Strategy. This is why we allow you to modify these settings, rather than just automating the change based on Time Frames. You’ll likely need to play around with it, as you’ll notice different settings may work better on certain pairs and Time Frames than others.
Take Profit Signals:
We’ve reset our Purchase Settings, everything is on defaults right now at Medium. We’ve enabled Take Profit signals. As you can see there are both Take Profit signals for the Bulls and the Bears. These signals are not meant to be used within automation. In fact, none of this indicator is. These signals are meant to show there has been a strong change in momentum, to such an extent that the signal may switch from its current (Bull or Bear) and now may be a good time to Take Profit. Your Take Profit Settings likewise has a Speed and Strength, and you can set them differently than your Purchase Settings. This is in case you want to Take Profit in a different manner than your Purchase Signals. For instance:
In the example above we’ve kept Purchase Strength and Speed at Medium but we changed our Take Profit Speed from Medium->Snail and our Take Profit Strength from medium->Very Low. This greatly reduces the amount of Take Profit signals, and in some cases, none are even produced. This form of Take Profit may act more as a Trailing Take Profit that if it’s not hit, nothing appears.
In this example we have changed our Purchase Speed from Medium->Fast, our Purchase Strength from Medium->Very Low. We’ve also changed our Take Profit Speed from Snail->Medium and kept our Take Profit Strength on Very Low. Now we may get our signals quicker and likewise our Take Profit may be more rare. There are many different ways you can set up your Purchase and Take Profit Settings to fit your Trading Style / Strategy.
Bull and Bear Zones:
We have disabled our Take Profit locations so that you can see the Bull and Bear Zones. These zones change color when the Signals switch. They may represent some strong Support and Resistance locations, but more importantly may be useful for visualizing changes in momentum and consolidation. These zones allow you to see various Moving Averages; and when they start to ‘fold’ (cross) each other you may see changes in momentum. Whereas, when they’re fully stretched out and moving all in the same direction, it can provide insight that the current rally may be strong. There is also the case where they look like they’re ‘twisted’ together. This happens when all of the Moving Averages are very close together and may be a sign of Consolidation. We will go over a few examples of each of these scenarios so you can understand what we’re referring to.
In this example above, there are a few different things happening. First we have the yellow circle, where the final and slowest Moving Average (MA) crossed over and now all of the MA’s that form the zone are Bullish. You can see this in the white circle where there are no MA’s that are crossing each other. Lastly, within the blue circle, we can see how some of the faster MA’s are crossing under each other. This is a bullish momentum change. The Faster moving MA’s will always be the first ones to cross before the Slower ones do. There is a color scheme in place here to represent the Speed of the MA within the Zone. Light blue is the fastest moving Bull color -> Light Green and finally -> Dark Green. Yellow is the fastest moving Bear color -> Orange and finally -> Red / Dark Red within the Zone.
Next we will review a couple different examples of what Consolidation looks like and why it is very important to look out for. Consolidation is when Most, if not All of the MA’s are very tightly ‘twisted’ together. There is very little spacing between almost all of the MA’s in the example above; highlighted by the white circle. Consolidation is important as it may indicate a strong price movement in either direction will occur soon. When the price is consolidating it means it has had very little upwards or downwards movement recently. When this happens for long enough, MA’s may all get very similar in value. This may cause high volatility as the price tries to break out of Consolidation. Let's look at another example.
Above we have two more examples of what Consolidation looks like and how high Volatility may occur after the Consolidation is broken. Please note, not all Consolidation will create high Volatility but it is something you may want to look out for.
Information Tables displaying: (Boom Meter, Bull/Bear Strength, Yin/Yang State):
Information tables are a very important way of displaying information. It contains 3 crucial pieces of information:
Boom Meter
Bull/Bear Strength
Yin/Yang State
Boom Meter is a meter that goes from 0-100% and displays whether the current price is Dumping (0 - 29%), Consolidating (30 - 70%) or Pumping (71 - 100%). The Boom Meter is meant to be a Gauge to how the price is currently fairing. It is composed of ~50 different calculations that all vary different weights to calculate its %. Many of the calculations it uses are likewise used in other things, such as the Bull/Bear Strength, Bull/Bear Zone MA cross’, Yin/Yang State, Market Cipher Signals, RSI, Volume and a few others. The Boom Meter, although not meant to be used solely to make purchase decisions, may give you a good idea of current market conditions considering how many different things it evaluates.
Bull/Bear Strength is relevant to your Purchase Speed and Strength. It displays which state it is currently in, and the % it is within that state. When a % hits 0, is when the state changes. When states change, they always start at 100% initially and will go down at the rate of Purchase Strength (how many verifications are needed). For instance, if your Purchase Strength is set to ‘Medium’ it will move 10% per verification +/-, if it is set to High, it will move 6.67% per verification +/-. Bull/Bear Strength is a good indicator of how well that current state is fairing. For instance if you started a Long when the state changed to Bull and now it is currently at Bull with 20% left, that may be a good indication it is time to get out (obviously refer to other data as well, but it may be a good way to know that the state is 20% away from transitioning to Bear).
Yin/Yang State is the strongest MA cross within our Indicator. It is unique in the sense that it is slow to change, but not so much that it moves slowly. It isn’t as simple as say a Golden/Death Cross (50/200), but it crosses more often and may hold similar weight as it. Yin stands for Negative (Bearish) and Yang stands for Positive (Bullish). The price will always be in either a state of Yin or Yang, and just because it is in one, doesn’t mean the price can’t/won’t move in the opposite direction; it simply means the price may be favoring the state it is in.
16 Cipher Signals:
Cipher Signals are key visuals of MA cross’ that may represent price movement and momentum. It would be too confusing and hard to decipher these MA’s as lines on a chart, and therefore we decided to use signals in the form of symbols instead. There are 12 Standard and 4 Predictive/Confirming Cipher signals. The Standard Cipher signals are composed of 6 Bullish and 6 Bearish (they all have opposites that balance each other out). There can never be 2 of the same signal in a row, as the Bull and Bear cancel each other out and it's always in a state of one or the other. When all 6 Bullish or Bearish signals appear in a row, very closely together, without any of the opposing signals it may represent a strong momentum movement is about to occur.
If you refer to the example above, you’ll see that the 6 Bullish Cipher signals appeared exactly as mentioned above. Shortly after the Green Circle appeared, there was a large spike in price movement in favor of the Bulls. Cipher signals don’t need to appear in a cluster exactly like the white circle in this photo for momentum to occur, but when it does, it may represent volatility more than if it is broken up with opposing signals or spaced out over a longer time span.
Above is an example of the opposite, where all 6 Bearish Cipher signals appeared together without being broken by a Bullish Cipher signal or being too far spaced out. As you can see, even though past it there was a few Bullish signals, they were quickly reversed back to Bearish before a large price movement occurred in favor of the Bears.
In the example above we’ve changed Cipher signals to Predictive and Confirming. Support Crosses (Green +) and Blood Diamonds (Red ♦) are the normal Cipher Signals that appear within the Standard Set. They are the first Cipher Signal that appears and are the most common ones as well. However, just because they are the first, that doesn’t mean they aren’t a powerful Cipher signal. For this reason, there are Predictive and Confirming Cipher signals for these. The Predictive do just that, they appear slightly sooner (if not the same bar) as the regular and the Confirming appear later (1+ bars usually). There will be times that the Predictive appears, but it doesn’t resort to the Regular appearing, or the Regular appears and the Confirming doesn’t. This is normal behavior and also the purpose of them. They are meant to be an indication of IF they may appear soon and IF the regular was indeed a valid signal.
Extremes:
Extremes are MA’s that have a very large length. They are useful for seeing Cross’ and Support and Resistance over a long period of time. However, because they are so long and slow moving, they might not always be relevant. It’s usually advised to turn them on, see if any are close to the current price point, and if they aren’t to turn them off. The main reason being is they stretch out the chart too much if they’re too far away and they also may not be relevant at that point.
When they are close to the price however, they may act as strong Support and Resistance locations as circled in the example above.
Pivots:
Pivots are used to help identify key Support and Resistance locations. They adjust on their own in an attempt to keep their locations as relevant as possible and likewise will adjust when the price pushes their current bounds. They may be useful for seeing when the Price is currently testing their level as this may represent Overbought or Oversold. Keep in mind, just because the price is testing their levels doesn’t mean it will correct; sometimes with high volatility or geopolitical news, movement may continue even if it is exhibiting Overbought or Oversold traits. Pivots may also be useful for seeing how far the price may correct to, giving you a benchmark for potential Take Profit and Stop Loss locations.
Trend Lines:
Trend Lines may be useful for identifying Support and Resistance locations on the Vertical. Trend Lines may form many different patterns, such as Pennants, Channels, Flags and Wedges. These formations may help predict and drive the price in specific directions. Many traders draw or use Indicators to help create Trend Lines to visualize where these formations will be and they may be very useful alone even for identifying possible Support and Resistance locations.
If you refer to the previous example, and now to this example, you’ll notice that the Trend Line that supported it in 2023 was actually created in June 2020 (yellow circle). Trend Lines may be crucial for identifying Support and Resistance locations on the Vertical that may withhold over time.
Custom Bollinger Bands:
Bollinger Bands are used to help see Movement vs Consolidation Zones (When it's wide vs narrow). It's also very useful for seeing where the correction areas may be. Price may bounce between top and bottom of the Bollinger Bands, unless in a pump or dump. The Boom Meter will show you whether it is currently: Dumping, Consolidation or Pumping. If combined with Boom Meter Bar Colors it may be a good indication if it will break the Bollinger Band (go outside of it). The Middle Line of the Bollinger Band (White Line) may be a very strong support / resistance location. If the price closes above or below it, it may be a good indication of the trend changing (it may indicate one of the first stages to a pump or dump). The color of the Bollinger Bands change based on if it is within a Bull or Bear Zone.
What makes this Bollinger Band special is not only that it uses a custom multiplier, but it also incorporates volume to help add weight to the calculation.
Boom Meter Bar Colors:
Boom Meter Bar Colors are a way to see potential Overbought and Oversold locations on a per bar basis. There are 6 different colors within the Boom Meter bar colors. You have:
Overbought and Very Bullish = Dark Green
Overbought and Slightly Bullish = Light Green
Overbought and Slight Bearish = Light Red
Oversold and Very Bearish = Dark Red
Oversold and Slightly Bearish = Orange
Oversold and Slightly Bullish = Light Purple
When there is no Boom Meter Bar Color prevalent there won’t be a color change within the bar at all.
Just because there is a Boom Meter Bar Color change doesn’t mean you should act on it purchase or sell wise, but it may be an indication as to how that bar is fairing in an Overbought / Oversold perspective. Boom Meter Bar Colors are mainly based on RSI but do take in other factors like price movement to determine if it is Overbought or Oversold. When it comes to Boom Meter Bar Color, you should take it as it is, in the sense that it may be useful for seeing how Individual bars are fairing, but also note that there may be things such as:
When there is Very Overbought (Dark Green) or Very Oversold (Dark Red), during massive pump or dumps, it will maintain this color. However, once it has lost ‘some’ momentum it will likely lose this color.
When there has been a massive Pump or Dump, and there is likewise a light purple or light red, this may mean there is a correction or consolidation incoming.
True Value Zones:
True Value zones are our custom way of displaying something that is similar to a Bollinger Band that can likewise twist like an MA cross. The main purpose of it is to display where the price may reside within. Much like a Bollinger Band it has its High and Low within its zone to specify this location. Since it has the ability to cross over and under, it has the ability to specify what it thinks may be a Bullish or Bearish zone. This zone uses its upper level to display what may be a Resistance location and its lower level to display what may be a Support location. These Support and Resistance locations are based on Momentum and will move with the price in an attempt to stay relevant.
You may use these True Values zones as a gauge of if the price is Overbought or Oversold. When the price faces high volatility and moves outside of the True Value Zones, it may face consolidation or likewise a correction to bring it back within these zones. These zones may act as a guideline towards where the price is currently valued at and may belong within.
Bar Strength Indexes:
Bar Strength Indexes are our way of ranking each bar in correlation to the last few. It is based on a few things but is highly influenced on Open/Close/High/Low, Volume and how the price has moved recently. They may attempt to ‘rate’ each bar and how Bullish/Bearish each of these bars are. The Green number under the bar is its Bullish % and the Red number above the bar is its Bearish %. These %’s will always equal 100% when combined together. Bar Strength Indexes may be useful for seeing when either Bullish or Bearish momentum is picking up or when there may be a reversal / consolidation.
These Bar Strength Indexes may allow you to decipher different states. If you refer to the example above, you may notice how based on how the numbers are changing, you may see when it has entered / exited Bullish, Bearish and Consolidation. Likewise, if you refer to the current bar (yellow circle), you can see that the Bullish % has dropped from 93 to 49; this may be signifying that the Bullish movement is losing momentum. You may use these changes in Bar Indexes as a guide to when to enter / end trades.
Volume Profile:
Volume Profile has been something that has been within TradingView for quite some time. It is a very useful way of seeing at what Horizontal Price there has been the most volume. This may be very useful for seeing not only Support and Resistance locations based on Volume, but also seeing where the majority of Limit Orders are placed. Limit Orders are where traders decide they want to either Buy / Sell but have the order placed so the trade won’t happen until the price reaches a certain amount. Either through many orders from many traders, or a single order from a ‘Whale’ (trader with a lot of capital); you may see Support and Resistance at specific Price Points that have large Volume.
Many Volume Profile Indicators feature a breakdown of all the different locations of volume, along with a Point Of Control (POC) line to designate where the most Volume has been. To try and reduce clutter within our already very saturated Toolkit Indicator, we’ve decided to strip our Volume Profile to only display this POC line. This may allow you to see where the crucial Volume Support and Resistance is without all of the clutter.
You may be wondering, well how important is this Volume Profile POC line and how do I go about using it? Aside from it being a gauge towards where Support and Resistance may be within Volume, it may also be useful for identifying good Long/Short locations. If you think of the line as a ‘Battle’ between the Bulls and Bears, they’re both fighting over that line. The Bears are wanting to break through it downwards, and the Bulls are wanting to break through it upwards. When one side has temporarily won this battle, this means they may have more Capital to push the price in their direction. For instance, if both the Bulls and the Bears are fighting over this POC price, that means the Bears think that price is a good spot to sell; however, the Bulls also deem that price to be a good point to buy. If the Bulls were to win this battle, that means the Bears either canceled their orders to reevaluate, or all of their orders have been completed from the Bulls buying them all. What may happen after that is, if the Bulls were able to purchase all of these Limit Sell Orders, then they may still have more Capital left to continue to pressure the price upwards. The same may be true for if the Bears were to win this ‘Battle’.
How to use YinYang Trend as a cohesive whole:
Hopefully you’ve read and understand how each aspect of this Indicator works on its own, as knowing how/what they each do is important to understanding how it is used as a cohesive whole. Due to the fact that this Toolkit of an Indicator displays so much data, you may find it easier to use and understand when you’re zoomed in a little, somewhat like we are in this example above.
If we refer to the example above, you may like us, deduce a few things:
1. The current price may be VERY Overbought. This may be seen by a few different things:
The Boom Meter Bar Colors have been exhibiting a Dark Green color for 6 bars in a row.
The price has continuously been moving the High (red) Pivot Upwards.
Our Boom Meter displays ‘Pumping’ at 100%.
The price broke through a Downward Trend Line that was created in February of 2022 at 45,000 like it was nothing.
The Bar Strength Index hit a Bullish value of 93%.
The Price broke out of the Bollinger Bands and continues to test its upper levels.
The Low is much greater than our fastest moving MA that creates the Purchase Zones.
The Price is vastly outside of the True Value Zone.
The Bar Strength Index of our current bar is 50% bullish, which is a massive decrease from the previous bar of 93%. This may indicate that a correction is coming soon.
2. Since we’ve identified the current price may be VERY Overbought, next we need to identify if/when/to where it may correct to:
We’ve created a new example here to display potential correction areas. There are a few places it has the ability to correct to / within:
The downward Trend Line (red) below the current bar sitting currently at 32,750. This downward Trend Line is at the same price point as the Fastest MA of our Purchase Zone which may provide some decent Support there.
Between two crucial Pivot heights, within a zone of 30,000 to 31,815. This zone has the second fastest MA from the Purchase Zone right near the middle of it at 31,200 which may act as a Support within the Zone. Likewise there is the Bollinger Band Basis which is also resting at 30,000 which may provide a strong Support location here.
If 30,000 fails there may be a correction all the way to the bottom of our True Value Zone and the top of one of our Extremes at 27,850.
If 27,850 fails it may correct all the way to the bottom of our Purchase Zone / lowest of our Extremes at 27,350.
If all of the above fails, it may test our Volume Profile POC of 26,430. If this POC fails, the trend may switch to Bearish and continue further down to lower levels of Support.
The price can always correct more than the prices mentioned above, but considering overall this Indicator is favoring the Bulls, we will tailor this analysis in Favor of the Bullish Momentum maintaining even during this correction. For these reasons, we think the price may correct between the 30,000 and 31,815 zone before continuing upwards and maintaining this Bullish Momentum.
Please note, these correction estimates are just that, they’re estimates. Aside from the fact that the price is very overbought right now and our Bar Strength Index may be declining (bar hasn’t closed yet); the Boom Meter Strength remains at 100%, meaning there may not be much Bearish momentum changes happening yet. We just want to show you how an Preemptive analysis may be done before there are even Bearish Cipher Signals appearing.
Using this Indicator, you may be able to decipher Entry and Exits. In the previous example, we went over how you may use it to see where a correction (Exit / Take Profit) may be and how far this correction may go. In this example above we will be discussing how to identify Entry locations. We will be discussing a Bullish Buy entry but the same rules apply for a Bearish Sell Entry just the opposite with the Cipher Signals.
If you refer to where we circled in white, this is where the Purchase Zones faced Consolidation. When the Purchase Zones all get tight and close together like that, this may represent Volatility and Momentum in either direction may occur soon.
This was then followed by all 6 of the Standard Cipher Signals closely in succession to each other. This means the Momentum may be favoring the Bulls. If this was likewise all 6 of the Bearish Cipher Signals closely in succession, than the momentum change would favor the Bears.
If you were looking for an entry, and you saw Consolidation with the Purchase Zones and then shortly after you saw the Green Circle and Blue Flag (they can swap order); this may now be a good Entry location.
We will conclude this Tutorial here. Hopefully this has taught you how this Trend Analysis Toolkit may help you locate multiple different types of important Support and Resistance locations; as well as possible Entry and Exit locations.
Settings:
1. Bull/Bear Zones:
1.1. Purchase Speed (Bull/Bear Signals and Take Profit Signals):
Speed determines how much price movement is needed for a signal to occur.
'Sonic' uses the extremities to try and get you the best entry and exit points, but is so quick, its speed may reduce accuracy.
'Fast' may attempt to capitalize on price movements to help you get SOME or attempt to lose LITTLE quickly.
'Medium' may attempt to get you the most optimal entry and exit locations, but may miss extremities.
'Slow' may stay in trades until it is clear that momentum has changed.
'Snail' may stay in trades even if momentum has changed. Snail may only change when the price has moved significantly (This may result in BIG gains, but potentially also BIG losses).
1.2. Purchase Strength (Bull/Bear Signals and Take Profit Signals):
Strength ensures a certain amount of verifications required for signals to happen. The more verifications the more accurate that signal is, but it may also change entry and exit points, and you may miss out on some of the extremities. It is highly advised to find the best combination between Speed and Strength for the TimeFrame and Pair you are trading in, as all pairs and TimeFrames move differently.
'High' uses 15 verifications to ensure signal strength.
'Medium' uses 10 verifications to ensure signal strength.
'Low' uses 5 verifications to ensure signal strength.
'Very Low' uses 3 verifications to ensure signal strength.
2. Cipher Signals:
Cipher Signals are very strong EMA and SMA crosses, which may drastically help visualize movement and help you to predict where the price will go. All Symbols have counter opposites that cancel each other out (YinYang). Here is a list, in order of general appearance and strength:
White Cross / Diamond (Predictive): The initial indicator showing trend movement.
Green Cross / Diamond (Regular): Confirms the Predictive and may add a fair bit of strength to trend movement.
Blue Cross / Diamond (Confirming): Confirms the Regular, showing the trend might have some decent momentum now.
Green / Red X: Gives momentum to the current trend direction, possibly confirming the Confirming Cross/Diamond.
Blue / Orange Triangle: may confirm the X, Possible pump / dump of decent size may be coming soon.
Green / Red Circle: EITHER confirms the Triangle and may mean big pump / dump is potentially coming, OR it just hit its peak and signifies a potential reversal correction. PAY ATTENTION!
Green / Red Flag: Oddball that helps confirm trend movements on the short term.
Blue / Yellow Flag: Oddball that helps confirm trend movements on the medium term (Yin / Yang is the long term Oddball).
3. Bull/Bear Signals:
Bear and Bull signals are where the momentum has changed enough based on your Purchase Speed and Strength. They generally represent strong price movement in the direction of the signal, and may be more reliable on higher TimeFrames. Please don’t use JUST these signals for analysis, they are only meant to be a fraction of the important data you are using to make your technical analysis.
4. Take Profit Signals:
Take Profit signals are guidelines that momentum has started to change back and now may be a good time to take profit. Your Take Profit signals are based on your Take Profit Speed and Strength and may be adjusted to fit your trading style.
5. Information Tables:
Information tables display very important data and help to declutter the screen as they are much less intrusive compared to labels. Our Information tables display: Boom Meter, Purchase Strength of Bull/Bear Zones and Yin/Yang State.
Boom Meter: Uses over 50 different calculations to determine if the pair is currently 'Dumping' (0-29%), 'Consolidating' (30-70%), or 'Pumping' (71-100%).
Bull / Bear Strength: Shows the strength of the current Bull / Bear signal from 0-100% (Signals start at 100% and change when they hit 0%). The % it moves up or down is based on your 'Purchase Strength'.
Yin / Yang state: Is one of the strongest EMA/SMA crosses (long term Oddball) within this Indicator and may be a great indication of which way the price is moving. Do keep in mind if the price is consolidating when changing state, it may have the highest chance of switching back also. Once momentum kicks in and there is price movement the state may be confirmed. Refer to other Cipher Symbols, Extremes, Trend, BOLL, Boom %, Bull / Bear % and Bar colors when Bull / Bear Zones are consolidating and Yin / Yang State changes as this is a very strong indecision zone.
6. Bull / Bear Zones:
Our Bull / Bear zones are composed of 8 very important EMA lengths that may act as not only Support and Resistance, but they help to potentially display consolidation and momentum change. You can tell when they are getting tight and close together it may represent consolidation and when they start to flip over on each other it may represent a change in momentum.
7. MA Extremes:
Our MA Extremes may be 3 of the most important long term moving averages. They don’t always play a role in trades as sometimes they’re way off from the price (cause they’re extreme lengths), but when they are around price or they cross under or over each other, it may represent large changes in price are about to occur. They may be very useful for seeing strong resistance / support locations based on price averages. Extremes may transition from a Support to a Resistance based on its position above or below them and how many times the price has either bounced up off them (Supporting) or Bounced back down after hitting them (Resistance).
8. Pivots:
Pivots may be a very important indicator of support and resistance for horizontal price movement. Pivots may represent the current strongest Support and Resistance. When the Pivot changes, it means a new strong Support or Resistance has been created. Sometimes you'll notice the price constantly pushes the pivot during a massive Pump or Dump. This is normal, and may indicate high levels of volatility. This generally also happens when the price is outside of the Bollinger Bands and is also Over or Undervalued. The price usually consolidates for a while after something like this happens before more drastic movement may occur.
9. Trend Lines:
Trend lines may be one of the best indicators of support and resistance for diagonal price movement. When a Trend Line fails to hold it may be a strong indication of a dump. Keep a close eye to where Upward and Downward Trend Lines meet. Trend lines can create different trading formations known as Pennants, Flags and Wedges. Please familiarize yourself with these formations So you know what to look for.
10. Bollinger Bands (BOLL):
Bollinger Bands may be very useful, and ours have been customized so they may be even more accurate by using a modified calculation that also incorporates volume.
Bollinger Bands may be used to see Movement vs Consolidation Zones (When it’s wide vs narrow). It also may be very useful for seeing where the correction areas are likely to be. Price may bounce between top and bottom of the BOLL, unless perhaps in a pump or dump. The Boom Meter may show you whether it is currently: Dumping, Consolidation or Pumping, along with Boom Meter Bar Colors, may be a good indication if it will break the BOLL. The Middle Line of the BOLL (White Line) may be a very strong support / resistance line. If the price closes above or below it, it may be a good indication of the trend changing (it may be one of the first stages to a pump or dump).
11. Boom Meter Bar Colors:
Boom Meter bar colors may be very useful for seeing when the bar is Overbought or Underbought. There are 6 different types of boom meter bar colors, they are:
Dark Green: RSI may be very Overbought and price going UP (May be in a big pump. NOTICE, chance of small dump correction if Cherry Red bar appears).
Light Green: RSI may be slightly Overbought and price going UP (chance of small pump).
Light Purple: RSI may be very Underbought and price going UP (May have chance of small correction).
Dark Red: RSI may be very Underbought and price going DOWN (May be in a big dump. NOTICE, chance of small pump correction if Light Purple bar appears).
Light Orange: RSI may be slightly Underbought and price going DOWN (chance of small dump).
Cherry Red: RSI may be very Overbought and price going DOWN (Chance of small correction).
12. True Value Zone:
True Value Zones display zones that represent ranges to show what the price may truly belong within. They may be very useful for knowing if the Price is currently not valued correctly, which generally means a correction may happen soon. True Value Zones can swap from Bullish to Bearish and are represented by Red for Bearish and Green for Bullish. For example, if the price is ABOVE and OUTSIDE of the True Value Zone, this means it may be very overvalued and might correct to go back inside the True Value Zone. This correction may be done by either dumping in price back into the zone, or consolidating horizontally back into it over a longer period of time. Vice Versa is also true if it is BELOW and OUTSIDE of the True Value Zone.
13. Bar Strength Index:
Bar Strength Index may display how Bullish/Bearish the current bar is. The strength is important to help see if a pump may be losing momentum or vice versa if a dump may correct. Keep in mind, the Bar Strength Index does a small 'refresh' to account for new bars. It may help to keep the Index more accurate.
14. Volume Profile:
Volume Profiles may be important to know where the Horizontal Support/Resistance is in Price base on Volume. Our Volume Profile may identify the point where the most volume has occurred within the most relevant timeframe. Volume Profiles are helpful at identifying where Whales have their orders placed. The reason why they are so helpful at identifying whales is when the volume is profiled to a specific area, there may likely be lots of Limit Buy and/or Sells around there. Limit Buys may act as Support and Limit Sells may act as Resistance. It may be very useful to know where these lie within the price, similar to looking at Order Book Data for Whale locations.
If you have any questions, comments, ideas or concerns please don't hesitate to contact us.
HAPPY TRADING!

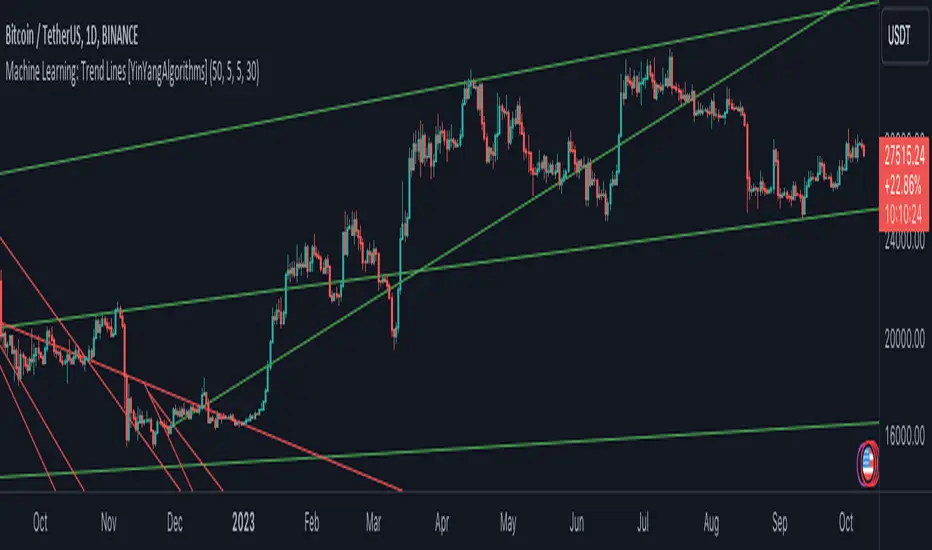
Machine Learning: Trend Lines [YinYangAlgorithms]Trend lines have always been a key indicator that may help predict many different types of price movements. They have been well known to create different types of formations such as: Pennants, Channels, Flags and Wedges. The type of formation they create is based on how the formation was created and the angle it was created. For instance, if there was a strong price increase and then there is a Wedge where both end points meet, this is considered a Bull Pennant. The formations Trend Lines create may be powerful tools that can help predict current Support and Resistance and also Future Momentum changes. However, not all Trend Lines will create formations, and alone they may stand as strong Support and Resistance locations on the Vertical.
The purpose of this Indicator is to apply Machine Learning logic to a Traditional Trend Line Calculation, and therefore allowing a new approach to a modern indicator of high usage. The results of such are quite interesting and goes to show the impacts a simple KNN Machine Learning model can have on Traditional Indicators.
Tutorial:
There are a few different settings within this Indicator. Many will greatly impact the results and if any are changed, lots will need ‘Fine Tuning’. So let's discuss the main toggles that have great effects and what they do before discussing the lengths. Currently in this example above we have the Indicator at its Default Settings. In this example, you can see how the Trend Lines act as key Support and Resistance locations. Due note, Support and Resistance are a relative term, as is their color. What starts off as Support or Resistance may change when the price crosses over / under them.
In the example above we have zoomed in and circled locations that exhibited markers of Support and Resistance along the Trend Lines. These Trend Lines are all created using the Default Settings. As you can see from the example above; just because it is a Green Upwards Trend Line, doesn’t mean it’s a Support Line. Support and Resistance is always shifting on Trend Lines based on the prices location relative to them.
We won’t go through all the Formations Trend Lines make, but the example above, we can see the Trend Lines formed a Downward Channel. Channels are when there are two parallel downwards Trend Lines that are at a relatively similar angle. This means that they won’t ever meet. What may happen when the price is within these channels, is it may bounce between the upper and lower bounds. These Channels may drive the price upwards or downwards, depending on if it is in an Upwards or Downwards Channel.
If you refer to the example above, you’ll notice that the Trend Lines are formed like traditional Trend Lines. They don’t stem from current Highs and Lows but rather Machine Learning Highs and Lows. More often than not, the Machine Learning approach to Trend Lines cause their start point and angle to be quite different than a Traditional Trend Line. Due to this, it may help predict Support and Resistance locations at are more uncommon and therefore can be quite useful.
In the example above we have turned off the toggle in Settings ‘Use Exponential Data Average’. This Settings uses a custom Exponential Data Average of the KNN rather than simply averaging the KNN. By Default it is enabled, but as you can see when it is disabled it may create some pretty strong lasting Trend Lines. This is why we advise you ZOOM OUT AS FAR AS YOU CAN. Trend Lines are only displayed when you’ve zoomed out far enough that their Start Point is visible.
As you can see in this example above, there were 3 major Upward Trend Lines created in 2020 that have had a major impact on Support and Resistance Locations within the last year. Lets zoom in and get a closer look.
We have zoomed in for this example above, and circled some of the major Support and Resistance locations that these Upward Trend Lines may have had a major impact on.
Please note, these Machine Learning Trend Lines aren’t a ‘One Size Fits All’ kind of thing. They are completely customizable within the Settings, so that you can get a tailored experience based on what Pair and Time Frame you are trading on.
When any values are changed within the Settings, you’ll likely need to ‘Fine Tune’ the rest of the settings until your desired result is met. By default the modifiable lengths within the Settings are:
Machine Learning Length: 50
KNN Length:5
Fast ML Data Length: 5
Slow ML Data Length: 30
For example, let's toggle ‘Use Exponential Data Averages’ back on and change ‘Fast ML Data Length’ from 5 to 20 and ‘Slow ML Data Length’ from 30 to 50.
As you can in the example above, all of the lines have changed. Although there are still some strong Support Locations created by the Upwards Trend Lines.
We will conclude our Tutorial here. Hopefully you’ve learned how to use Machine Learning Trend Lines and will be able to now see some more unorthodox Support and Resistance locations on the Vertical.
Settings:
Use Machine Learning Sources: If disabled Traditional Trend line sources (High and Low) will be used rather than Rational Quadratics.
Use KNN Distance Sorting: You can disable this if you wish to not have the Machine Learning Data sorted using KNN. If disabled trend line logic will be Traditional.
Use Exponential Data Average: This Settings uses a custom Exponential Data Average of the KNN rather than simply averaging the KNN.
Machine Learning Length: How strong is our Machine Learning Memory? Please note, when this value is too high the data is almost 'too' much and can lead to poor results.
K-Nearest Neighbour (KNN) Length: How many K-Nearest Neighbours are allowed with our Distance Clustering? Please note, too high or too low may lead to poor results.
Fast ML Data Length: Fast and Slow speed needs to be adjusted properly to see results. 3/5/7 all seem to work well for Fast.
Slow ML Data Length: Fast and Slow speed needs to be adjusted properly to see results. 20 - 50 all seem to work well for Slow.
If you have any questions, comments, ideas or concerns please don't hesitate to contact us.
HAPPY TRADING!
Ehlers DecyclerJohn F. Ehlers introuced Decycler in his book "Cycle Analytics for Traders", chapter 4.
The decycler is designed to remove the influence of shorter cycle fluctuations, resulting in an output that closely resembles a one-pole low-pass filter.
A standout feature of the decycler is its notably minimal lag. The most extended cycle elements experience a delay of less than five bars. When considering a frequency of 0.05 cycles per bar (equivalent to a 20-bar cycle period), the lag approximates 1.5 bars. Components with a higher frequency face even lesser delays. Consequently, any higher-frequency variations that pass the filter's attenuation align closely with the price fluctuations. This makes the decycler an optimal "immediate trend detector," giving a true depiction of the data's trend.
While the SuperSmoother filter can yield a comparably smoothed output, the decycler typically exhibits less lag when the two are juxtaposed. It's worth noting that the decycler operates as a one-pole filter, implying it doesn't have the best filtering capabilities. It's not advisable to use the decycler as a smoothing filter to eliminate aliasing disturbances. Instead, its application should focus on generating an immediate trend representation, especially when choosing a larger cutoff period. The broad cutoff period equips the decycler with the ability to reduce aliasing disturbances, given that it's significantly distant from the Nyquist frequency.
There are already several decycler indicators on Tradingview, but I like to structure the code and highlight the main components as functions rather than hiding them in the code. I hope this is useful for those who are starting to learn Pine Script.

Traders Trend DashboardThe Traders Trend Dashboard (TTD) is a comprehensive trend analysis tool designed to assist traders in making informed trading decisions across various markets and timeframes. Unlike conventional trend-following scripts, TTD goes beyond simple trend detection by incorporating a unique combination of moving averages and a visual dashboard, providing traders with a clear and actionable overview of market trends. Here's how TTD stands out from the crowd:
Originality and Uniqueness:
TTD doesn't rely on just one moving average crossover to detect trends. Instead, it employs a dynamic approach by comparing two moving averages of distinct periods across multiple timeframes. This innovative methodology enhances trend detection accuracy and reduces false signals commonly associated with single moving average systems.
Market Applicability:
TTD is versatile and adaptable to various financial markets, including forex, stocks, cryptocurrencies, and commodities. Its flexibility ensures that traders can utilize it across different asset classes and capitalize on market opportunities.
Optimal Timeframe Utilization:
Unlike many trend indicators that work best on specific timeframes, TTD caters to traders with diverse trading preferences. It offers support for intraday trading (1m, 3m, 5m), short-term trading (15m, 30m, 1h), and swing trading (4h, D, W, M), making it suitable for a wide range of trading styles.
Underlying Conditions and Interpretation:
TTD is particularly effective during trending markets, where its multi-timeframe approach helps identify consistent trends across various time horizons. In ranging markets, TTD can indicate potential reversals or areas of uncertainty when moving averages converge or cross frequently.
How to Use TTD:
1. Timeframe Selection: Choose the relevant timeframes based on your trading style and preferences. Enable or disable timeframes in the settings to focus on the most relevant ones for your strategy.
2. Dashboard Interpretation: The TTD dashboard displays green (🟢) and red (🔴) symbols to indicate the relationship between two moving averages. A green symbol suggests that the shorter moving average is above the longer one, indicating a potential bullish trend. A red symbol suggests the opposite, indicating a potential bearish trend.
3. Confirmation and Strategy: Consider TTD signals as confirmation for your trading strategy. For instance, in an uptrend, look for long opportunities when the dashboard displays consistent green symbols. Conversely, in a downtrend, focus on short opportunities when red symbols dominate.
4. Risk Management: As with any indicator, use TTD in conjunction with proper risk management techniques. Avoid trading solely based on indicator signals; instead, integrate them into a comprehensive trading plan.
Conclusion:
The Traders Trend Dashboard (TTD) offers traders a powerful edge in trend analysis, combining innovation, versatility, and clarity. By understanding its unique methodology and integrating its signals with your trading strategy, you can make more informed trading decisions across various markets and timeframes. Elevate your trading with TTD and unlock a new level of trend analysis precision.
Linear On MACDUnlocking the Magic of Linear Regression in TradingView
In the ever-evolving world of financial markets, traders and investors seek effective tools to gauge price movements, make informed decisions, and achieve their financial goals. One such tool that has proven its worth over time is linear regression, a mathematical concept that has found its way into technical analysis and trading strategies. In this blog post, we will explore the magic behind linear regression, delve into its history, and understand how it's widely used as a technical indicator.
The Birth of Linear Regression: From Mathematics to Trading
Linear regression is a statistical method that aims to model the relationship between two variables by fitting a linear equation to observed data. The formula for a linear regression line is typically expressed as y = a + bx, where y is the dependent variable, x is the independent variable, a is the intercept, and b is the slope.
While the roots of linear regression trace back to the field of statistics, it didn't take long for traders and investors to recognize its potential in the financial world. By applying linear regression to historical price data, traders can identify trends, assess the relationship between variables, and even predict potential future price levels.
The Linear On MACD Strategy
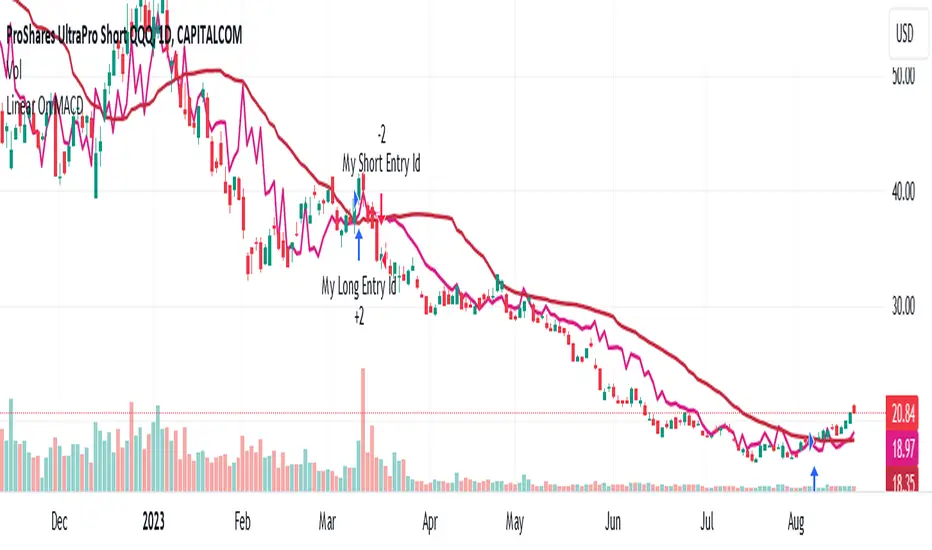
Let's take a closer look at a powerful example of how linear regression is employed in a trading strategy right within TradingView. The "Linear On MACD" strategy harnesses the potential of linear regression in conjunction with the Moving Average Convergence Divergence (MACD) indicator. The goal of this strategy is to generate buy and sell signals based on the interactions between the predicted stock price and the MACD indicator.
Here's a breakdown of the strategy's components:
Calculation of Linear Regression: The strategy begins by calculating linear regression coefficients for the historical stock price based on volume. This helps predict potential future price levels.
Predicted Stock Price: The linear regression results are then used to plot the predicted stock price on the chart. This provides a visual representation of where the price could trend based on historical data.
Buy and Sell Signals: The strategy generates buy signals when certain conditions are met. These conditions include the predicted stock price being between the open and close prices, a rising MACD, and other factors that suggest a potential bullish trend. On the other hand, sell signals are generated based on MACD trends and predicted price levels.
Risk Management: The strategy also incorporates risk tolerance levels to determine entry and exit points. This ensures that traders take into account their risk appetite when making trading decisions.
Embracing the Magic of Linear Regression
As we explore the "Linear On MACD" strategy, we uncover the power of linear regression in aiding traders and investors. Linear regression, a mathematical marvel, seamlessly merges with technical analysis to provide insights into potential price movements. Its historical significance in statistics blends perfectly with the demands of modern financial markets.
Whether you're a seasoned trader or a curious investor, the Linear On MACD strategy exemplifies how a robust mathematical concept can be harnessed to make informed trading decisions. By embracing the magic of linear regression, you're tapping into a tool that continues to evolve alongside the financial world it empowers.
Disclaimer: The information provided in this blog post is for educational purposes only and does not constitute financial advice. Trading and investing carry risks, and it's important to conduct thorough research and consider seeking professional advice before making any trading decisions.
TrapZone ProThis script combines the concepts of Price Action, Trend and Momentum to identify Price Zones (Red and Green filled areas) and Price Bars (Red, Green and Gray) where traders can get trapped in the Market.
It will clearly mark the bars which favor the prevailing Trend and those bars which just don't have the momentum anymore. TrapZone moves with the market trend and will often provide it support. As the TrapZone changes direction & its color, traders can change their trade bias.
Features:
Identify strong & weak price action - By leveraging a regression calculation of price movement on Y axis against the x axis, we identify the strength of current bars. Increasing relative strength of bars indicate Bullish (Green Bars) & Bearish (Red Bars) price movement, respectively. As the relative strength starts to decrease in Bullish or Bearish price action, the indicator immediately changes the color of these bars to Gray (by default). We call these TrapBars .
Current price trend - By using the highs and lows of price in multiple periods, we are calculating the trend of the price. The Bullish trend is shown by the Green zone and Bearish trend is shown by the Red zone. These zones are the shaded areas which are plotted on the chart. If the price is in these Zones, Longs or Short trades are not advised as that price action is weak. We call these TrapZones .
Strength of the Momentum - the thickness of the TrapZone shows the strength of the current Bullish or Bearish trend. That means the wider the shaded area grows the stronger is the current market momentum. A Flat TrapZone indicates sideways price action.
Knowing when NOT to Trade is as important as when to Trade. While this indicator is designed to avoid taking bad trades such as FOMO, Catching a Falling Knife or Fighting The Trend , it successfully reveals the good trade setups!
How these features of this indicator helps Traders avoids common mistakes:
FOMO or Fear of Missing Out - If a Trader Sees TrapBars in a Bullish or Bearish Trend, they will avoid entry as the price action is weak at that time. This will avoid late entries.
Catching a Falling Knife (a.k.a. Picking a Bottom) - When Red TrapZone is being plotted, Traders can avoid taking Long Entries hoping for a price reversal.
Fighting The Trend (a.k.a Picking a Top) - When Green TrapZone is being plotted, Traders can avoid taking Short entries hoping for a price reversal.
TrapZone Pro does all this in a single panel of the chart irrespective of the market or timeframe.
How to use TrapZone Pro indicator for trading [
A. Market Analysis
Green TrapZone is Bullish and traders should not take Shorts. If Green TrapZone is moving higher, Market is Strong
Red TrapZone is Bearish and traders should not take Longs. If Red TrapZone is moving Lower, Market is Strong
No trades when TrapBars are forming
No trades inside the TrapZone
B. Trade Guidance System
Establish Market Bias - Bullish or Bearish using the TrapZone Color
Only Enter Long in Long Color Bars i.e. Green by default
Only Enter Short in Short Color Bars i.e. Red by default
3 Classes of Trades are Possible Class A, B & C. A being the best Reward : Risk ratio and C being the least rewarding. So use trade size accordingly.
Class A - Best bars are always the first & Second, close to the TrapZone
Class B - Long Bar or Short Bar Forming after TrapBar away from the TrapZone in a Strong Market
Class C - Long Bar or Short Bar Forming after TrapBar close to the TrapZone in a Flat Market (identified by Flat TrapZone )
Take profits when Price moves away from the TrapZone & TrapBars start forming OR Your Target is hit !
See a few examples of Trade Classes & Entries/ Exits for a better understanding
Recommendations
Select Session to “Electronic Trading Hours” in chart settings so you can see the Post & Pre Market trading as well. You can change the color of these sessions to the same color as chart background, so it is not distracting.
Start by Trading in the Hourly or Daily time frame to get used to the new indicator and its Trade Guidance System .
Position Size is the best form of Risk Management. Have a fixed dollar loss per trade pre-determined and adjust the size based on market volatility.
Even though this indicator is designed to work on any market or timeframe, trade the markets that you are familiar with and timeframe that matches your lifestyle. Your understanding of the instrument's behavior and knowledge of what makes it move is valuable.
Basic Set-Up
Add the Indicator to the chart
Open Chart Settings and in Symbol Section
Switch off “ Borders ”
Switch off “ Wick ” or Change the colors to a same non-distracting color like Black or Gray
Open TrapZone Pro Settings
Set the colors for the “ Long Bars ”, “ Short Bars ” & “ No Entry Bars ” if you wish to change the default colors
Change “ TrapZone ” colors to your Taste or leave the defaults
Green for “Color 0” that represents Bullish Price Action
Red for “Color 1” that represents Bearish Price Action
Important Advice & Disclaimer: This indicator does not guarantee that you will make money. It is a tool that performs market analysis for you and presents it in a easy to consume fashion. Markets are truly random and can change direction on a dime. You must use prudent risk and money management strategy based on your investor profile, investment objectives and risk appetite.
To Get Access - See Author’s instructions below

Pivot Point Trend LineThis Indicator simply draw lines between high pivot points and low points.
in the code by default its used tradingview default ta.pivothigh and ta.pivotlow function to get the high and low points.
it will generate recent 4 lines of high and low pivot points.
you can change the no of days for both highs and lows pivot points.
this script is not generating any buy or sell signals its just autodraw and connect 2 pivot points. so you dont have to do it manually.

Breakout Band v1.0This indicator uses a custom source to define a point of relativity to which regions are based off to aid in technical analysis.
Breakout Band's use is:
- Monitoring trends
- Defining trends
- Defining areas of consolidation
- Trend support / resistance levels
- Aid in technical analysis
However, the band provides information different to that of an EMA, as they are not created from the same source, ref Fig 1.
---
Fig 1
Breakout Band compared to an EMA, both with a length setting of 20.
---
The primary band uses your charts timeframe to plot the band. This can be useful for more immediate information, ref Fig 2.
Fig 2
BTC on a 15m chart with Breakout Band's Chart Timeframe option.
---
There is also a functionality for a higher timeframe band to be plotted ( currently limited to 4 higher timeframes ) which can help to view higher timeframe moves with lower timeframe information, ref Fig 3. The higher timeframe band has an added smoothing effect.
Fig 3.
The same chart as referenced in Fig 2., while using Breakout Bands HTF option ( 60m band ).
---
USING BREAKOUT BAND
The band provides potential areas of consolidation, as seen in Fig 4., and when price action falls outside of the band, it can be considered trending.
Fig 4.
Defining areas of consolidation, trends, and monitor trends with Breakout Band.
---
Different zones are given different colors. The closer to the middle of the band, the higher chance of reactivity. Meaning, there is a greater chance that price will have a reaction within this zone. Whether that be trend continuation or a break of structure, showing signs of weakness of a trend, ref Fig 5.
Fig 5.
Breakout Bands reactivity region showing an area of potential resistance, which price action enters, then the trend continues.
---
NOTE : The same principles apply if you're using the HTF band for monitoring HTF trends.
I hope you enjoy the Breakout Band. Should you encounter any issues or have any suggestions for improving this indicator, let me know.
Any and all feedback is appreciated.
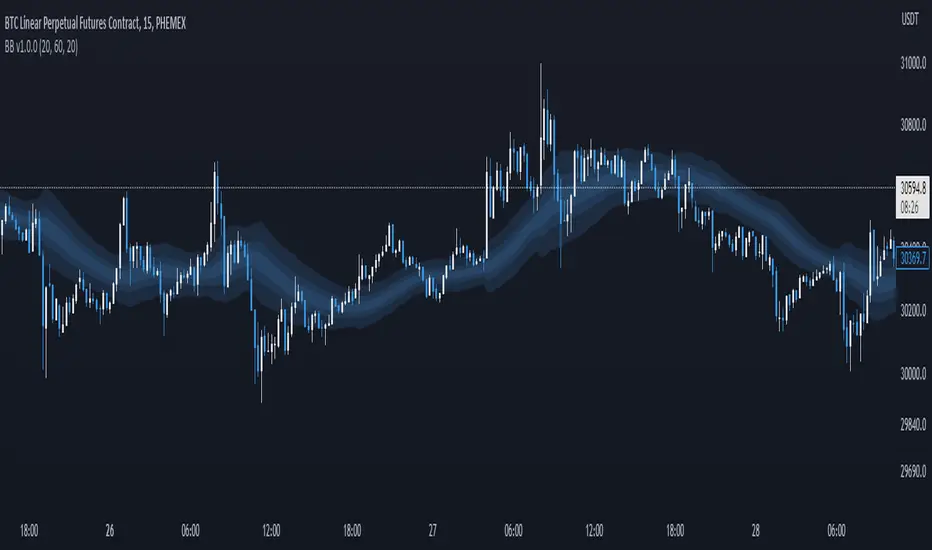
Price Action (ValueRay)With this indicator, you gain access to up to 5 moving averages from a selection of 15 different types. This flexibility allows you to customize your trading strategy based on your preferences and market conditions. Whether you're a fan of simple moving averages, exponential moving averages, or weighted moving averages, our indicator has got you covered! Additionally, all the MAs are Multi-Time-Frame!
The indicator also provides trading signals. By analyzing market trends and price movements, it generates accurate buy and sell signals, providing you with clear entry and exit points. You can choose between Fast, Mid, and Slow signal speeds.
Trendlines are another crucial aspect of effective trading, and our indicator seamlessly integrates them, helping you visualize the market's direction.
Furthermore, the indicator empowers you with recent highs and lows. By highlighting these key levels, it becomes easier than ever to spot support and resistance areas, aiding you in making well-informed trading choices.
Additionally, you can switch the ADR% (Average Daily Range as a Percentage) on and off. This number instantly provides you with information on how much the stock usually moves per day as a percentage.
Key Features:
Up to 5 Moving Averages, each with its own timeframe.
SMA, EMA, WMA, RMA, Triangular, Volume Weighted, Elastic Volume Weighted, Least Squares, ZLEMA, Hull, Double EMA, Triple EMA, T3, ALMA, KAMA (more to come in future versions).
Recent High and Low Pivot Points acting as support/resistance.
Trendline indicating the current trend.
Buy/Sell Signals (recommended for use as exit points, stop loss, or take profit levels).
Signals can have three different speeds: Fast, Mid, and Slow. You can switch them anytime depending on how quickly or slowly you want to exit a trade.
The predefined colors are best suited for a dark background, and the predefined settings provide a solid starting point that many traders use in their daily work.
Unlock the full potential of your trading strategy with our comprehensive indicator and start making informed trading decisions today!

BRAHMA_ALARMThe indicator is an update to the "HMA-Kahlman Trend & Trendlines" script by capissimo, which is available at the following link: The update includes the integration of an alarm function to provide additional functionality.
The indicator continues to be based on the combination of the HMA (Hull Moving Average)-SMA (Simple Moving Average) method and the Kalman filter to generate precise trading signals. The original script by capissimo serves as the foundation for the SIMSOIL indicator, which has been enhanced by the addition of the alarm function to keep traders informed of potential trading opportunities.
It is important to emphasize that indicator is developed as an update to the original script by capissimo. I would like to thank capissimo for their original work on the script, and I have added the alarm function as an extension.

Wunder Breakout botWunder Breakout bot
1. Wunder Breakout bot is based on the breakout of the trend line. Breakout is a technical trading strategy that is used to determine the moment of a trend line breakout on the price chart. It is based on the assumption that when price crosses a trend line, it signals a change in trend direction and the possible start of a new price movement.
2. The entry points for the trendline breakout strategy are based on the principle of breaking through a set trendline. This means that we look for the moment when the price of the asset crosses the trend line that we have established in order to enter a sell or buy position.
3. We use fixed take-profit and stop-loss, but you can use other risk management systems, based on the suggested settings.
4. Wunder Breakout bot script has added a function to calculate the risk per portfolio (your deposit). When this option is enabled, you get the calculation of the entry amount in dollars relative to your Stop Loss. You can chooseselect the percentage of risk per your portfolio in the settings. the percentage of risk per your portfolio in the settings. The loss will be calculated from the amount that will be displayed on the chart.
For example, if your deposit is $1000 and you set your risk at 1%, with a Stop Loss of 5%, your entry volume would be $200. The SL loss would be $10. $10 is your 1% risk or 1% of your deposit.
*Important! ** The risk per trade must be less than the Stop Loss value. If the risk is more than SL, you should use leverage.
The amount of funds included in the deal is calculated in dollars. This option was created if you want to send a dollar amount from Tradingview to the exchange. However, by specifying the volume in dollars, you will get the net profit and drawdown displayed incorrectly in the backtest results because TradingView calculates the backtest volume in contracts.
To display the correct net profit and drawdown values in Tradingview backtest results, use the "Volume in Contracts" option.

Donchian Channel Oscillator (DonOsc) Preface
DonOsc stands for Donchian Channel Oscillator. This channel envelopes all prices, so if you set the height of the channel to 100 percent, you can plot the prices as percent in between, creating this sub-pane oscillator. For clarity the example chart shows a Donchian channel in the main-pane with the same look-back as the DonOsc, this way you can see how both are related.
Price River
Not only the close is plotted, but also the high and the low of the bar. Thus you get a structure that can be associated with a river, streaming from left to right, in which the price moves between the left bank (i.e. the plotted highs) and the right bank (i.e. the plotted lows), which meanders between the high border (100%) and the low border (0%) of the oscillator. The surface of the price river is gray. The price line is blue when up and dark red when down. The river has also color patches dark red, light red, blue and aqua. Stochastic patches; up: aqua, down: light red
If you look at the price river, you may notice that the price line is closer to the left bank (highs) when moving up and to the right bank (lows) when moving down. Because this phenomenon is used in the stochastic indicator, I named these stochastic patches. These are depicted on the wide side for visibility, so the aqua patches are to the right of the price line and the light-red patches to the left.
Widening patches; up: blue, down: red
If you look at tops or bottoms in bar charts, you may notice that long bars (wide range) tend to be there. You may say that prices turn with a ‘range bang’. This causes a widening of the price river, depicted as a patch on the wide side.
Channel Features
High (76.4 %) and low (23.6 %) Fibonacci levels.
In the oscillator there is no need to calculate Fibonacci levels, we can just plot them. If the price is above 50% the low level is shown with a green color, when below the high level with a pink color. When the price river crosses a level a ‘near border’ highlighter will flash, lime near the high border and orange near the low one.
New high and new low markers.
A flaw in the oscillator is that is doesn’t show actual new lows and new highs in the Donchian Channel, because everything is made relative. This is ‘repaired’ by adding markers, dark red for new low depicted between the high fib and border, blue for new high depicted between low fib and border. Used are the same colors as in the widening patches, because new highs and lows also lead to widening of the actual Channel.
Uptrend and downtrend highlighters.
If in the actual Channel the bars run in the upper half, an uptrend is happening as long as these remain there, a downtrend when the bars remain in the lower half. In the oscillator a yellow highlighter flashes when the price is higher than 50%, a red highlighter below 50%.
Interpretation of the DonOsc
This sub-pane indicator provides a wealth of useful information about what is going on in the market. First of all you immediately see whether there is an up or down trend and whether these lead to new highs or lows. Second of all you can estimate the importance of price movements in the context of the look-back period. Thirdly the width of the price river reveals the emotions in the market. The higher the emotions run, the more risk is involved in a postilion in the charted instrument.
Settings of the DonOsc
Look-back settings.
By default the script sets the look-back, depending on the time frame. This overrules the standard manual setting. If you switch this off, the manual setting will work. A feed-back label can by shown which informs about the current setting.
Smoothing
This concerns the price river. Default is 2, if you increase this setting, the river will loose its touch with the channel borders. O.t.o.h. the river wil be wider and better visible. Maximum setting is 5.
Colors
The momentum colors set both the river widening patches and new high and low markers.
Take care, Eykpunter.

Stochastic RSI+ by MartialChartsFXThe original Stochastic RSI was built to generate more signals than either of the ordinary RSI or Stochastic Oscillator.
This Stochastic RSI+ is a customized Stochastic RSI meant to be less obtrusive as a lower indicator with several added components for improved utility.
The Stochastic RSI+ has 3 components:
1. The Single line color changing Stochastic RSI (%K line)
2. Divergence detection using one of three oscillators (RSI, Stochastic, or the default Stochastic RSI). Divergence may be detected in Strict or Non-Strict modes.
3. Strength indicator
Single Line Stochastic RSI (%K)
To make manual detection of divergence easier, I decided to reduce the Stochastic RSI down to just the %K line. In order to see how the %K line interacts with the %D line without having the extra line as a distraction, the %K line has been coded to change colors based on its relation to the %D line.
The Stochastic %K is green when %K is greater than %D
The Stochastic %K is red when %K is less than %D
The oversold region is 0-20 and highlighted in a light green on the scale.
The overbought region is 80-100 and highlighted in light red on the scale.
Divergence Detection
The optional divergence detection settings include the selection of 3 oscillators: RSI, Stochastic, or Stochastic RSI (default). Regardless of which oscillator is selected for divergence detection the indicator will only show the Stochastic RSI's %K line. This gives the trader the change to see if divergence is present on multiple oscillators. The divergence detection does not draw trendlines on the chart or the lower indicator, instead it plots an H (for Hidden Divergence) or a D (for Divergence) in green (bullish) or red (bearish) where the 2nd point of divergence is located based on the oscillator used and whether the detection is set to strict or not. This programming will not capture every instance of divergence. You should still manually verify any divergence indicated.
Strict Divergence enabled is the traditional method of divergence detection where swing points on the price charts align with peaks and valleys on the oscillator. Where there are not matching peaks and valleys on both price and the oscillator, divergence is not detected.
Strict Divergence disabled is an alternate divergence detection by connecting swing points on the price chart and then checking to see what the corresponding oscillator values are regardless of if it is a peak or valley on the oscillator. To draw this method manually would be drawing the oscillator trendline through the %K line to connect which ever points on Stochastic RSI line up with the swing points on the price chart. This will find more divergence than would ordinarily be overlooked.
Asset Strength
The Strength indicator is the 2nd set of numbers on the indicator information line. Values above 0 are bullish, Values below 0 are bearish. Strength is measured by comparing fast and slow RSI calculations to gauge a rate of change towards bullish or bearish.
Strength color changes:
Dark green to light green = asset is bullish but getting weaker
Light green to dark green = asset is bullish and getting stronger
Red to pink = asset is bearish but getting stronger
Pink to Red = asset is bearish and getting weaker
Usage
Can be used in all asset classes. This is a Stochastic RSI oscillator so the same Stochastic RSI usage rules apply.
The ways that I use Stochastic RSI+:
1. To gauge if a zone is likely to hold or be broken.
- Buying zones have better confluence when Stochastic RSI+ is very oversold (0-5) and have bullish divergence.
- Selling zone have better confluence when Stochastic RSI+ is very overbought (95-100) and have bearish divergence.
2. For divergence to time entries and to identify continuations, retracements, reversals, and stop hunts.
3. For strength to see if the asset is getting stronger or weaker when price reaches a zone.

TRENDCATOR - Trend Of IndicatorsHello Traders :)
I am Only Fibonacci.
I would like to give you detailed information about this indicator that I have prepared.
With this tool you add to your chart, you can automatically draw the falling trend and rising trend lines of many indicators.
I've prepared a few extra nice things for you. With this indicator, you can see the instantaneous values of active trend lines and their distance from the indicator value.
We are now ready to introduce.
You can use this indicator in two languages. English and Turkish. The choice is yours.
When we enter the indicator settings, there is a group under the TREND heading. With the settings in this group, you can determine the sensitivity of the trends to be plotted. The lower the sensitivity, the less reliable the plotted trends will be. I am sure you will find the middle ground.
Trends are calculated by relationships between all detected peaks.
If you check the Show Data box, you can see the value of the active (unbroken) trends in the current candle. Sometimes it can create visual pollution. So you can remove it. Below will be a version view where the values of the trendlines are visible.
With this tool, you can add any indicator you choose from the settings section to the chart and draw the trend lines automatically.
You can add RSI, ATR, CCI, MFI, MOM and various moving averages to your chart and draw a trend line. Below will be an image of the Momentum indicator.
You can edit the following from the settings section of this tool:
The language you will use, EN-TR
Colors of trend texts
Trend sensitivity
Thickness and colors of downtrend and rising trendlines
Hide and show trends
Hide and show trend values
Changing the background and text color of the box where the indicator name appears
Determining the source of the selected indicator
Determining the period of the selected indicator
Determine the color of the line of the selected indicator
Note: If the period value is not used in the calculation formula of the indicator you selected, the period selected in the settings will not be included in the calculations.
Note 2: If the source value is not used in the calculation formula of the indicator you have chosen, the source value selected in the settings will not be used.
Broken, inactive trend lines disappear.

MATHR3E LINES█ OVERVIEW
MATHR3E LINES automatically draws Demand lines and Supply lines with their associated targets
█ CONCEPTS
Disclaimer:
MATHR3E LINES indicator is intended for advanced traders and may fit your profile, whether you are a day trader or a long-term investor.
It was originally developed by a renowned market analyst and documented in numerous books. Among them is the author Jason Perl.
It is recommended to have read the trading techniques mentioned in the books covering this indicator beforehand.
How to use:
The indicator draws Demand lines and Supply lines with their associated targets.
These lines connect pivot points which are:
- Lows surrounded on either side by higher lows
- Highs surrounded on either side by lower highs.
The key to drawing trend lines objectively is to select the right pivot points. Their significance is determined by the number of surrounding highs and lows.
By default, these are set to 1 since they are more sensitive to price action than higher level pivot points, and therefore provide an earlier breakout signal.
Another approach suggests that the most significant points to connect are those whose levels coincide with trend reversals.
Once you have chosen a demand line, there are 3 conditions that must be met for the trend line to be used.
As far as one or more of the conditions is met, a break of the intrabar trendline is expected, and a closing violation above the breakout level is likely.
Qualifiers
• Qualifier #1: Reverse Break
• Qualifier #2: Gap Break
• Qualifier #3: Pressure Break
In turn, a confirmed breakout entry may be invalidated the following bar, if any of the disqualifying conditions occur:
Disqualifiers
• Open Failure
• Close Failure
• H/L Failure
█ FEATURES & BENEFITS
Versatile:
This indicator can be applied to any market or time frame.
The methodology is equally relevant whether you are day trading or position trading.
Breakout confirmation:
• If a breakout is confirmed, its associated lines will turn solid.
• Otherwise, for invalidated breakouts or broken trendlines , they will remain dashed
Alerts
Get notified on:
•Demand/Supply Line Confirmed Breaks
•Demand/Supply Invalidated Breaks
•Demand/Supply Target Reached

Market Meanness Index [CC]The Market Meanness Index was created by Johann Christian Lotter and I added some smoothing of my own, so feel free to try it without any smoothing to see the differences. This indicator relies on the mean reversion theory that all prices will eventually revert to the mean over a long period of time. Obviously there is more to the theory but the basic idea is if you plot a sma or other typical moving average, you will see the price moving up or below the long term moving average such as a 200 day sma but usually heads back to the average in the short term. This is a good statistical analysis used for volatility which is where this indicator comes in. Simply put, we calculate volatility based on how often a price is both above the median and above the previous price or vice versa.
A rising Market Meanness Index means that the market is becoming more volatile and that there is a high likelihood of a change in the underlying trend. A falling Market Meanness Index means that the current trend is dying and there is a high likelihood of a trend reversal. Typically I put general buy and sell signals in red or green but in this particular case, this indicator works best as a overall trend filter and you would want to place a trade when this indicator has a peak or valley. Let me know if you find a good overall buy and sell signal system of course.
I know I keep saying that I will get active again and post more indicators but life is very hectic for me. For those who have been following my updates, my twins were finally born a little over a month ago and as you can imagine, they keep me up at all hours of the day so it is hard to create new indicator scripts when I'm getting no sleep lol. I will do my best to start publishing the giant backlog of scripts I have created but in the meantime, please be patient with me. This indicator was a special request so let me know if you have any special requests of your own!

Ichimoku ATR Oscillator// An oscillator that visualizes Ichimoku trend line distances in terms of ATR.
// Public Domain
// By JollyWizard

Aarika Heikin AshiHello Traders,
This indicator is probably based for the people who use HA candlestick chart and frequently have to switch between Japanese candlestick and HA candles. The worry is over with this simple indicator.
Now you can enjoy both candlesticks at the same time.
AHA allows you to have 2 EMAs (mostly used for crossovers). Default values set at 8/21 EMA which we may indicate a trend reversal.
We strongly recommend you back-test everything that you need before you start using AHA.
Thank you.

CryptoAlgo DCA / AccumulationThis is a Dollar Cost Average (DCA) / Accumulation strategy. Every time there is a long signal it will buy a fixed USD amount that you have specified in the settings and keep buying at the dips and corrections in the market. This strategy is low-risk, however it assumes you have a long time horizon of at least 2+ years. The longer your holding-period, the better your returns.
There is 3 different entry conditions you can choose from:
The first entry condition is bollinger bands. Bollinger bands is a set of trendlines plotted two standard deviations (positively and negatively) away from a simple moving average (SMA) of an assets price. Every time a candle closes below the lower trendline the strategy will buy.
The second entry condition is the Relative Strength Index (RSI). The RSI is a momentum indicator used in technical analysis that measures the magnitude of recent price changes to evaluate overbought or oversold conditions in the price of a stock or other asset. Every time the RSI is meaning oversold and goes below a point of your choosing the strategy will buy.
The third entry condition is based on pivot points and moving averages that will determine small term trend changes in the market and low price points. Every time there is a bullish trend reversal the strategy will buy.
All three of these entry conditions can be controlled by a higher timeframe RSI that will stop entries when the RSI is above a certain point where the market is overbought and not ideal for accumulation.
The take profits in this strategy is dynamic and will signal trend changes like the third entry condition by using pivot points and moving averages. Since this is a DCA/ Accumulation strategy and will accumulate for the long term it will only exit a small percentage of the accumulated position. This will ensure that you take profit as the asset is appreciating in price while keeping the majority of the position for greater profit in the future.
At the bottom right corner of the chart you will be able to see the key results of the DCA
The first reading is the Average amount USD that the strategy is investing on average every month. This value will help you identify the best settings for you and what USD amount the strategy should enter at the signals so that it stays below the amount you are willing to invest every month. Keep in mind that this is an average and that there will be a lot of deviation up or down based on where the market is going. If the market is having a correction the strategy will signal a lot more entries than when it is going up.
The second reading is the average profit per month. This is also an average and the result will go up exponentially from the starting point as the strategy accumulates and the market appreciates in price.
The third reading is the position average price. This is the average price all the accumulated USD in the asset.
The fourth reading is the total profit. This is the result of both the realised profit from taking profit and the accumulated usd amount left in the position.
The last reading is the performance score. This is a scoring system that i created that looks at the data from the readings and weighs it based on importance and then spits out a number that will help identify the best settings. The higher the number the better the performance, meaning more profit and better DCA.
When you have found the right settings you can insert the messages from your automatic trading platform at the bottom of the inputs and then create an alert with your unique webhook address along with the alert message below:
{{strategy.order.alert_message}}
You will be able to adjust all parameters in the settings.
Enjoy!