Bullish Wave StructureThis indicator visualizes bullish waves and the uptrend structure. It highlights the wave patterns, breakout levels, and swing highs and lows, distinguishing major and minor swings. The script also incorporates labels to denote trend and wave numbers, enhancing clarity in trend and wave identification. The waves plotted on the chart aid in chart study, trend analysis, and decision-making. Drawing objects on the chart are customizable.
## Fundamental Trend Assumptions
A trend starts when there is a break above a major swing high. There is then a first wave.
Subsequent waves are validated when there is a break above the high of the preceding wave and another major swing high is detected.
The trend ends when the price trades below the swing low of the latest wave.
## Wave drawing mechanism
The drawing of a wave occurs when:
There is a break above a major swing high (or the high of a wave) and another major swing high is detected.
There is a break above a major swing high (or the high of a wave) and the price collapses below the lowest point between the highest high and the high of the previous wave. The script treats this false break high as a legitimate bullish wave, even if no major swing high has been detected. The trend ends because the low of the current wave has been breached. This is a false break high that falls back within the range of the preceding wave.
There is a break above a major swing high (or the high of a wave) and the price collapses below the low of the preceding wave. The script treats this false break high as a legitimate bullish wave, even if no major swing high has been detected. The trend ends because the low of the preceding wave has been breached. This is a false break high followed by a sharp sell-off.
In short, the script draws the wave if there is a break above a major swing high (or the high of a wave) and another swing high is detected (or there is a break below the low of a wave).
## Remarks
While lower timeframes could benefit from this indicator, it shows clearer wave and trend structures in higher timeframes, starting from the 1H chart.
This indicator does not provide price projections. The drawing occurs after the price patterns have been unveiled. In other words, it draws waves and performs labeling in hindsight. However, users can fully benefit from the indicator for trend study and various technical analyses to support trading decisions, as explained in the description above.
## Acknowledgement
The script uses user-defined functions to look back and find indexes of the highest and lowest values when no swings have been found (i.e., one-bar false break high and collapse). The detection of regular minor and major swings has been accomplished by the built-in functions:
ta.pivothigh() [Pine Script Language Reference Manual — TradingView (www.tradingview.com)
ta.pivotlow() [Pine Script Language Reference Manual — TradingView (www.tradingview.com)
Cari dalam skrip untuk "wave"

Wolfe Wave Detector [LuxAlgo]The Wolfe Wave Detector displays occurrences of Wolfe Waves, alongside a target line. A multiple swing detection approach is used to maximize the number of detected waves.
The indicator includes a dashboard with the number of detected waves, as well as the number of reached targets.
🔶 USAGE
The Wolfe Wave pattern is a chart pattern composed of five segments, with the initial segment extremities (points XABCD) forming a channel containing price variations.
After the price reaches point D , we can expect a reversal toward a target line (point E ). The target line is obtained by connecting and extending point X -> C .
The script draws the XABCD pattern and a projection of where E might potentially be located.
The projection is derived from the intersection between the target line and a line starting from D , parallel to B-C . From this line, margins are added, left and right, creating a wedge-shaped figure in most cases.
When the price passes the target line, this is highlighted by a dot. The dot and pattern are green by default when the target is above D and red when the target is below D . Colors can be edited in the settings. The dashed target line is colored in the opposite color.
As seen in the above example, the price trend can reverse after reaching the target line.
🔹 Symmetry
Ideally, the Wolfe Wave must have a degree of symmetry; every upward line should have a similar angle to the other upward lines, and the same should be true for the downward lines.
Also, the lines forming the channel should be as parallel as possible.
Users have the option to adjust the tolerance:
Margin controls the wave symmetry of the pattern
Angle controls the channel symmetry of the pattern
It's important to note that in both cases, a lower number will lead to more symmetrical patterns, but they may appear less frequently.
It is also important to note that increasing the Margin can delay validating the pattern. In the meantime, the price could surpass the channel in the opposite direction, invalidating and deleting the otherwise valid pattern.
🔹 Multiple Swings
Users can set a Minimum Swing length (for example 2) and a Maximum Swing length (for example 100) which defines the range of the swing point detection length, higher values for these settings will detect longer-term Wolfe patterns, while a larger range will allow for the detection of a larger number of patterns.
By using multiple swings, it is possible to find smaller next to larger patterns at the same time.
The dashboard shows the number of patterns found and targets reached. When, for example, bullish patterns are disabled in the settings, the dashboard only shows the results of bearish patterns.
🔹 Extend Target Line
The publication includes a setting that allows the Target Line to be extended up to 50 bars further. As seen in the above example, the Target Line can still be reached even after the pattern has been finalized. Once the Target Line is reached, it won't be updated further.
Here is another example of a Target Line being reached later on.
The Target Line acted as a support level, after which where the price changed direction.
🔹 Show Progression
An option is included to show the progression before the pattern is completed. Users can make use of the XABC pattern or visualize where point D should be positioned.
The focus lies on the bar range (between the left and right borders of the grey rectangle). The pattern is considered invalid and deleted when point D is beyond these limits. The height of the rectangle is optional. Ideally, the price should be located between the top and bottom of the rectangle, but it is not mandatory.
Show Progression has three options including:
Full: Show all lines of XABC plus line C-D and rectangle for the position of point D
Partial: Show line C-D and rectangle for the position of point D
None: Only show valid completed patterns
The 'Partial' option in the 'Show Progression' feature is designed to help users locate the desired position of point D without the visual clutter caused by the XABC lines. This can be useful for those who prefer a cleaner visual representation of the evolving pattern.
🔶 SETTINGS
🔹 Swing Length
Minimum: Minimum length used for the swing detection.
Maximum Swing Length: Maximum length used for the swing detection.
🔹 Tolerance
Margin: Influences the symmetry of the pattern; with a higher number allowing for less symmetry.
Angle: Influences the symmetry of the channel; with a higher number allowing for less symmetry.
🔹 Style
Toggle: Bullish/Bearish + colors
Extend Target Line: Extend a maximum of 50 bars or until Target Line is reached
Show Progression: Show pattern progression
Dot Size: The size of the dot when the Target Line is reached
🔹 Dashboard
Show Dashboard: Toggle dashboard which shows the number of found patterns and targets reached.
Location: Location of the dashboard on the chart.
Text Size: Text size.
🔹 Calculation
Calculated Bars: Allows the usage of fewer bars for performance/speed improvement

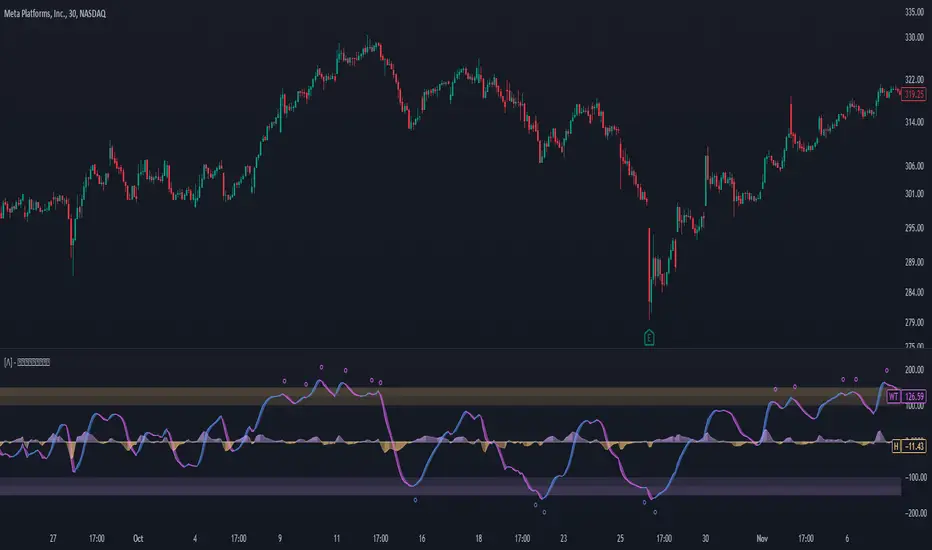
Enhanced WaveTrend OscillatorThe Enhanced WaveTrend Oscillator is a modified version of the original WaveTrend. The WaveTrend indicator is a popular technical analysis tool used to identify overbought and oversold conditions in the market and generate trading signals. The enhanced version addresses certain limitations of the original indicator and introduces additional features for improved analysis and comparison across assets.
WaveTrend:
The original WaveTrend indicator calculates two lines based on exponential moving averages and their relationship to the asset's price. The first line measures the distance between the asset's price and its EMA, while the second line smooths the first line over a specific period. The result is divided by 0.015 multiplied by the smoothed difference ('d' for reference). The indicator aims to identify overbought and oversold conditions by analyzing the relationship between the two lines.
In the original formula, the rudimentary estimation factor 0.015 times 'd' fails to accomodate for approximately a quarter of the data, preventing the indicator from reaching the traditional stationary levels of +-100. This limitation renders the indicator quantitatively biased, as it relies on the user's subjective adjustment of the levels. The enhanced version replaces this factor with the standard deviation of the asset's price, resulting in improved estimation accuracy and provides a more dynamic and robust outcome, we thereafter multiply the result by 100 to achieve a more traditional oscillation.
Enhancements and Features:
The enhanced version of the WaveTrend indicator addresses several limitations of the original indicator and introduces additional features-
Dynamic Estimation: The original indicator uses an arbitrary estimation factor, while the enhanced version replaces it with the standard deviation of the asset's price. This modification provides a more dynamic and accurate estimation, adapting to the specific price characteristics of each asset.
Stationary Support and Resistance Levels: The enhanced version provides stationary key support and resistance levels that range from -150 to 150. These levels are determined based on the analysis of the indicator's data and encompass more than 95% of the indicator's values. These levels offer important reference points for traders to identify potential price reversals or significant price movements.
Comparison Across Assets: The enhanced version allows for better comparison and analysis across different assets. By incorporating the standard deviation of the asset's price, the indicator provides a more consistent and comparable interpretation of the market conditions across multiple assets.
Upon closer inspection of the modification in the enhanced version, we can observe that the resulting indicator is a smoothed variation of the Z-Score!
f_ewave(src, chlen, avglen) =>
basis = ta.ema(src, chlen)
dev = ta.stdev(src, chlen)
wave = (src - basis) / dev * 100
ta.ema(wave, avglen)
Z-Score Analysis:
The Z-Score is a statistical measurement that quantifies how far a particular data point deviates from the mean in terms of standard deviations. In the enhanced version, the calculation involves determining the basis (mean) and deviation (standard deviation) of the asset's price to calculate its Z-Score, thereafter applying a smoothing technique to generate the final WaveTrend value.
Utility:
The 𝗘𝗻𝗵𝗮𝗻𝗰𝗲𝗱 𝗪𝗧 indicator offers traders and investors valuable insights into overbought and oversold conditions in the market. By analyzing the indicator's values and referencing the stationary support and resistance levels, traders can identify potential trend reversals, evaluate market strength, and make better informed analysis.
It is important to note that this indicator should be used in conjunction with other technical analysis tools and indicators to confirm trading signals and validate market dynamics.
Credit:
The 𝗘𝗻𝗵𝗮𝗻𝗰𝗲𝗱 𝗪𝗧 indicator is a modification of the original WaveTrend Oscillator developed by @LazyBear on TradingView.
Example Charts:
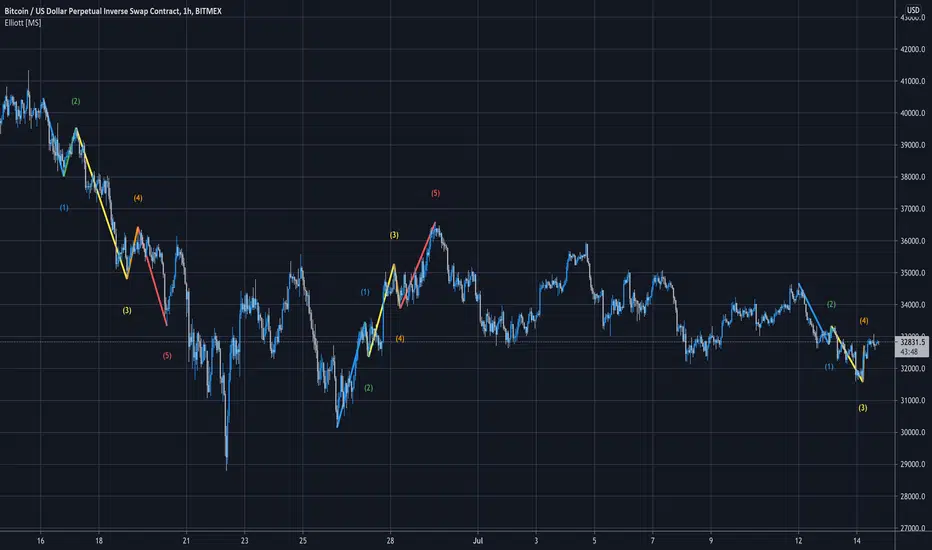
Elliott Wave [LuxAlgo]The Elliott Wave indicator allows users to detect Elliott Wave (EW) impulses as well as corrective segments automatically on the chart. These are detected and displayed serially, allowing users to keep track of the evolution of an impulse or corrective wave.
Fibonacci retracements constructed from detected impulse waves are also included.
This script additionally allows users to get alerted on a wide variety of trigger conditions (see the ALERTS section below).
🔶 SETTINGS
🔹 Source
• "high" -> options high, close, maximum of open/close
• "low" -> options low, close, minimum of open/close
🔹 ZigZag
• The source and length are used to check whether a new Pivot Point is found.
Example:
• source = high/low, length = 10:
• There is a new pivot high when:
- previous high is higher than current high
- the highs of 10 bars prior to previous high are all lower
• These pivot points are used to form the ZigZag lines, which in their turn are used for pattern recognition
🔶 USAGE
The basic principles we use to identify Elliott Wave impulses are:
• A movement in the direction of the trend ( Motive/Impulse wave ) is divided in 5 waves (Wave 1 -> 5)
• The Corrective Wave (against the trend) is divided in 3 waves (Wave A -> C)
• The waves can be subdivided in smaller waves
• Wave 2 can’t retrace more than the beginning of Wave 1
• Wave 4 does not overlap with the price territory of Wave 1
Here we see an example:
Let's look at the development:
• 1 bar after point (5) a confirmed 5 Motive Wave pattern is found (1 -> 5; The 5 Waves can also be seen as one large Wave 1 ).
• Next, the script draws a set of Fibonacci lines, which are area's where the Corrective Wave potentially will bounce.
Here we see the fifth wave is getting larger, the previous highest point is updated, and the Wave 5 is larger than Wave 3 :
(At this point, the pattern is invalidated, and it display as dotted)
Further progression in time:
At this point, a confirmed " 3 Corrective Wave pattern " is found (a -> c)
When a new high has developed, a circle is drawn (in the same color of the lines)
However, when the bottom of the drawn box has breached, a red cross will be visualized.
Further progression:
Later on, a bearish confirmed " 5 Motive Wave pattern " is found (1 -> 5):
When a Corrective Wave becomes invalidated, the ABC pattern will display as dashed (not dotted):
🔶 TECHNIQUES
Pine Script™ introduces methods!
• More information can be found here:
• Pine Script™ v5 User Manual 👉 Methods
• Pine Script™ language reference manual 👉 method
🔶 ALERTS
Dynamic alerts are included in the script, you only need to set 1 alert to receive following messages:
• When a new EW Motive Pattern is found (Bullish/Bearish )
• When a new EW Corrective Pattern is found (Bullish/Bearish )
• When an EW Motive Pattern is invalidated (Bullish/Bearish )
• When an EW Corrective Pattern is invalidated (Bullish/Bearish )
• When possible, a start of a new EW Motive Wave is found (Bullish/Bearish )
• Here is information how you can set these alerts()

Elliott Wave [MS]Elliott Wave counter for TradingView! Automatically count Elliott waves on any asset and any timeframe. The script will count in-progress patterns as well as show past patterns that have completed (adjustable in Settings).
Simple to use, just add to your chart and choose how big of waves you're looking for with the Size setting.
Smaller numbers will auto count smaller sized Elliott Waves.
Larger numbers will auto count bigger sized Elliott Waves.
Scan for multiple size waves by adding the indicator to your chart multiple times.
Settings
Size - Set how big or small of waves you want to scan for
Hide Failed Patterns - Show or hide past waves that didn't get to 5
Color Mode - Set your own colors for each wave
Function Sawtooth WaveThis is an indicator to draw a sawtooth wave on the chart.
It can be a useful perspective, as decaying markets tend to oscillate in reverse sawtooth waves, and bullish markets can oscillate in conventional sawtooth waves. With the right inputs, it can be an early warning signal for potential movements.
Something I've noted is that large waves cause a ripple effect and sets the frequency for the market until a change occurs. Sawtooth waves may help in capturing ripple waves.
Useful inputs are:
- Average True Range as wave height (amplitude)
- Periodicity of market as wave duration (frequency)
(Inputs will change the wave from conventional to reverse)
I hope that it is helpful.
GLHF
- DPT

Hashem WaveTrendHASHEM WAVETREND
This indicator is mixture of 4 types of WaveTrends with proper SMA and EMA Smoothings. When the Blue wave crosses the purple wave and if they are in the Lower or Higher Zones, that could be a setup. Also, Customized Godmode with 2 settings and Divergences on Purple Wave are included.
When an Orange Triangle shows up it means the setup is quite powerful.
This can be used on any timeframes and any markets. Don't forget always Higher TF = More Weight and Don't be greedy in CounterTrends .
Besides, VWAP (the difference between the two waves) is plotted. When the Yellow wave is high and near the Fibo levels, It means the trend is just started OR it's near the end.
This indicator is powerful in Swings , Scalpes and Trends on any timeframe, but when the price is ranging in a very tight range , the signals often would be false. So be careful about tight ranges .
Note That The Signals are NOT Confirmed. You must Confirm them with your own TA.

Elliott Wave - AutoCounting [NXT2017] draws the Wave 3 and 5HI BIG PLAYERS,
here's another indicator that I use pretty often.
The waves of Elliott Wave theory are automatically detected and displayed.
It makes it possible to count the Elliott waves almost always correctly and plausibly. However, the tool can only detect wave 3 as well as waves 5, A, B and C. The rest you have to draw yourself.
Sometimes the waves 3 and 5/A/B/C overlap - so I only use the view with wave 3 myself.
Kind regards
NXT2017

[AU] Waves+ Waves+ v0R7b
Plus version of Waves with components from both Waves Advanced and Mnemosyne. Essentially, Waves+ is highly configurable hybrid wavetrend oscillator and Fibonacci oscillator.
Slow wavetrend component replaced by Follower/Base from Mnemosyne indicator
TTM Squeeze Loose/Strict + Explosion Zones now enabled by default
Extreme Caution Fast Wavetrend Line, Fast wavetrend and Extreme Caution Fast WT cross signal now available
Disabled/removed to speed up script performance and load time: Divergence component, stoch k crossovers, T1 signals. Draw objects reduced from 89 to 64 to conform to Pinescript v4 requirements.
Large inactive code blocks stripped/removed to speed up performance and load time

ZigZag Multi [TradingFinder] Trend & Wave Lines - Structures🔵 Introduction
"Zigzag" is an indicator that forms based on price changes. Essentially, the function of this indicator is to connect consecutive and alternating High and Low pivots. This pattern assists in analyzing price changes and can also be used to identify classic patterns. "Zigzag" is an analytical tool that, by filtering partial price movements based on the specified period, can identify price waves across different time frames (short or long term).
🔵 Reason for Creation
The combination of "short term zigzag" and "long term zigzag" enhances accuracy and reduces analysis time. In a time frame, "long term zigzag" represents the main trend, while "short term zigzag" depicts short-term waves.
🔵 How to Use
After selecting the desired time frame and adding "zigzag" to the chart, begin utilization. Keep in mind to identify the main market trend from "long term zigzag" and the minor waves from "short term zigzag".
🟣 Important: Additionally, classic patterns such as HH, LH, LL, and HL can be recognized. All traders analyzing financial markets using classic patterns and Elliot Waves can benefit from the "zigzag" indicator to facilitate their analysis.
🔵 Settings
Short term zigzag : In this section, you can adjust settings such as time frame range, display mode, color, and line width of the zigzag lines.
Short term label : This section allows you to activate or deactivate the display of zigzag labels according to your needs. You can also customize their color and size.
Long term zigzag : Here, you can adjust settings for time frame range, display mode, color, and line width of zigzag lines.
Long term label : Similar to short term label settings.
The recommended time frame for "long term zigzag" is between 9 to 15, and for "short term zigzag" is between 3 to 5.
🟣 Important Notes :
Considering the different behaviors of financial markets and various time frames, it is recommended to experiment with different time frame settings when using "zigzag" to find the best settings for each symbol and time frame, thereby preventing potential errors.
🟣 Terminology Explanations :
"HH": When the price is higher than the previous peak (Higher High).
"HL": When the price is higher than the previous low (Higher Low).
"LH": When the price is lower than the previous peak (Lower High).
"LL": When the price is lower than the previous low (Lower Low).

[volfgang] WAVEA compass to the financial charts.
The Volfgang WAVE Indicator helps you to decode complex market trends and make informed decisions in your trading.
Quick Summary
The WAVE has a signal line which alternates between Red or Blue.
Red is bearish and Blue is bullish.
It turns Blue when the WAVE line crosses above the signal and holds for 1 bar.
it turns Red when the WAVE line crosses below the signal and holds for 1 bar.
(You can change the signal line’s length in the settings, the default is 3 which is suited towards Day Trading – For Swing Traders I recommend 4 or 5 – For Investors 6 to 9).
The WAVE line will change colour to alert you when price is potentially pivoting.
When the WAVE is WHITE, the trend is currently Bearish but could flip bullish soon.
When the WAVE is GREEN, the trend is Bullish and there is strong Bullish momentum.
When the WAVE is ORANGE, it means trend is bullish but there is danger of a Bearish Reversal.
When the WAVE is PINK it means there is strong Bearish Momentum.
WAVETrend Scanner
The WAVETrend Scanner can be enabled in the settings and gives you a quick overview of the current trend across 8 potential timeframes:
You can use this to make sure the trades you are taking on lower timeframes align with the current bias on higher term timeframes, thus ensuring a higher chance of success.
WAVE Colours
The background colour of the WAVE also changes according to the current trend across multiple timeframes. The scanner is constantly measuring the current trend across 7 timeframes;
When 4 timeframes line up Bullish, the WAVE is LIGHT BLUE (Cyan)
When 5 timeframes line up Bullish, the WAVE is DARK BLUE (Navy)
When 6+ timeframes line up Bullish, the WAVE is GREEN
When 4 timeframes line up Bearish, the WAVE is ORANGE
When 5 timeframes line up Bearish, the WAVE is RED
When 6+ timeframes line up Bearish, the WAVE is PINK
Divergence Checker & Buy/Sell Signals
The BUY and SELL Signals are represented by a BLUE or RED Histogram line that extends from the WAVE to the 0 Line.
A BUY signal shows when a Crossover occurs & there is a Bullish Diversion Present within the last 50 bars.
A SELL signal appears when a Crossunder occurs & there is Bearish Diversion present within the last 50 bars.
You can change the length of the Divergence Checker in the settings, default is 50 bars.
Under The Hood
The WAVE pulls information from multiple sources within a set period such as;
Close Price
Highest Price
Lowest Price
EMA
The script applies a set of complicated algebraic equations. Which essentially measures the and of recent price action.
Then it uses EMA's to measure from the and , whilst applying more weight to recent price action.
The functions then calculate more averages which measure the difference from and .
Next, it uses all of these calculated averages to create a value that represents the current WAVE condition. This calculation will determine whether the WAVE is in a bullish or bearish trend.
This sum is then smoothed out to get one more value, which is used to display the info box content that allows us to see exactly at what price the WAVE will keep rising or keep falling.
One final calculation also predicts the point at which the WAVE will flip trend. It uses similar calculations to the "Keep Rising/Falling" prediction function, but its aim is to predict the exact price at which the WAVE will cross.
What gives the WAVE indicator an edge over most Stochastic Indicators, is how it uses Pinescript's "request.security" function to pull information from multiple timeframes in order to generate plots, info data and colours to add much more relevant information to the chart which you can use to make informed trading decisions. This is what allows the WAVETrend Scanner to work.
The WAVE indicator is designed to work with all markets and asset types.

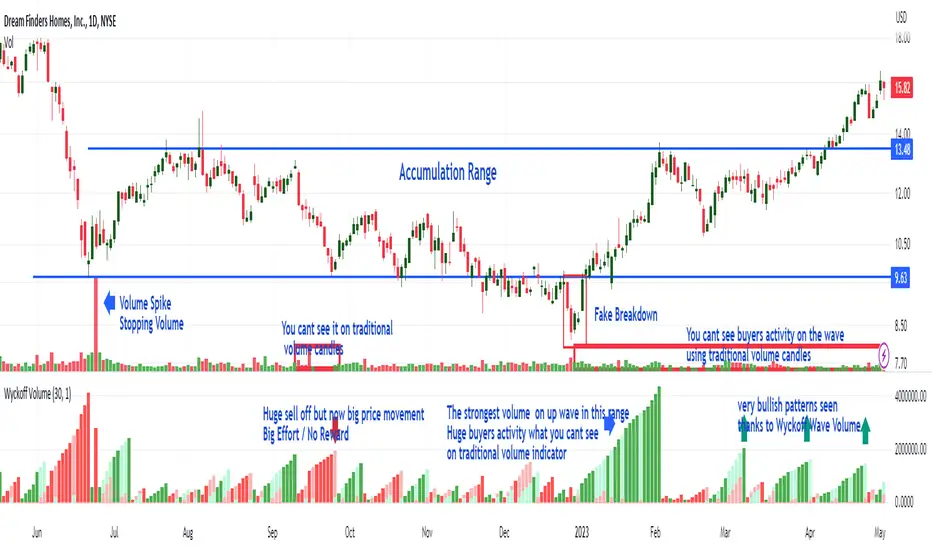
Wyckoff Wave Volume
What Is Wyckoff Wave Volume and How Does It Work?
It is the cumulative sum of exchanged (sold/bought) shares or contracts on a given wave (downward or upward) in a given time plotted below the chart as volume histogram. It shows how much trade is taking place on a given wave. Values are displayed below the chart as opposed to the Wyckoff Wave Chart indicator which displays these values as numbers plotted on the chart.
As you can see in the attached chart, volume candles usually only show a single buyer and seller exposure on the chart. On a normal volume, "Volume Spike" are clearly visible, which play an important role in the analysis. However, the cumulative volume on a wave gives us much more information and shows exactly on which waves the biggest purchases or the biggest sales take place. As in the attached chart, we can see how buyers aggressively carried out the final accumulation action just before the range breakout. In the analysis of the Wyckoff method, cumulative volume is a key indicator to assess the strength or weakness of the market.
It works very similarly the other way around (distribution). Before the market changes direction after large increases, downward waves are characterized by very high volume, which is drawn on the histogram as ultra-high bars. This is information about the distribution carried out by the players - taking profits after increases or opening shorts.
Wyckoff Wave Volume for TradingView
Wyckoff Wave Volume is the best tool to identify turning points in all markets. Money plays in the market, not set ups. Therefore, in order to earn money, you must play in the same direction as the professionals! It is thanks to the observation of the volume that you can know which side the professionals (Smart Money) are on and trade in accordance with their direction. You can also "look" inside the chart and see on the numbers or graphical histogram who controls the market at a given moment - Buyer or the Seller.
Let's Start From The Beginning!
Wyckoff Wave Volume created by Richard Wyckoff in early 1930' were a breakthrough in technical analysis. In his famous technical analysis course, he told his students to "think like waves". Volume analysis was an integral part of his way of investing. During the period when Wyckoff was active in the financial markets wave volume was calculated manually, we now have a fully automated version for TradingView. Using Wyckoff Cumulative Volume you will be surprised how well it identifies turning points in all markets and on any time frame. This tool is very helpful in predicting trend changes in all markets like forex, crypto, futures and stocks.
In order for the indicator to work well on all charts, it is necessary to set the appropriate step in its settings.
"Step" is the wave setting to be taken into account when counting the volume on a given swing. The standard setting for each round is 30. This is the measure of pips on which the next upward or downward wave is to be counted. However, for individual assets, these settings can be adjusted individually.
ZigZag WavesHello All,
I am here with a new idea and script, " Zigzag Waves ". This indicator creates 3 Zigzags with different lengths, keeps the lengths of each zigzag wave and calculates/draws average waves for each zigzag. optionally it can reset the wave when zigzag direction changes and new highest/lowest found. And optionally it draws Exponential Moving Average(EMA) of the sum of waves. This idea is very new and at the moment there is no optimization for the Zigzag Periods. Maybe we altogether can improve the idea and find the best zigzag periods for different symbols and time frames.
Using the options You can play with the periods, add/remove EMA, set its color and reset the waves on new Highest/Lowest. As far as I see resetting the waves on new Highest/Lowest may bring better results.
if we enable "Reset the waves on new Highest/Lowest":
Using different periods and EMA length:
P.S. if you have ideas to improve this script, drop a comment under the script please.
Enjoy!

TradingGroundhog - Fundamental Bot Automation - Fractal/Wave -V1PLEASE READ THE DESCRIPTION - AS THE SCRIPT IS USED FOR AUTOMATION AND TRADING PAIR SWITCH THE MECHANISM CAN BE COMPLICATED TO UNDERSTAND
#-- Pairs Switching - No Repaint - Fractals - Wavetrend --
This strategy uses my fractal/wavetrend previous methods in order to buy/sell.
However, it has been designed in order to switch automatically the pairs on which it trades to reduce the loss and risk.
#-- Synopsis --
To do so, the script uses a Daily wavetrend oscillator. The oscillator is used to find uptrend periods.
From it, the number of uptrend days are counted.
#-- Wavetrend --
For exemple, if BTC/EUR goes from downtrend to uptrend, the script will start to count since how many days the market is uptrend.
Then, if BTC/EUR goes from uptrend to downtrend, the counter will be reset to 0.
The script only trades during uptrend periods.
#-- Pairs --
Up to 35 pairs can be used at the same time. The user can enable of disable to trade on certain pairs.
Uptrend days are counted for each one of those pairs. The user can define on how many pairs the script can trade at the same time.
The select which pairs will be trade, the script sort all the enabled pairs based on their uptrend days counters.
#-- Trade organization --
For exemple if we set 5, as the number of maximum pairs to trade on.
Trades will be conducted on the 5 pairs being in uptrend for the longest time.
Therefore, to organize the money placement on each pair, the equity is used.
For 100% of equity, 10% are kept if losing trades occur.
The remaining 90% are divided by the number of maximum pairs to trade on.
If we chose 5, we will have (90/5) 18% of our capital placed in each bot.
#-- Setting it --
As explained before, this script is used for automation.
For exemple, lets say you are interested by 15 pairs with promising evolution and you set the number of maximum pairs to trade on to 5.
You will have to set alerts for the script on each of the 15 pairs.
You will receive alerts for when to buy and sell.
Note that the script has to be set for each of the selected pairs, it is not able to trade on 15 pairs (thus, webpages) if only set on one Tradingview webpage.
#-- Plot--
Once launch, you can see a plot.
The plot represent the Uptrend days counter for 20 pairs. It also project the organization of the ENABLED pairs.
If a pair is part of the one with the highest number of uprend days. It's name will be displayed under the plot in a yellow comment box.
Four other box are projected to the right of the plot:
White comment : All the pairs sorted from highest number of uptrend days to the lowest.
Red comment : Pairs with the lowest number of uptrend days.
Blue comment : Interesting pairs which will may be uptrend for a long time.
Green comment : Actual pairs with active trading (thus, the pairs with the maximum number of uptrend days)
#-- Bot automation --
If you use 3commas or other trading bot platforms, you will have to set as comments the BUY/SELL alerts. <= Which is what I am doing with it.
Doing so make you trade on multiple pairs, automatically.
However, you will need to set as input the 3commas signal.
For the moment, the script will be needed for it.
However, I will soon release a V2 taking as input the 3commas strategy comments.
For the moment, you can set the script in different webpages and follow BUY/SELL orders by eyes of alerts. ;)
#-- Parameters --
*** Parameters have been intensively optimized using 35 cryptocurrency pairsin order to have potent efficiency for each of them. I would recommend to only change the METHOD SETTINGS. For the others, I don't recommend any modifications. If you need precision on the other parameters of if you want to modify them, more informations can be found in my previous scripts and ***
Filtering method :
Used to reduce or not the risks. If you set Wavetrend, less trades will be conducted as the wavetrend filter from will be used. If you choose Fractal, no Wavetrend signals will be used.
(I prefer to use Fractal as I am using 1 or 3 minutes timeframes for the moment.)
Market Pairs : You can select on which markets the script will trade by enabling it's checkbox.
*** Also, for the moment, due to Pinescript limitation, I cannot set as input the number of active pairs. So I set 5, after optimization, as the default number of maximum pairs to trade on. Thus, you should open webpage for each ENABLED pairs and load the script in each on them. 5 Tradingview webpage will always be active. ***
#-- Timeframe --
You can use the script for Short or Long term trading:
For Short term, you will have to use 1 or 3 minutes timeframes, depending on the volatility of the market. (What I am using)
For Long term, you will have to use 5 or 15 minutes timeframes, depending on the volatility of the market.
#-- Strategy abilities and results for more than a month of activity -- *** !!! IMPORTANT SECTION !!! ***
I have simulated the profit for the 21 ACTIVE pairs I selected has been potent with my Fractal strategy. Different maximum number of trading pairs were used in order to find the best one. The script was run for the last 46 or 30 days.
Different timeframe have been used as pairs have different volatility.
*** If you use the script, SET IT UP with the following pairs and the following timeframes. ***
-------------------------------------------------------------------------------------------------------
Parameters | Maximum number of trading pairs
-------------------------------------------------------------------------------------------------------
Timeframe | Pairs | 1 2 3 5 6 10
-------------------------------------------------------------------------------------------------------
3M | SHIB | 0 0.98 3.63 2.17 2.56 2.56
1M | SOL | 0 1.5 1.08 1.26 0 0
3M | XRP | 10.5 4.56 3.29 2.19 1.52 1.52
3M | ETH | 9.94 6.97 4.55 3.45 2.19 2.19
3M | BTC | 1.7 2.32 1.74 1.88 1.33 1.33
3M | DOT | 0 3.5 2.32 2.27 1.99 1.99
1M | DOGE | 0 0 0 3.14 1.93 1.93
1M | LUNA | 0 0 0 0.23 2.35 2.35
3M | AVAX | 8.92 0 0.53 3.63 1.17 1.17
1M | HOT | 0 0 2.12 7.96 4.69 4.69
3M | GRT | 0 -1.09 -0.82 0.25 -0.191 0
1M | LINK | 0 0 0 0 0 0
1M | CHZ | 0 0 0.4 0.85 1.89 1.91
3M | WIN | 0 0 0.52 5.89 2.8 2..8
3M | ENJ | 32.63 15.65 12.55 10.31 5.62 5.62
3M | RUNE | 0 4.68 3.42 -1.18 2.3 2.3
3M | LTC | 0 -0.06 1.1 1.29 3.49 3.49
3M | BTT | 0 0 0 0.85 1.63 1.63
3M | BCH | 0 0 0 1.36 2.36 2.36
3M | WRX | 0.26 4.66 5.36 4.29 3.01 3.01
3M | ETC | -0.92 0 0 3.6 3.31 3.56
-------------------------------------------------------------------------------------------------------
Net profit % | 63.03 43.67 37.24 55.69 45.949 43.61
Number of days | 46 30 30 46 46 46
Net profit % per day | 1.38 1.46 1.25 1.22 1.00 0.95
-------------------------------------------------------------------------------------------------------
*** Therefore, we are around more than 1% per day in each case. ***
#-- Choosing pairs --
I selected the 35 cryptocurrencies which can be exchange with EUR and evaluated the ability of my Fractal script on them. The on which have been ENABLED (true) are the best.
BINANCE:SHIBEUR | true
BINANCE:SOLEUR | true
BINANCE:XRPEUR | true
BINANCE:ETHEUR | true
BINANCE:BTCEUR | true
BINANCE:DOTEUR | true
BINANCE:ENJEUR | true
BINANCE:DOGEEUR | true
BINANCE:LUNAEUR | true
BINANCE:VETEUR | false
BINANCE:BNBEUR | false
BINANCE:AVAXEUR | true
BINANCE:HOTEUR | true
BINANCE:EGLDEUR | false
BINANCE:GRTEUR | true
BINANCE:MATICEUR | false
BINANCE:LINKEUR | true
BINANCE:CHZEUR | true
BINANCE:ICPEUR | false
BINANCE:UNIEUR | false
BINANCE:WINEUR | true
BINANCE:ADAEUR | false
BINANCE:RUNEEUR | true
BINANCE:TRXEUR | false
BINANCE:THETAEUR | false
BINANCE:EOSEUR | false
BINANCE:LTCEUR | true
BINANCE:XLMEUR | false
BINANCE:BTTEUR | true
BINANCE:SXPEUR | false
BINANCE:LAZIOEUR | false
BINANCE:YFIEUR | false
BINANCE:BCHEUR | true
BINANCE:WRXEUR | true
BINANCE:ETCEUR | true

Filtered Waves [NXT2017] #Linda Raschke #basics on Arthur MerrilHI BIG PLAYERS,
this script I wrote for an enquiry of a tradingview-user. It should represent the Filtered Waves idea from Arthur Merril and used by Linda Raschke.
It's similar like a visualization of Elliott Waves.
On YouTube title "MTA UK Chapter Presentation with Linda Raschke" between 34-36 minutes Linda Raschke shows the rules for her Filterd Waves.
Any questions? Ask me!
King regards
NXT2017
========
TO MY PERSON
I'm the second winner of the official German Forex Trading Competition in 2018.
Look here to the ranks:
deutsche-trading-meisterschaften.de
I speak german, english and russian.
My strength in trading are Wolfe Wave pattern.

SuperWaveTrendWaveTrend with Crosses + HyperWave + Confluence Zones + Thresholds
SuperWaveTrend — Advanced Momentum System Integrating WaveTrend, HyperWave, Confluence Zones & Threshold Filters
SuperWaveTrend is an enhanced momentum indicator built upon the classic WaveTrend (WT) framework.
It integrates HyperWave extreme zones, top/bottom Confluence Zones, trend hesitation Threshold regions, WT crossover reversal signals, and more.
This indicator is suitable for:
• Trend following
• Swing trading
• Reversal spotting
• Overbought/oversold structure analysis
• Extreme market sentiment detection
Whether you’re scalping or planning swing entries, SuperWaveTrend offers a more precise and visually intuitive momentum structure.
Key Features
1. WaveTrend Core Structure (WT1 / WT2)
• WT1: Primary momentum line
• WT2: Signal line
• Momentum Spread Area (WT1 − WT2) visualization highlights shifts in trend strength
2. HyperWave Extreme Momentum Zones
Background highlight automatically appears during extreme momentum conditions:
• Purple-red: Extreme bullish zone
• Orange: Extreme bearish zone
Helps identify:
• Blow-off tops
• Panic sell-offs
• Extreme trend continuation phases
3. Confluence Zones (Top/Bottom Resonance)
Combines overbought/oversold signals with momentum structure to mark:
• Gold top zones → weakening bullish momentum
• Blue bottom zones → weakening bearish momentum
Useful for detecting:
• Bearish divergence tops
• Reversal bounces
• High-level exhaustion / low-level capitulation
4. Threshold Hesitation Zone (Gray)
When WT1 and WT2 converge tightly, a gray background highlights:
• Unclear direction
• Trend weakening
• Higher risk of false signals
Generally not recommended for new entries.
5. WT Crossover Signals (Cross Signals)
WT1 and WT2 crossovers are marked with color-coded dots:
• Green: Bullish cross
• Red: Bearish cross
A core signal for capturing reversal shifts.
⚠️ Creator’s Disclaimer & Usage Insights
***WARNING***
SuperWaveTrend is not designed for extremely strong one-sided trends.
During highly impulsive markets, signals may become delayed or less reliable.
Optimal Timeframes
Based on extensive backtesting, In swing-trading environments, the indicator performs most effectively on the 1H–4H timeframes, where momentum cycles form cleanly and Confluence Zones provide high-probability setups.
Trading Insights
• In swing-trading environments, Confluence Zones often coincide with excellent long/short opportunities, especially when momentum exhaustion is confirmed.
• When paired with a Bollinger Bands framework, the system exhibits significantly improved accuracy and structure clarity.
Have fun,
BigTrunks

OBV + WaveTrend Volume Scalper [GratefulFutures]This script is a combination script of three different strategies that provides buy and sell signals based on the change of volume with momentum confirmations.
Sources used:
This script relies on the outstanding scripts of the great script writer LazyBear: LazyBear
The following scripts were used in this publication:
1. A modified "On-Balance Volume Oscillator" modified from LazyBear's original script:
2. Wavetrend Oscillator with crosses, Author: LazyBear
3. Squeeze Momentum Oscillator, Author: LazyBear
This script functions based on the following criteria being true:
1. On balance volume oscillator turning from negative to positive (buy) or positive to negative (sell)
2. Squeeze Momentum value is increasing (buy) or decreasing (sell)
3. Wavetrend 1 (wt1) is greater than wavetrend 2 (wt2) (buy)/ Wavetrend 1 (wt1) is less than wavetrend 2 (wt2) (sell)
By combining these factors the indicator is able to signal exactly when net buying turns to net selling (OBV) and when this change is most advantageous to continue based on the momentum and price action of the underlying asset (SQMOMO and Wavetrend).
This allows you to pair volume and price action for a powerful tool to identify where price will reverse or continue providing exceptional entries for short term trades, especially when combined with other aspects such as support and resistance, or volume profile.
How to use:
Simply adjust the settings to your preference and read the given signals as generated.
Settings
There are multiple ways to tune the signals generated. It is set standard for my preferred use on a 1 minute chart.
OBV Oscillator Settings
The first 4 dropdowns in the Inputs section tune the On Balance Volume Oscillator (OBVO) portion of the indicator. You can choose if you want it to calculate based on close, open, high, low, or other value.
The most impactful in the entire settings is going to be the length and smoothing of the OBVO EMA. Making this number lower increasing the sensitivity to changes in volume, making the signals come quicker but is more susceptible to quick fluctuations. A value of between (5-20) is reasonable for the OBVO EMA length. There is a separate smoothing factor titled OBV Smoothing Length and below that, OBV Smoothing Type , a value of (2) is standard with "SMA" for smoothing type with a value of between 2-10 being reasonable. You may also play with these values to see what you like for your trading style.
Wavetrend Settings
The next 3 options are to modify the wavetrend portion of the indicator. I do not modify these from standard, and feel that they work appropriately on all time frames at the following values: n1 length (10), n2 length (20), Wavetrend Signal SMA length (4)
Squeeze Momentum Settings
The following 5 options through the end modify the Squeeze momentum portion of the indicator. The only one that modifies the signals generated is the KC Length , Making this number lower increasing the sensitivity to changes in price action, making the signals come quicker but is more susceptible to quick fluctuations. A value of between (18-25) is reasonable for KC Length .
Style Setting
You may select if you want to see the buy and sell signals. The following 5 options Raw OBV Osc through Squeeze Momentum allow you to see where each specific requirement was met, posted as a vertical line, but for live use it is recommended to turn all of these vertical lines off and only use the buy and sell signals.
Time Frames:
While this script is most effective on shorter time frames (1 minute for scalping and daytrading) it is also viable to use it on longer timeframes, due to the nature of its components being independent of time frame.
Examples of use - (Green and red vertical lines are for visualization purpose and are not part of the script)
SPY 1 Minute (Factory Settings):
SPX 15 minutes (Factory Settings):
Considerations
This script is meant primarily for short term trading, trades on the basis of seconds to minutes primarily. While they can be a good indication of volume lining up with momentum, it is always wise to use them in combination with other factors such as support, resistance, market structure, volume levels, or the many other techniques out there...
As Always... Happy Trading.
-Not_A_Mad_Scientist (GreatfulFutures Trade University)

Wolfe Wave PatternHello All!
For a while now, some of my followers have been asking me to develop Wolfe Wave Pattern . Here it's at your service as open-source and public indicator.
How it works?
- On each bar/tick it checks zigzag waves by using base period and updates the array that is used to keep zigzag levels and locations. Base period in the settings is the minimum zigzag period
- Then it searches if there is new bullish/bearish Wolfe Wave pattern according to last wave direction
- Before searching the pattern it calculates all possible 1234 waves. So any wave in 12345 uses base period or higher. it means that it search all possible candidates. This algorithm is much better than using a few zigzag periods.
- After getting all possible candidates, it checks if any of the found candidates is suitable for Wolfe Wave pattern and keeps them in a matrix
- if there are suitable candidate(s) it shows the latest one and triggers the alert
- it also follows the targets and if the price hits any of the target it extends the line and trigger the alert
- it doesn't check if any of the patterns hits stop-loss.
Options:
Base Period: minimum period to create the zigzag
Error Rate: there are usually so few perfect patterns, so we better consider deviation. if error rate is low than it finds less pattern with more accuracy, if error rate is high than it finds more pattern with less accuracy
- The other options are used for coloring the patterns and lines
Some examples:
P.S. I didn't have enough time to test the indicator, so please drop a comment if you see any issue while using it
Enjoy!

Elliott Wave Universal PRO ImpulseElliott Wave Universal PRO Impulse
Elliott Wave Universal PRO Impulse is a powerful and versatile Pine Script indicator designed for traders who utilize Elliott Wave theory to analyze market trends and forecast price movements. This indicator automates the plotting of various impulse wave patterns, enabling users to visualize and analyze market structures with precision and ease.
Key Features
Multiple Impulse Patterns: Choose from a wide range of impulse wave patterns, including Classic Impulse, Leading and Ending Diagonals, Extended Waves, Truncated Waves, and more, catering to diverse market scenarios.
Customizable Ratios: Supports Standard, Minimal, and Maximal Fibonacci-based ratios for wave projections, allowing traders to adapt to different market conditions.
Interactive Inputs: Define key points (0 and A) by selecting time and price directly on the chart, ensuring accurate wave construction tailored to your analysis.
Visual Customization: Adjust line styles (Solid/Dotted) and colors for Standard, Minimal, and Maximal patterns to enhance chart clarity and align with your trading preferences.
Overlay Display: Plots wave patterns directly on the price chart with labeled points and color-coded lines, making it easy to interpret wave structures.
How It Works
Select an impulse pattern from the dropdown menu (e.g., "Classic Impulse (5-3-5)", "Extended 3rd Wave Impulse").
Set the starting point (0) and wave 1 endpoint (A) using time and price inputs.
The indicator calculates and plots the subsequent waves (2, 3, 4, and 5) based on Fibonacci ratios and the selected pattern.
Toggle Standard, Minimal, and Maximal projections to visualize potential wave targets with distinct styles and colors.
Use Cases
Trend Analysis: Identify and confirm impulse wave structures to anticipate market trends and reversals.
Trade Planning: Use projected wave targets to set entry, exit, and stop-loss levels.
Risk Management: Assess wave validity and potential failure points (e.g., Truncated or Failed Waves) to refine trading strategies.
Settings
Impulse Pattern: Select from over 30 predefined Elliott Wave patterns.
Build Points: Input time and price for points 0 and A to anchor the wave structure.
Display Options: Enable/disable Standard, Minimal, and Maximal projections.
Style Options: Customize line styles (Solid/Dotted) and colors for each projection type.
Notes
Ensure proper placement of points 0 and A to align with significant market highs/lows for accurate projections.
Best used in conjunction with other technical tools to confirm wave patterns and market signals.
Optimized for all timeframes and asset classes, including stocks, forex, crypto, and commodities.
Elevate your Elliott Wave analysis with Elliott Wave Universal PRO Impulse and gain a deeper understanding of market dynamics!
Complete catalog of Elliott impulse patterns:
Classic Impulse (5-3-5) - Sequential - Классический импульс с последовательной структурой.
Classic Impulse (5-3-5) - Template - Классический импульс с шаблонными пропорциями.
Extended 1st Wave Impulse - Импульс с удлиненной первой волной.
Extended 3rd Wave Impulse - Импульс с удлиненной третьей волной.
Extended 5th Wave Impulse - Импульс с удлиненной пятой волной.
Symmetrical Impulse - Симметричный импульс.
Leading Diagonal (5-3-5-3-5) - Ведущая диагональ с подволнами 5-3-5-3-5.
Leading Diagonal (3-3-3-3-3) - Ведущая диагональ с подволнами 3-3-3-3-3.
Ending Diagonal (3-3-3-3-3) - Завершающая диагональ с подволнами 3-3-3-3-3.
Expanding Diagonal (3-3-3-3-3) - Расширяющаяся диагональ.
Expanding Impulse - Расширяющийся импульс.
Truncated Impulse - Усеченный импульс.
Failed 5th Wave Impulse - Импульс с неудачной пятой волной.
Extended 1st and 3rd Waves Impulse - Импульс с удлиненными первой и третьей волнами.
Running Correction Wave 2 Impulse - Импульс с бегущей коррекцией во второй волне.
Running Correction Wave 4 Impulse - Импульс с бегущей коррекцией в четвертой волне.
Extended 1st and 5th Waves Impulse - Импульс с удлиненными первой и пятой волнами.
Extended 2nd Wave Impulse - Импульс с удлиненной второй волной.
Double Truncated 5th Wave Impulse - Импульс с дважды усеченной пятой волной.
Converging Diagonal - Сходящаяся диагональ.
Running Flat Wave 2 Impulse - Импульс с плоской бегущей коррекцией во второй волне.
Running Flat Wave 4 Impulse - Импульс с плоской бегущей коррекцией в четвертой волне.
Double Extended 1st and 3rd Waves Impulse - Импульс с двойным удлинением первой и третьей волн.
Double Extended 3rd and 5th Waves Impulse - Импульс с двойным удлинением третьей и пятой волн.
Leading Diagonal with Failed 5th Wave - Ведущая диагональ с неудачной пятой волной.
Complex Correction Wave 2 (Double Zigzag) Impulse - Импульс с комплексной коррекцией во второй волне (двойной зигзаг).
Complex Correction Wave 4 (Triangle) Impulse - Импульс с комплексной коррекцией в четвертой волне (треугольник).
Terminal Impulse - Терминальный импульс.
Extended 4th Wave Impulse - Импульс с удлиненной четвертой волной.
Diagonal with Overlap - Диагональ с перекрытием.
Nested Extension Wave 3 Impulse - Импульс с вложенным удлинением третьей волны.
Failed Wave 1 Impulse - Импульс с неудачной первой волной.
Double Running Correction Impulse - Импульс с двойной бегущей коррекцией.
Converging Impulse - Сходящийся импульс.
Expanding Leading Diagonal - Расширяющаяся ведущая диагональ.
Truncated Ending Diagonal - Усеченная завершающая диагональ.
Irregular Wave 2 Impulse - Импульс с нерегулярной второй волной.
Sharp Wave 4 Impulse - Импульс с резкой четвертой волной.
Diagonal Impulse Variant - Вариант диагонального импульса.
Extended Symmetrical Impulse - Удлиненный симметричный импульс.

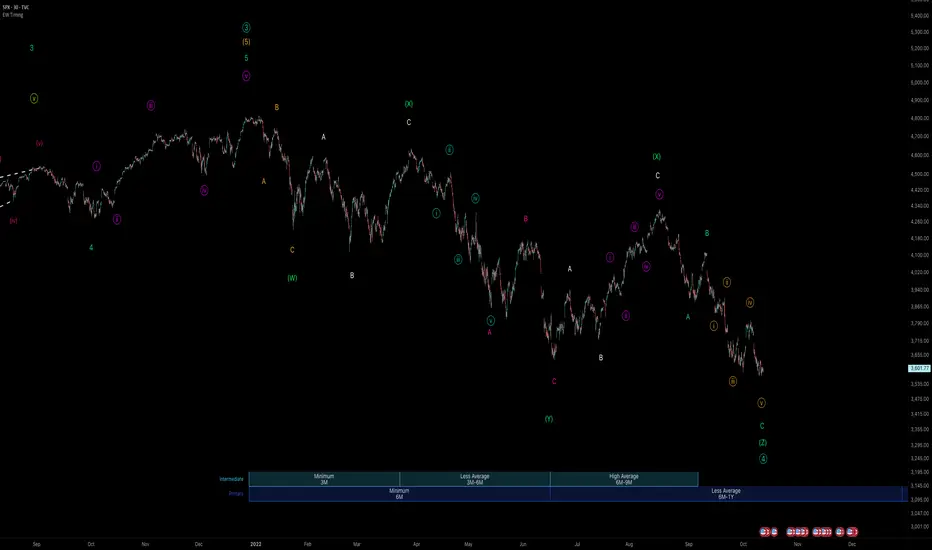
zSph x Larry Waves Wave Degree TimingElliott Waves are fractal structures governed by time. The categorization of time in relation to Elliott Wave is named ‘Wave Degree’.
All waves are characterized by relative size called degree. The degree of a wave is determined by its size and position relative to lesser waves (smaller time and size), corresponding waves (similar time and size) and encompassing waves (greater time and size).
Elliott named 9 degrees (Supercycle – Subminuette).
Elliott also stated the Subminuette degree is discernable on the HOURLY chart.
# Concept
BINANCE:BTCUSDT
Degree is governed by Time yet it is not based upon time lengths (or price lengths), rather it is based on form and structure – a function of both price and time.
The precise degree may not be identified in real time, yet the objective is to be within +/- 1 standard deviation of the expected degree to be aware of the overall market progression.
Understanding degree helps in the identification of when an impulse or a correction is nearing completion and to be aware of the major pivot in price action to occur as a result of the completion of a major expansion or major retracement and be aware of when major pivots in price relating to major expansions and major retracements by managing expectations from a time perspective.
*Important to understand* : If price is currently in a Wave Degree Extension or a Very Complex Correction, the wave degree timings will be distorted (extended in time).
Example: A Cycle typically lasts a few years - yet can last a decade(s) in an Extension.
It’s best to keep the analysis on the Minute/Minuette timeframe to manage timing expectations yet always refer back to the Higher Time Frame Structure.***
# Correct Usage
BEFORE PLACING THE ANCHOR TO DISPLAY ZONES:
Completion of prior wave structure should be completed and there needs to be confirmation the next wave structure is in progression, such as a change in market structure.
Anchor :
Best to anchor on the higher time frame to ensure you always have the anchor point defined when you scale down/move down in the timeframes.
Ensure the anchor point is placed at the termination of a structure/beginning of a new structure (Generally they will be price extremes – extreme highs and lows)
Zones :
Minimum Zones : The minimum amount of time of completion for a single wave structure to complete for a degree.
Average Zones : The average amount of time of completion for a single wave structure to complete for a degree.
Maximum Zones : The general maximum amount of time of completion for a single wave structure to complete for a degree.
Wave Degree Timeframe Analysis :
Higher-Level Degrees (Primary, Intermediate, Minor) - Utilize on H4+ timeframe
Lower-Level Degrees (Minute, Minuette, Subminuette) – Utilize on 15M to H4 timeframe
Micro-Level Degrees (Micro and Submicro) – Utilize on timeframes less than 15M
(There is a chart in the settings you can toggle on/off that reiterates this as well.)
# Settings
Y-Axis Offset :
It is a scale relative to the asset being viewed. Example:
- If using on Bitcoin, Bitcoin moves on average $1,000 of dollars up or down (on the Y-Axis), therefore it would be relevant to use values with 4 nominal values to offset it correctly to view easier on the chart as needed.
- If using on SP500, SP500 moves on average $50-100 of dollars up or down (on the Y-Axis), therefore it would be relevant to use values with 2 or 3 nominal values to offset it correctly to view easier on the chart as needed.
Extend :
This option allows to extend lines for the borders of the zones towards price action.
CDV Momentum WaveDescription:
This indicator visualizes the Cumulative Delta Volume (CDV) as waves, providing traders with insights into the momentum and strength of buying and selling activity. By tracking the cumulative difference between buying and selling pressure, it highlights shifts in market sentiment with color-coded wave patterns.
How to Use:
Spot Momentum:
Green waves signify strong buying pressure, while red waves indicate dominant selling pressure. Blue and orange waves mark transitions or weaker momentum.
Trend Analysis:
Persistent color and direction in waves reflect a strong trend, while frequent shifts may signal reversals or consolidation.
Sensitivity Adjustment:
Use the mul2 setting to fine-tune wave responsiveness for short-term or long-term analysis.
Wave Position Adjustment:
The osx setting adjusts the visual placement of the waves on the chart.
By default (osx = 0), the waves are aligned directly with the candle data they are calculated from.
Increasing osx shifts the waves forward.
Decreasing osx shifts the waves backward.
This tool helps traders detect momentum shifts, confirm trends, and understand volume dynamics in various market conditions.

MTF WaveTrend [CryptoSea]The MTF WaveTrend Indicator is a sophisticated tool designed to enhance market analysis through multi-timeframe WaveTrend calculations. This tool is built for traders who seek to identify market momentum and potential reversals with higher accuracy.
In the example below, we can see all the choosen timeframes agree on bearish momentum.
Key Features
Multi-Timeframe WaveTrend Analysis: Tracks WaveTrend values across multiple timeframes to provide a comprehensive view of market momentum.
Customizable Colour Rules: Offers three different colour rules (Traditional, WT1 0 Rule, WT1 & WT2 0 Rule) to suit various trading strategies.
Timeframe Visibility Control: Allows users to enable or disable specific timeframes, providing flexibility in analysis.
Clear Visual Indicators: Uses color-coded squares and labels to clearly display WaveTrend status across different timeframes.
Candle Colouring Option: Includes a setting for neutral candle coloring to enhance chart readability.
This example shows what can happen when all timeframes start alligning with eachother.
How it Works
WaveTrend Calculation: Computes the WaveTrend oscillator by applying a series of exponential moving averages and scaling calculations.
Multi-Timeframe Data Aggregation: Utilizes the `request.security` function to gather and display WaveTrend values from various timeframes without repainting issues.
Conditional Plotting: Displays visual cues only when higher timeframes align with the selected timeframe, ensuring relevant and reliable signals.
Dynamic Colour Rules: Adjusts the indicator colors based on the chosen rule, whether it's a traditional crossover, WT1 crossing zero, or both WT1 & WT2 crossing zero.
Traditional: Colors are determined by the relationship between WT1 and WT2. If WT1 is greater than WT2, it is bullish (bullColour), otherwise bearish (bearColour).
WT1 0 Rule: Colors are based on whether WT1 is above or below zero. WT1 above zero is bullish (bullColour), below zero is bearish (bearColour).
WT1 & WT2 0 Rule: A more complex rule where both WT1 and WT2 need to be above zero for a bullish signal (bullColour) or both below zero for a bearish signal (bearColour). If WT1 and WT2 are not in agreement, a neutral color (neutralColour) is displayed.
This indicator will make sure that the lowest timeframe you can see data from will be the timeframe you are on. This is to avoid false signals as you cannot display 3 x 5 minute candles whilst looking at the 15 minute candle.
Application
Strategic Decision-Making: Assists traders in making informed decisions by providing detailed analysis of WaveTrend movements across different timeframes.
Trend Confirmation: Reinforces trading strategies by confirming potential reversals with multi-timeframe WaveTrend analysis.
Customized Analysis: Adapts to various trading styles with extensive input settings that control the display and sensitivity of WaveTrend data.
The MTF WaveTrend Indicator by is an invaluable addition to a trader's toolkit, offering depth and precision in market trend analysis to navigate complex market conditions effectively.
[GYTS-CE] Signal Provider | WaveTrend 4D with QMCWaveTrend 4D with Quantile Median Crosses (Community Edition)
🌸 " 📡 Signal Provider" in GoemonYae Trading System (GYTS) 🌸
WaveTrend 4D (WT4D) is an extension of the incredible WaveTrend 3D (2022, Justin Dehorty) . This oscillator elevates the classic WaveTrend by integrating advanced mathematical models for a multi-dimensional view of market momentum, capturing subtle shifts and trends that traditional indicators might miss. Each oscillator layer uses a combination of normalised derivatives, hyperbolic tangent transformations, and dual-pole filtering (John Ehlers' SuperSmoother), providing normalised and smooth signals with minimised lag.
The name "WaveTrend 4D" is derived from the usage of 4 dimensions, representing different frequencies or timeframes. Next to the "fast", "normal" and "slow" frequency, the fourth frequency is called "lethargic" (very slow). This gives the opportunity utilise more dimensions without having abundant signals, since we quantify and filter the quality of signals.
WT4D strives to help discriminating high-quality signals from the indicator by introducing the Gradient Divergence Measure (GDM) and Quantile Median Crosses (QMC). For simplicity, speed and focus, this particular indicator includes only the QMC part. Check the other 🤲Community Edition of this indicator that focuses on the GDM. For QMC, see below for more information.
🌸 --- QUANTILE MEDIAN CROSSES (QMC) --- 🌸
💮 Introduction
--
A powerful approach when working with WaveTrend is to use the frequencies' crossings of the median (zero) line. This would signify a continuation of the reversal. However, not all of those crossings would be trades with a high probability of success. For this reason, we strive to only consider reversals after the most strong trends start to show weakness. We call these reversals the "Quantile Median Crosses" (QMC), deriving the name from the used methodology.
💮 Methodology
--
To find these "most strong trends", we calculate the integral ("the area") of a frequency between all historical median crosses, and take an upper quantile of those integrals. This means that when the frequency is crossing the median in a period of consolidation, the areas between those crosses would be small. But if there was a strong momentum, and the frequency would separate itself significantly from the median and would do so for a long time, its area would be large.
So after considering all the past integrals, we take the upper quantile of those (i.e. sort all integrals and for example take the top 5%) and if the latest trend's integral was in this upper quantile, it is considered "significant". Hence, the name "quantile" in the name "Quantile Median Cross".
💮 QMC on the Oscillator
--
The QMC is shown as a label "🔴" above the median or with "🟢" below the median. The normal frequency has a "bronze" colour, the slow frequency "silver" and the lethargic is "gold". In addition to the labels, there are also diamond shapes in the same colour drawn on the median in the oscillator. This represents the previous median crossing, and helps the user to see between which two points the integral is calculated.
🌸 --- GOEMONYAE TRADING SYSTEM --- 🌸
As previously mentioned, this indicator is a 📡 Signal Provider, part of the suite of the GoemonYae Trading System (🤲 Community Edition). The greatest value comes from connecting multiple 📡 Signal Providers to the 🧬 Flux Composer to find confluence between signals. Contrary to most other indicators that connect with each other, the signals that are passed are not just binary signals ("buy" or "sell") but pass the actual GDM and QMC values. This gives the opportunity in the 🧬 Flux Composer to more accurately use multiple signals with different strengths to finally give an overall signal. On its turn, the Flux Composer can be connected to the GYTS "🎼 Order Orchestrator" for backtesting and trade automation.
